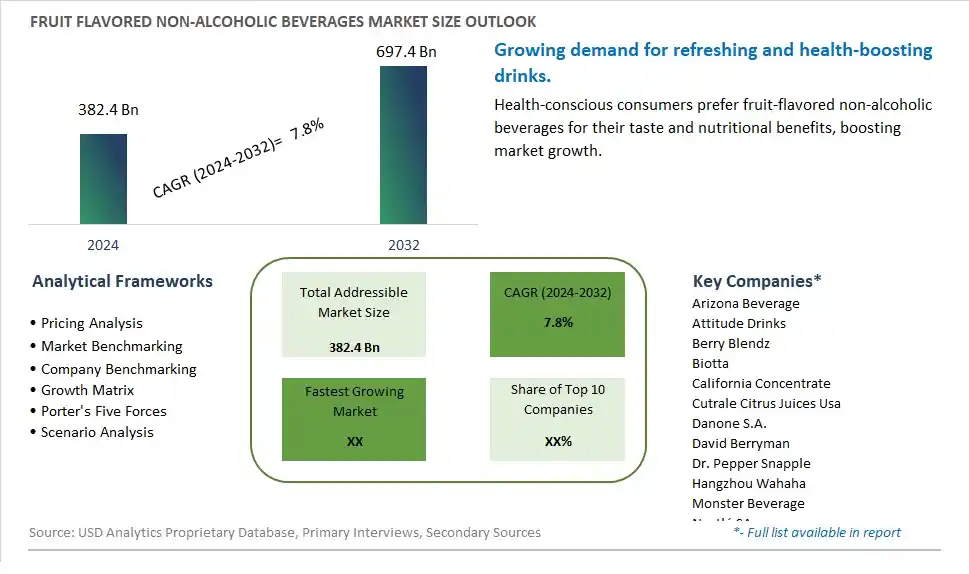
Global Fruit Flavored Non-Alcoholic Beverages Market Size is valued at $382.4 Billion in 2024 and is forecast to register a growth rate (CAGR) of 7.8% to reach $697.4 Billion by 2032.
The global Fruit Flavored Non-Alcoholic Beverages Market Comprehensive Study analyzes and forecasts the market size across 6 regions and 24 countries for diverse segments -By Type (Juices, Frappes, Milkshakes, Flavored Teas, Mocktails, Smoothies), By Application (Store-based Retailing, E-commerce)
An Introduction to Fruit Flavored Non-Alcoholic Beverages Market
The Fruit Flavored Non-Alcoholic Beverages Market focuses on the production and sale of beverages flavored with natural fruit extracts, catering to consumers seeking refreshing and healthy drink options. The market is driven by increasing demand for natural and low-calorie beverages, rising awareness about the benefits of fruit-based drinks, and growing popularity of functional and flavored beverages. Additionally, advancements in beverage formulations and the expansion of distribution channels support market growth.
Fruit Flavored Non Alcoholic Beverages Competitive Landscape
The market report analyses the leading companies in the industry including Arizona Beverage, Attitude Drinks, Berry Blendz, Biotta, California Concentrate, Cutrale Citrus Juices Usa, Danone S.A., David Berryman, Dr. Pepper Snapple, Hangzhou Wahaha, Monster Beverage, Nestlé SA, Parle Agro, PepsiCo Inc, The Coca-Cola Company, The Kraft Heinz Company, and Others.
Fruit Flavored Non Alcoholic Beverages Market Dynamics
Fruit Flavored Non-Alcoholic Beverages Market Trend: Rising Popularity of Natural and Functional Beverages
The most prominent trend in the Fruit Flavored Non-Alcoholic Beverages Market is the rising popularity of natural and functional beverages. As consumers seek refreshing and health-boosting drink options, fruit-flavored non-alcoholic beverages are gaining traction for their natural ingredients and added health benefits. This trend is driven by the increasing demand for beverages that provide hydration, nutrition, and overall wellness benefits without artificial additives.
Fruit Flavored Non-Alcoholic Beverages Market Driver: Growth in Health and Wellness Consciousness
The key driver of the Fruit Flavored Non-Alcoholic Beverages Market is the growth in health and wellness consciousness among consumers. As more people focus on boosting their immune systems and incorporating nutrient-rich foods into their diets, the demand for fruit-flavored beverages, known for their vitamins and antioxidants, continues to rise. This driver is supported by the trend towards using natural ingredients in beverages and the desire for healthier drink options, driving market growth.
Fruit Flavored Non-Alcoholic Beverages Market Opportunity: Innovation in Beverage Formulations and Packaging
A significant opportunity in the Fruit Flavored Non-Alcoholic Beverages Market lies in innovation in beverage formulations and packaging. By developing new and unique flavors, incorporating functional ingredients such as vitamins and minerals, and offering convenient packaging solutions, companies can attract a broader audience. Highlighting the health benefits and natural ingredients of these beverages can help drive consumer interest and market growth.
Fruit Flavored Non-Alcoholic Beverages Market Share Analysis- Largest Segment by Type
The Juices segment is the largest in the Fruit Flavored Non-Alcoholic Beverages Market by type. This dominance is driven by the high consumer demand for fruit juices, which are perceived as healthy and refreshing beverages. Fruit juices are widely consumed for their natural taste, vitamins, and antioxidants, making them a staple in many households and foodservice establishments. The continuous innovation in juice products, including the introduction of new flavors, blends, and fortified options, enhances their appeal. Additionally, the growing trend of health and wellness supports the significant market share of the juices segment, as consumers seek beverages that offer nutritional benefits. The extensive availability of fruit juices in supermarkets, convenience stores, and online platforms further boosts their accessibility to a broad consumer base. The strong consumer preference for natural and nutritious beverages reinforces the dominant position of the juices segment in the market.
Fruit Flavored Non-Alcoholic Beverages Market Share Analysis- Fastest Growing Segment by Application
The E-commerce segment is poised to grow the fastest in the Fruit Flavored Non-Alcoholic Beverages Market by application over the next five years. This rapid growth is driven by the increasing consumer shift towards online shopping and the convenience it offers. E-commerce platforms provide a wide variety of fruit-flavored non-alcoholic beverages, including niche and specialty products that may not be readily available in physical stores. The convenience of browsing and purchasing from home, coupled with the option of home delivery, appeals to a broad range of consumers. The COVID-19 pandemic has further accelerated the adoption of online shopping, and this trend continues as consumers appreciate the safety and convenience of having products delivered to their doorstep. Additionally, online retailers often offer competitive pricing, detailed product information, and customer reviews, which further drive consumer confidence and sales. The growth of digital marketing and targeted online advertisements also boosts the visibility and sales of fruit-flavored non-alcoholic beverages through e-commerce channels.
Fruit Flavored Non Alcoholic Beverages Market Segmentation
By Type
Juices
Frappes
Milkshakes
Flavored Teas
Mocktails
Smoothies
By Application
Store-based Retailing
E-commerce
Countries Analyzed
North America (US, Canada, Mexico)
Europe (Germany, UK, France, Spain, Italy, Russia, Rest of Europe)
Asia Pacific (China, India, Japan, South Korea, Australia, South East Asia, Rest of Asia)
South America (Brazil, Argentina, Rest of South America)
Middle East and Africa (Saudi Arabia, UAE, Rest of Middle East, South Africa, Egypt, Rest of Africa)
Fruit Flavored Non Alcoholic Beverages Companies Profiled in the Study
Arizona Beverage
Attitude Drinks
Berry Blendz
Biotta
California Concentrate
Cutrale Citrus Juices Usa
Danone S.A.
David Berryman
Dr. Pepper Snapple
Hangzhou Wahaha
Monster Beverage
Nestlé SA
Parle Agro
PepsiCo Inc
The Coca-Cola Company
The Kraft Heinz Company
*- List Not Exhaustive
Chapter 1. TABLE OF CONTENTS
Chapter 2. Introduction to Fruit Flavored Non Alcoholic Beverages Market
2.1. Market Overview
2.2. Key Statistics and Report Highlights
2.3. Scope of the Comprehensive Study
2.3.1. Market Definition
2.3.2 Countries and Regions Covered
2.3.3 Research Objective
2.3.4 Units, Currency, and Conversions
2.3.5 Industry Value Chain
2.4. Key Market Segments
2.5. Key Companies
2.6. Study Period
Chapter 3. Strategic Analysis Review
3.1. Fruit Flavored Non Alcoholic Beverages Pricing Analysis and Forecast
3.2. Porter’s Five Forces
3.3. Market Ecosystem
3.4. SWOT Analysis
3.5. Regulatory Scenario
3.3. Effects of Inflation, Russia-Ukraine War, moderating economic growth, and other macroeconomic factors
Chapter 4. Competitive Landscape
4.1. Market Share Analysis
4.1.1. Global Fruit Flavored Non Alcoholic Beverages Market Share by Company, 2023
4.1.2. Product Offerings of Leading Fruit Flavored Non Alcoholic Beverages Companies
4.2. Market Entropy
4.2.1. New Product Launches in the Industry
4.2.2. Mergers, Acquisitions, Joint ventures, and Partnerships
4.3. Key Strategies and Best Practices
Chapter 5. Global Market Projections: Best, Reference, and Low Case Scenarios
5.1. Growth Analysis- Case Scenario Definitions
5.2. Low Growth Case Scenario Forecasts
5.3. Reference Growth Case Scenario Forecasts
5.4. High Growth Case Scenario Forecasts
Chapter 6. Market Dynamics
6.1. Fruit Flavored Non Alcoholic Beverages Market Drivers
6.2. Fruit Flavored Non Alcoholic Beverages Market Challenges
6.6. Fruit Flavored Non Alcoholic Beverages Market Opportunities
6.4. Fruit Flavored Non Alcoholic Beverages Market Trends
Chapter 7. Global Fruit Flavored Non Alcoholic Beverages Market Outlook Trends
7.1. Global Fruit Flavored Non Alcoholic Beverages Revenue (USD Million) and CAGR (%) by Type (2021-2032)
7.2. Global Fruit Flavored Non Alcoholic Beverages Revenue (USD Million) and CAGR (%) by Application (2021-2032)
7.3. Global Fruit Flavored Non Alcoholic Beverages Revenue (USD Million) and CAGR (%) by Product (2021-2032)
By Type
Juices
Frappes
Milkshakes
Flavored Teas
Mocktails
Smoothies
By Application
Store-based Retailing
E-commerce
Chapter 8. Global Fruit Flavored Non Alcoholic Beverages Regional Analysis and Outlook
8.1. Global Fruit Flavored Non Alcoholic Beverages Revenue (USD Million) By Regions (2021- 2032)
8.2. North America Fruit Flavored Non Alcoholic Beverages Revenue (USD Million) by Country (2021-2032)
8.2.1. United States Fruit Flavored Non Alcoholic Beverages Regional Analysis and Outlook
8.2.2. Canada Fruit Flavored Non Alcoholic Beverages Regional Analysis and Outlook
8.2.3. Mexico Fruit Flavored Non Alcoholic Beverages Regional Analysis and Outlook
8.3. Europe Fruit Flavored Non Alcoholic Beverages Revenue (USD Million), by Country (2021-2032)
8.3.1. Germany Fruit Flavored Non Alcoholic Beverages Regional Analysis and Outlook
8.3.2. France Fruit Flavored Non Alcoholic Beverages Regional Analysis and Outlook
8.3.3. United Kingdom Fruit Flavored Non Alcoholic Beverages Regional Analysis and Outlook
8.3.4. Spain Fruit Flavored Non Alcoholic Beverages Regional Analysis and Outlook
8.3.5. Italy Fruit Flavored Non Alcoholic Beverages Regional Analysis and Outlook
8.3.6. Russia Fruit Flavored Non Alcoholic Beverages Regional Analysis and Outlook
8.3.7. Rest of Europe Fruit Flavored Non Alcoholic Beverages Regional Analysis and Outlook
8.4. Asia Pacific Fruit Flavored Non Alcoholic Beverages Revenue (USD Million) by Country (2021-2032)
8.4.1. China Fruit Flavored Non Alcoholic Beverages Regional Analysis and Outlook
8.4.2. Japan Fruit Flavored Non Alcoholic Beverages Regional Analysis and Outlook
8.4.3. India Fruit Flavored Non Alcoholic Beverages Regional Analysis and Outlook
8.4.4. South Korea Fruit Flavored Non Alcoholic Beverages Regional Analysis and Outlook
8.4.5. Australia Fruit Flavored Non Alcoholic Beverages Regional Analysis and Outlook
8.4.6. South East Asia Fruit Flavored Non Alcoholic Beverages Regional Analysis and Outlook
8.4.7. Rest of Asia Pacific Fruit Flavored Non Alcoholic Beverages Regional Analysis and Outlook
8.5. South America Fruit Flavored Non Alcoholic Beverages Revenue (USD Million), by Country (2021-2032)
8.5.1. Brazil Fruit Flavored Non Alcoholic Beverages Regional Analysis and Outlook
8.5.2. Argentina Fruit Flavored Non Alcoholic Beverages Regional Analysis and Outlook
8.5.3. Rest of South America Fruit Flavored Non Alcoholic Beverages Regional Analysis and Outlook
8.6. Middle East and Africa Fruit Flavored Non Alcoholic Beverages Revenue (USD Million) by Country (2021-2032)
8.6.1. Middle East Fruit Flavored Non Alcoholic Beverages Regional Analysis and Outlook
8.6.2. Africa Fruit Flavored Non Alcoholic Beverages Regional Analysis and Outlook
Chapter 9. North America Fruit Flavored Non Alcoholic Beverages Analysis and Outlook
9.1. North America Fruit Flavored Non Alcoholic Beverages Revenue (USD Million) by Segments (2021-2032)
9.1.1. North America Fruit Flavored Non Alcoholic Beverages Revenue (USD Million) by Type (2021-2032)
9.1.2. North America Fruit Flavored Non Alcoholic Beverages Revenue (USD Million) by Application (2021-2032)
9.1.3. North America Fruit Flavored Non Alcoholic Beverages Revenue (USD Million) by Product (2021-2032)
By Type
Juices
Frappes
Milkshakes
Flavored Teas
Mocktails
Smoothies
By Application
Store-based Retailing
E-commerce
Chapter 10. Europe Fruit Flavored Non Alcoholic Beverages Analysis and Outlook
10.1. Europe Fruit Flavored Non Alcoholic Beverages Revenue (USD Million), by Segments (USD Million) (2021-2032)
10.1.1. Europe Fruit Flavored Non Alcoholic Beverages Revenue (USD Million) by Type (2021-2032)
10.1.2. Europe Fruit Flavored Non Alcoholic Beverages Revenue (USD Million) by Application (2021-2032)
10.1.3. Europe Fruit Flavored Non Alcoholic Beverages Revenue (USD Million) by Product (2021-2032)
By Type
Juices
Frappes
Milkshakes
Flavored Teas
Mocktails
Smoothies
By Application
Store-based Retailing
E-commerce
Chapter 11. Asia Pacific Fruit Flavored Non Alcoholic Beverages Analysis and Outlook
11.1. Asia Pacific Fruit Flavored Non Alcoholic Beverages Revenue (USD Million), and Revenue (USD Million) by Segments (2021-2032)
11.1.1. Asia Pacific Fruit Flavored Non Alcoholic Beverages Revenue (USD Million) by Type (2021-2032)
11.1.2. Asia Pacific Fruit Flavored Non Alcoholic Beverages Revenue (USD Million) by Application (2021-2032)
11.1.3. Asia Pacific Fruit Flavored Non Alcoholic Beverages Revenue (USD Million) by Product (2021-2032)
By Type
Juices
Frappes
Milkshakes
Flavored Teas
Mocktails
Smoothies
By Application
Store-based Retailing
E-commerce
Chapter 12. South America Fruit Flavored Non Alcoholic Beverages Analysis and Outlook
12.1. South America Fruit Flavored Non Alcoholic Beverages Revenue (USD Million), by Segments (2021-2032)
12.1.1. South America Fruit Flavored Non Alcoholic Beverages Revenue (USD Million) by Type (2021-2032)
12.1.2. South America Fruit Flavored Non Alcoholic Beverages Revenue (USD Million) by Application (2021-2032)
12.1.3. South America Fruit Flavored Non Alcoholic Beverages Revenue (USD Million) by Product (2021-2032)
By Type
Juices
Frappes
Milkshakes
Flavored Teas
Mocktails
Smoothies
By Application
Store-based Retailing
E-commerce
Chapter 13. Middle East and Africa Fruit Flavored Non Alcoholic Beverages Analysis and Outlook
13.1. Middle East and Africa Fruit Flavored Non Alcoholic Beverages Revenue (USD Million), by Segments (2021-2032)
13.1.1. Middle East and Africa Fruit Flavored Non Alcoholic Beverages Revenue (USD Million) by Type (2021-2032)
13.1.2. Middle East and Africa Fruit Flavored Non Alcoholic Beverages Revenue (USD Million) by Application (2021-2032)
13.1.3. Middle East and Africa Fruit Flavored Non Alcoholic Beverages Revenue (USD Million) by Product (2021-2032)
By Type
Juices
Frappes
Milkshakes
Flavored Teas
Mocktails
Smoothies
By Application
Store-based Retailing
E-commerce
Chapter 14. Fruit Flavored Non Alcoholic Beverages Company Profiles
14.1 Business Overview
14.2 Product Profiles
14.3 SWOT Profiles
14.5 Recent Developments
14.6 Financial Profile
List of Companies
Arizona Beverage
Attitude Drinks
Berry Blendz
Biotta
California Concentrate
Cutrale Citrus Juices Usa
Danone S.A.
David Berryman
Dr. Pepper Snapple
Hangzhou Wahaha
Monster Beverage
Nestlé SA
Parle Agro
PepsiCo Inc
The Coca-Cola Company
The Kraft Heinz Company
15. Methodology and Data Sources
15.1 Customization Offerings
15.2 Subscription Services
15.3 Related Reports
15.4 Publisher Expertise
LIST OF TABLES
Table 1 Market Segmentation Analysis
Table 2 Global Fruit Flavored Non Alcoholic Beverages Market Share of Leading Companies, 2023
Table 3 Product Offerings of Leading Companies
Table 4 Low Growth Scenario Forecasts
Table 5 Reference Case Growth Scenario
Table 6 High Growth Case Scenario
Table 7 Global Fruit Flavored Non Alcoholic Beverages Revenue (USD Million) And CAGR (%) By Type (2021-2032)
Table 8 Global Fruit Flavored Non Alcoholic Beverages Revenue (USD Million) And CAGR (%) By Application (2021-2032)
Table 9 Global Fruit Flavored Non Alcoholic Beverages Revenue (USD Million) And CAGR (%) By Product (2021-2032)
Table 10 Global Fruit Flavored Non Alcoholic Beverages Market Revenue (USD Million) By Regions (2021-2032)
Table 11 Global Fruit Flavored Non Alcoholic Beverages Market Share (%) By Regions (2021-2032)
Table 12 North America Fruit Flavored Non Alcoholic Beverages Revenue (USD Million) By Country (2021-2032)
Table 13 Europe Fruit Flavored Non Alcoholic Beverages Revenue (USD Million) By Country (2021-2032)
Table 14 Asia Pacific Fruit Flavored Non Alcoholic Beverages Revenue (USD Million) By Country (2021-2032)
Table 15 South America Fruit Flavored Non Alcoholic Beverages Revenue (USD Million) By Country (2021-2032)
Table 16 Middle East and Africa Fruit Flavored Non Alcoholic Beverages Revenue (USD Million) By Region (2021-2032)
Table 17 North America Fruit Flavored Non Alcoholic Beverages Revenue (USD Million) By Type (2021-2032)
Table 18 North America Fruit Flavored Non Alcoholic Beverages Revenue (USD Million) By Application (2021-2032)
Table 19 North America Fruit Flavored Non Alcoholic Beverages Revenue (USD Million) By Product (2021-2032)
Table 20 Europe Fruit Flavored Non Alcoholic Beverages Revenue (USD Million) By Type (2021-2032)
Table 21 Europe Fruit Flavored Non Alcoholic Beverages Revenue (USD Million) By Application (2021-2032)
Table 22 Europe Fruit Flavored Non Alcoholic Beverages Revenue (USD Million) By Product (2021-2032)
Table 23 Asia Pacific Fruit Flavored Non Alcoholic Beverages Revenue (USD Million) By Type (2021-2032)
Table 24 Asia Pacific Fruit Flavored Non Alcoholic Beverages Revenue (USD Million) By Application (2021-2032)
Table 25 Asia Pacific Fruit Flavored Non Alcoholic Beverages Revenue (USD Million) By Product (2021-2032)
Table 26 South America Fruit Flavored Non Alcoholic Beverages Revenue (USD Million) By Type (2021-2032)
Table 27 South America Fruit Flavored Non Alcoholic Beverages Revenue (USD Million) By Application (2021-2032)
Table 28 South America Fruit Flavored Non Alcoholic Beverages Revenue (USD Million) By Product (2021-2032)
Table 29 Middle East and Africa Fruit Flavored Non Alcoholic Beverages Revenue (USD Million) By Type (2021-2032)
Table 30 Middle East and Africa Fruit Flavored Non Alcoholic Beverages Revenue (USD Million) By Application (2021-2032)
Table 31 Middle East and Africa Fruit Flavored Non Alcoholic Beverages Revenue (USD Million) By Product (2021-2032)
LIST OF FIGURES
Figure 1. Market Scope
Figure 2. Pricing Forecasts Per Unit, 2023- 2032
Figure 3. Porter’s Five Forces
Figure 4. Global Fruit Flavored Non Alcoholic Beverages Market Revenue (USD Million) By Regions (2021-2032)
Figure 5. Global Fruit Flavored Non Alcoholic Beverages Market Share (%) By Regions (2023)
Figure 6. North America Fruit Flavored Non Alcoholic Beverages Revenue (USD Million) By Country (2021-2032)
Figure 7. United States Fruit Flavored Non Alcoholic Beverages Revenue (USD Million) By Country (2021-2032)
Figure 8. Canada Fruit Flavored Non Alcoholic Beverages Revenue (USD Million) By Country (2021-2032)
Figure 9. Mexico Fruit Flavored Non Alcoholic Beverages Revenue (USD Million) By Country (2021-2032)
Figure 10. Europe Fruit Flavored Non Alcoholic Beverages Revenue (USD Million) By Country (2021-2032)
Figure 11. Germany Fruit Flavored Non Alcoholic Beverages Revenue (USD Million) By Country (2021-2032)
Figure 12. France Fruit Flavored Non Alcoholic Beverages Revenue (USD Million) By Country (2021-2032)
Figure 13. United Kingdom Fruit Flavored Non Alcoholic Beverages Revenue (USD Million) By Country (2021-2032)
Figure 14. Spain Fruit Flavored Non Alcoholic Beverages Revenue (USD Million) By Country (2021-2032)
Figure 15. Italy Fruit Flavored Non Alcoholic Beverages Revenue (USD Million) By Country (2021-2032)
Figure 16. Russia Fruit Flavored Non Alcoholic Beverages Revenue (USD Million) By Country (2021-2032)
Figure 17. Rest of Europe Fruit Flavored Non Alcoholic Beverages Revenue (USD Million) By Country (2021-2032)
Figure 11. Asia Pacific Fruit Flavored Non Alcoholic Beverages Revenue (USD Million) By Country (2021-2032)
Figure 12. China Fruit Flavored Non Alcoholic Beverages Revenue (USD Million) By Country (2021-2032)
Figure 13. Japan Fruit Flavored Non Alcoholic Beverages Revenue (USD Million) By Country (2021-2032)
Figure 14. India Fruit Flavored Non Alcoholic Beverages Revenue (USD Million) By Country (2021-2032)
Figure 15. South Korea Fruit Flavored Non Alcoholic Beverages Revenue (USD Million) By Country (2021-2032)
Figure 16. Australia Fruit Flavored Non Alcoholic Beverages Revenue (USD Million) By Country (2021-2032)
Figure 17. South East Asia Fruit Flavored Non Alcoholic Beverages Revenue (USD Million) By Country (2021-2032)
Figure 18. South America Fruit Flavored Non Alcoholic Beverages Revenue (USD Million) By Country (2021-2032)
Figure 19. Brazil Fruit Flavored Non Alcoholic Beverages Revenue (USD Million) By Country (2021-2032)
Figure 20. Argentina Fruit Flavored Non Alcoholic Beverages Revenue (USD Million) By Country (2021-2032)
Figure 21. Rest of Asia Pacific Fruit Flavored Non Alcoholic Beverages Revenue (USD Million) By Country (2021-2032)
Figure 22. Middle East and Africa Fruit Flavored Non Alcoholic Beverages Revenue (USD Million) By Region (2021-2032)
Figure 23. Saudi Arabia Fruit Flavored Non Alcoholic Beverages Revenue (USD Million) By Region (2021-2032)
Figure 24. The UAE Fruit Flavored Non Alcoholic Beverages Revenue (USD Million) By Region (2021-2032)
Figure 25. Rest of Middle East Fruit Flavored Non Alcoholic Beverages Revenue (USD Million) By Region (2021-2032)
Figure 26. South Africa Fruit Flavored Non Alcoholic Beverages Revenue (USD Million) By Region (2021-2032)
Figure 27. Africa Fruit Flavored Non Alcoholic Beverages Revenue (USD Million) By Region (2021-2032)
Figure 28. North America Fruit Flavored Non Alcoholic Beverages Revenue (USD Million) By Type (2021-2032)
Figure 29. North America Fruit Flavored Non Alcoholic Beverages Revenue (USD Million) By Application (2021-2032)
Figure 30. North America Fruit Flavored Non Alcoholic Beverages Revenue (USD Million) By Product (2021-2032)
Figure 31. Europe Fruit Flavored Non Alcoholic Beverages Revenue (USD Million) By Type (2021-2032)
Figure 32. Europe Fruit Flavored Non Alcoholic Beverages Revenue (USD Million) By Application (2021-2032)
Figure 33. Europe Fruit Flavored Non Alcoholic Beverages Revenue (USD Million) By Product (2021-2032)
Figure 34. Asia Pacific Fruit Flavored Non Alcoholic Beverages Revenue (USD Million) By Type (2021-2032)
Figure 35. Asia Pacific Fruit Flavored Non Alcoholic Beverages Revenue (USD Million) By Application (2021-2032)
Figure 36. Asia Pacific Fruit Flavored Non Alcoholic Beverages Revenue (USD Million) By Product (2021-2032)
Figure 37. South America Fruit Flavored Non Alcoholic Beverages Revenue (USD Million) By Type (2021-2032)
Figure 38. South America Fruit Flavored Non Alcoholic Beverages Revenue (USD Million) By Application (2021-2032)
Figure 39. South America Fruit Flavored Non Alcoholic Beverages Revenue (USD Million) By Product (2021-2032)
Figure 40. Middle East and Africa Fruit Flavored Non Alcoholic Beverages Revenue (USD Million) By Type (2021-2032)
Figure 41. Middle East and Africa Fruit Flavored Non Alcoholic Beverages Revenue (USD Million) By Application (2021-2032)
Figure 42. Middle East and Africa Fruit Flavored Non Alcoholic Beverages Revenue (USD Million) By Product (2021-2032)
By Type
Juices
Frappes
Milkshakes
Flavored Teas
Mocktails
Smoothies
By Application
Store-based Retailing
E-commerce
Countries Analyzed
North America (US, Canada, Mexico)
Europe (Germany, UK, France, Spain, Italy, Russia, Rest of Europe)
Asia Pacific (China, India, Japan, South Korea, Australia, South East Asia, Rest of Asia)
South America (Brazil, Argentina, Rest of South America)
Middle East and Africa (Saudi Arabia, UAE, Rest of Middle East, South Africa, Egypt, Rest of Africa)
