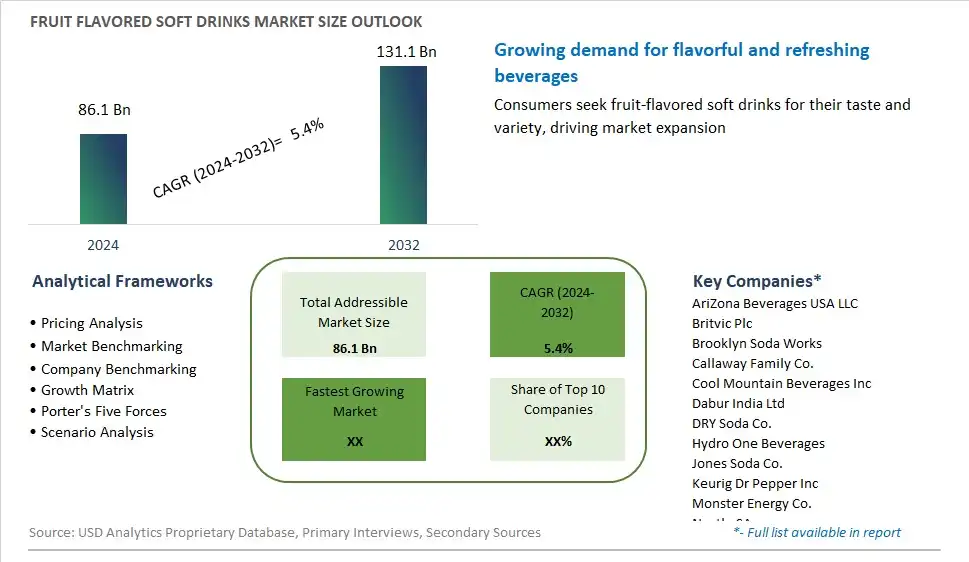
Global Fruit Flavored Soft Drinks Market Size is valued at $86.1 Billion in 2024 and is forecast to register a growth rate (CAGR) of 5.4% to reach $131.1 Billion by 2032.
The global Fruit Flavored Soft Drinks Market Comprehensive Study analyzes and forecasts the market size across 6 regions and 24 countries for diverse segments -By Product (Fruit-flavored Carbonated Soft Drinks, Fruit-flavored Non-carbonated Soft Drinks), By sales channel (Supermarkets/ Hypermarkets, Departmental Store, Online), By Flavor (Orange, Apple, Mixed, Pineapple, Grapefruit, Mango, Others)
An Introduction to Fruit Flavored Soft Drinks Market
Fruit flavored soft drinks offer consumers a refreshing and flavorful alternative to traditional carbonated beverages, combining the sweetness of fruit with the fizz of soda in 2024. These beverages come in a variety of fruity flavors, including citrus, berry, tropical, and exotic blends, appealing to diverse taste preferences. Fruit flavored soft drinks are valued for their thirst-quenching properties, bold flavors, and vibrant colors, making them popular choices for quenching thirst and satisfying cravings. Moreover, with the growing demand for healthier beverage options, many fruit flavored soft drinks are made with natural fruit flavors and sweeteners, offering a guilt-free indulgence for health-conscious consumers. Additionally, the availability of low-calorie and sugar-free options further enhances the appeal of fruit flavored soft drinks to consumers seeking to reduce their sugar intake. As consumer preferences continue to evolve towards healthier and more natural products, the market for fruit flavored soft drinks is expected to experience continued growth and innovation, offering endless possibilities for delicious and refreshing beverage experiences.
Fruit flavored Soft Drinks Competitive Landscape
The market report analyses the leading companies in the industry including AriZona Beverages USA LLC, Britvic Plc, Brooklyn Soda Works, Callaway Family Co., Cool Mountain Beverages Inc, Dabur India Ltd, DRY Soda Co., Hydro One Beverages, Jones Soda Co., Keurig Dr Pepper Inc, Monster Energy Co., Nestle SA, PepsiCo Inc, Red Bull GmbH, The coca cola co., and Others.
Fruit flavored Soft Drinks Market Dynamics
Fruit flavored Soft Drinks Market Trend: Shift Towards Healthier Beverage Options
A significant trend in the fruit-flavored soft drinks market is the shift towards healthier beverage options, driven by increasing consumer awareness of the impact of sugary drinks on health and wellness. Consumers are becoming more conscious of their sugar intake and are seeking alternatives to traditional carbonated soft drinks that offer refreshing flavors without the excessive sugar content. Fruit-flavored soft drinks present an attractive option as they provide the familiar taste of fruit while often containing less sugar or being sweetened with natural alternatives like stevia or monk fruit. This trend reflects a broader movement towards healthier lifestyles and dietary choices, with consumers seeking beverages that are perceived as better-for-you options without compromising on taste or enjoyment.
Market Driver: Demand for Refreshing and Flavorful Alternatives
A key driver of the fruit-flavored soft drinks market is the demand for refreshing and flavorful alternatives to traditional carbonated soft drinks, particularly among younger demographics and health-conscious consumers. Fruit-flavored soft drinks offer a diverse range of flavors, from classic options like orange and lemon to more exotic choices such as mango, raspberry, and pineapple. These beverages provide a refreshing and hydrating option for consumers seeking a break from plain water or looking for a more exciting alternative to sugary sodas. Additionally, the availability of low-calorie and sugar-free varieties appeals to consumers looking to manage their calorie intake while still enjoying a flavorful beverage experience. This driver underscores the importance of taste and variety in driving consumer interest and consumption of fruit-flavored soft drinks, particularly as preferences shift towards healthier beverage options.
Market Opportunity: Expansion into Natural and Functional Ingredients
An opportunity for growth in the fruit-flavored soft drinks market lies in the expansion into natural and functional ingredients that offer added health benefits and appeal to evolving consumer preferences. With growing interest in functional beverages and natural ingredients, there's an opportunity for manufacturers to innovate and differentiate their products by incorporating ingredients such as real fruit juices, botanical extracts, vitamins, and antioxidants. Fruit-flavored soft drinks can be positioned as more than just refreshment, but also as a source of hydration, energy, or even wellness support, depending on the added ingredients. Moreover, there's potential to tap into emerging trends such as CBD-infused beverages or adaptogenic blends that cater to specific consumer needs and interests. By leveraging the growing demand for natural and functional beverages, fruit-flavored soft drink brands can create differentiated products that resonate with health-conscious consumers and capture market share in the evolving beverage landscape.
Fruit flavored Soft Drinks Market Share Analysis: Fruit-flavored Carbonated Soft Drinks held the dominant market share in 2024
Within the Fruit Flavored Soft Drinks Market, the Fruit-flavored Carbonated Soft Drinks segment is the largest, propelled by its widespread popularity and refreshing taste. These carbonated beverages offer consumers a delightful fusion of fruit flavors with the effervescence of carbonation, creating a satisfying and fizzy drink experience. The appeal of fruit-flavored carbonated soft drinks lies in their versatility, catering to a broad spectrum of tastes and preferences. Additionally, the bubbly nature of these drinks enhances their sensory appeal, making them a favorite choice for consumers seeking a refreshing and indulgent beverage option. With a diverse range of flavors and innovative packaging formats, fruit-flavored carbonated soft drinks continue to dominate the market, solidifying their position as the largest segment in the Fruit Flavored Soft Drinks Market.
Fruit flavored Soft Drinks Market Share Analysis: Online Sales market is poised to register the fastest growth rae over the forecast period to 2032
In the dynamic landscape of the Fruit Flavored Soft Drinks Market, the Online Sales segment is the fastest-growing, driven by changing consumer behaviors and technological advancements. The convenience and accessibility offered by online shopping platforms have transformed the way consumers procure beverages, including fruit-flavored soft drinks. With the proliferation of e-commerce channels and mobile shopping apps, consumers can browse an extensive selection of drinks from the comfort of their homes, at any time of the day. Further, the COVID-19 pandemic has accelerated the adoption of online shopping as consumers prioritize safety and convenience. The ability to compare prices, read reviews, and access exclusive deals online has fueled the growth of the Online Sales segment, attracting a broader demographic of consumers. As digital infrastructure continues to evolve and online retailers invest in enhancing the user experience, the Online Sales segment is poised to sustain its rapid growth trajectory, reshaping the Fruit Flavored Soft Drinks Market landscape with innovation and convenience.
Fruit flavored Soft Drinks Market Share Analysis: Orange held the dominant market share in 2024
Within the Fruit Flavored Soft Drinks Market, the Orange flavor segment is the largest, propelled by its timeless appeal and widespread popularity. Orange-flavored soft drinks offer consumers a refreshing burst of citrus flavor, evoking nostalgia and satisfaction with each sip. The tangy sweetness of orange complements the carbonation, creating a harmonious and invigorating drinking experience. Further, the versatility of orange flavor lends itself well to various beverage formats, from traditional sodas to sparkling waters and energy drinks. With its refreshing taste profile and enduring consumer preference, the Orange flavor segment continues to dominate the market, solidifying its position as the largest segment in the Fruit Flavored Soft Drinks Market.
Fruit flavored Soft Drinks Market Segmentation
By Product
Fruit-flavored Carbonated Soft Drinks
Fruit-flavored Non-carbonated Soft Drinks
By Sales channel
Supermarkets/ Hypermarkets
Departmental Store
Online
By Flavor
Orange
Apple
Mixed
Pineapple
Grapefruit
Mango
Others
Countries Analyzed
North America (US, Canada, Mexico)
Europe (Germany, UK, France, Spain, Italy, Russia, Rest of Europe)
Asia Pacific (China, India, Japan, South Korea, Australia, South East Asia, Rest of Asia)
South America (Brazil, Argentina, Rest of South America)
Middle East and Africa (Saudi Arabia, UAE, Rest of Middle East, South Africa, Egypt, Rest of Africa)
Fruit flavored Soft Drinks Companies Profiled in the Study
AriZona Beverages USA LLC
Britvic Plc
Brooklyn Soda Works
Callaway Family Co.
Cool Mountain Beverages Inc
Dabur India Ltd
DRY Soda Co.
Hydro One Beverages
Jones Soda Co.
Keurig Dr Pepper Inc
Monster Energy Co.
Nestle SA
PepsiCo Inc
Red Bull GmbH
The coca cola co.
*- List Not Exhaustive
Chapter 1. TABLE OF CONTENTS
Chapter 2. Introduction to Fruit flavored Soft Drinks Market
2.1. Market Overview
2.2. Key Statistics and Report Highlights
2.3. Scope of the Comprehensive Study
2.3.1. Market Definition
2.3.2 Countries and Regions Covered
2.3.3 Research Objective
2.3.4 Units, Currency, and Conversions
2.3.5 Industry Value Chain
2.4. Key Market Segments
2.5. Key Companies
2.6. Study Period
Chapter 3. Strategic Analysis Review
3.1. Fruit flavored Soft Drinks Pricing Analysis and Forecast
3.2. Porter’s Five Forces
3.3. Market Ecosystem
3.4. SWOT Analysis
3.5. Regulatory Scenario
3.3. Effects of Inflation, Russia-Ukraine War, moderating economic growth, and other macroeconomic factors
Chapter 4. Competitive Landscape
4.1. Market Share Analysis
4.1.1. Global Fruit flavored Soft Drinks Market Share by Company, 2023
4.1.2. Product Offerings of Leading Fruit flavored Soft Drinks Companies
4.2. Market Entropy
4.2.1. New Product Launches in the Industry
4.2.2. Mergers, Acquisitions, Joint ventures, and Partnerships
4.3. Key Strategies and Best Practices
Chapter 5. Global Market Projections: Best, Reference, and Low Case Scenarios
5.1. Growth Analysis- Case Scenario Definitions
5.2. Low Growth Case Scenario Forecasts
5.3. Reference Growth Case Scenario Forecasts
5.4. High Growth Case Scenario Forecasts
Chapter 6. Market Dynamics
6.1. Fruit flavored Soft Drinks Market Drivers
6.2. Fruit flavored Soft Drinks Market Challenges
6.6. Fruit flavored Soft Drinks Market Opportunities
6.4. Fruit flavored Soft Drinks Market Trends
Chapter 7. Global Fruit flavored Soft Drinks Market Outlook Trends
7.1. Global Fruit flavored Soft Drinks Revenue (USD Million) and CAGR (%) by Type (2021-2032)
7.2. Global Fruit flavored Soft Drinks Revenue (USD Million) and CAGR (%) by Application (2021-2032)
7.3. Global Fruit flavored Soft Drinks Revenue (USD Million) and CAGR (%) by Product (2021-2032)
By Product
Fruit-flavored Carbonated Soft Drinks
Fruit-flavored Non-carbonated Soft Drinks
By Sales channel
Supermarkets/ Hypermarkets
Departmental Store
Online
By Flavor
Orange
Apple
Mixed
Pineapple
Grapefruit
Mango
Others
Chapter 8. Global Fruit flavored Soft Drinks Regional Analysis and Outlook
8.1. Global Fruit flavored Soft Drinks Revenue (USD Million) By Regions (2021- 2032)
8.2. North America Fruit flavored Soft Drinks Revenue (USD Million) by Country (2021-2032)
8.2.1. United States Fruit flavored Soft Drinks Regional Analysis and Outlook
8.2.2. Canada Fruit flavored Soft Drinks Regional Analysis and Outlook
8.2.3. Mexico Fruit flavored Soft Drinks Regional Analysis and Outlook
8.3. Europe Fruit flavored Soft Drinks Revenue (USD Million), by Country (2021-2032)
8.3.1. Germany Fruit flavored Soft Drinks Regional Analysis and Outlook
8.3.2. France Fruit flavored Soft Drinks Regional Analysis and Outlook
8.3.3. United Kingdom Fruit flavored Soft Drinks Regional Analysis and Outlook
8.3.4. Spain Fruit flavored Soft Drinks Regional Analysis and Outlook
8.3.5. Italy Fruit flavored Soft Drinks Regional Analysis and Outlook
8.3.6. Russia Fruit flavored Soft Drinks Regional Analysis and Outlook
8.3.7. Rest of Europe Fruit flavored Soft Drinks Regional Analysis and Outlook
8.4. Asia Pacific Fruit flavored Soft Drinks Revenue (USD Million) by Country (2021-2032)
8.4.1. China Fruit flavored Soft Drinks Regional Analysis and Outlook
8.4.2. Japan Fruit flavored Soft Drinks Regional Analysis and Outlook
8.4.3. India Fruit flavored Soft Drinks Regional Analysis and Outlook
8.4.4. South Korea Fruit flavored Soft Drinks Regional Analysis and Outlook
8.4.5. Australia Fruit flavored Soft Drinks Regional Analysis and Outlook
8.4.6. South East Asia Fruit flavored Soft Drinks Regional Analysis and Outlook
8.4.7. Rest of Asia Pacific Fruit flavored Soft Drinks Regional Analysis and Outlook
8.5. South America Fruit flavored Soft Drinks Revenue (USD Million), by Country (2021-2032)
8.5.1. Brazil Fruit flavored Soft Drinks Regional Analysis and Outlook
8.5.2. Argentina Fruit flavored Soft Drinks Regional Analysis and Outlook
8.5.3. Rest of South America Fruit flavored Soft Drinks Regional Analysis and Outlook
8.6. Middle East and Africa Fruit flavored Soft Drinks Revenue (USD Million) by Country (2021-2032)
8.6.1. Middle East Fruit flavored Soft Drinks Regional Analysis and Outlook
8.6.2. Africa Fruit flavored Soft Drinks Regional Analysis and Outlook
Chapter 9. North America Fruit flavored Soft Drinks Analysis and Outlook
9.1. North America Fruit flavored Soft Drinks Revenue (USD Million) by Segments (2021-2032)
9.1.1. North America Fruit flavored Soft Drinks Revenue (USD Million) by Type (2021-2032)
9.1.2. North America Fruit flavored Soft Drinks Revenue (USD Million) by Application (2021-2032)
9.1.3. North America Fruit flavored Soft Drinks Revenue (USD Million) by Product (2021-2032)
By Product
Fruit-flavored Carbonated Soft Drinks
Fruit-flavored Non-carbonated Soft Drinks
By Sales channel
Supermarkets/ Hypermarkets
Departmental Store
Online
By Flavor
Orange
Apple
Mixed
Pineapple
Grapefruit
Mango
Others
Chapter 10. Europe Fruit flavored Soft Drinks Analysis and Outlook
10.1. Europe Fruit flavored Soft Drinks Revenue (USD Million), by Segments (USD Million) (2021-2032)
10.1.1. Europe Fruit flavored Soft Drinks Revenue (USD Million) by Type (2021-2032)
10.1.2. Europe Fruit flavored Soft Drinks Revenue (USD Million) by Application (2021-2032)
10.1.3. Europe Fruit flavored Soft Drinks Revenue (USD Million) by Product (2021-2032)
By Product
Fruit-flavored Carbonated Soft Drinks
Fruit-flavored Non-carbonated Soft Drinks
By Sales channel
Supermarkets/ Hypermarkets
Departmental Store
Online
By Flavor
Orange
Apple
Mixed
Pineapple
Grapefruit
Mango
Others
Chapter 11. Asia Pacific Fruit flavored Soft Drinks Analysis and Outlook
11.1. Asia Pacific Fruit flavored Soft Drinks Revenue (USD Million), and Revenue (USD Million) by Segments (2021-2032)
11.1.1. Asia Pacific Fruit flavored Soft Drinks Revenue (USD Million) by Type (2021-2032)
11.1.2. Asia Pacific Fruit flavored Soft Drinks Revenue (USD Million) by Application (2021-2032)
11.1.3. Asia Pacific Fruit flavored Soft Drinks Revenue (USD Million) by Product (2021-2032)
By Product
Fruit-flavored Carbonated Soft Drinks
Fruit-flavored Non-carbonated Soft Drinks
By Sales channel
Supermarkets/ Hypermarkets
Departmental Store
Online
By Flavor
Orange
Apple
Mixed
Pineapple
Grapefruit
Mango
Others
Chapter 12. South America Fruit flavored Soft Drinks Analysis and Outlook
12.1. South America Fruit flavored Soft Drinks Revenue (USD Million), by Segments (2021-2032)
12.1.1. South America Fruit flavored Soft Drinks Revenue (USD Million) by Type (2021-2032)
12.1.2. South America Fruit flavored Soft Drinks Revenue (USD Million) by Application (2021-2032)
12.1.3. South America Fruit flavored Soft Drinks Revenue (USD Million) by Product (2021-2032)
By Product
Fruit-flavored Carbonated Soft Drinks
Fruit-flavored Non-carbonated Soft Drinks
By Sales channel
Supermarkets/ Hypermarkets
Departmental Store
Online
By Flavor
Orange
Apple
Mixed
Pineapple
Grapefruit
Mango
Others
Chapter 13. Middle East and Africa Fruit flavored Soft Drinks Analysis and Outlook
13.1. Middle East and Africa Fruit flavored Soft Drinks Revenue (USD Million), by Segments (2021-2032)
13.1.1. Middle East and Africa Fruit flavored Soft Drinks Revenue (USD Million) by Type (2021-2032)
13.1.2. Middle East and Africa Fruit flavored Soft Drinks Revenue (USD Million) by Application (2021-2032)
13.1.3. Middle East and Africa Fruit flavored Soft Drinks Revenue (USD Million) by Product (2021-2032)
By Product
Fruit-flavored Carbonated Soft Drinks
Fruit-flavored Non-carbonated Soft Drinks
By Sales channel
Supermarkets/ Hypermarkets
Departmental Store
Online
By Flavor
Orange
Apple
Mixed
Pineapple
Grapefruit
Mango
Others
Chapter 14. Fruit flavored Soft Drinks Company Profiles
14.1 Business Overview
14.2 Product Profiles
14.3 SWOT Profiles
14.5 Recent Developments
14.6 Financial Profile
List of Companies
AriZona Beverages USA LLC
Britvic Plc
Brooklyn Soda Works
Callaway Family Co.
Cool Mountain Beverages Inc
Dabur India Ltd
DRY Soda Co.
Hydro One Beverages
Jones Soda Co.
Keurig Dr Pepper Inc
Monster Energy Co.
Nestle SA
PepsiCo Inc
Red Bull GmbH
The coca cola co.
15. Methodology and Data Sources
15.1 Customization Offerings
15.2 Subscription Services
15.3 Related Reports
15.4 Publisher Expertise
LIST OF TABLES
Table 1 Market Segmentation Analysis
Table 2 Global Fruit flavored Soft Drinks Market Share of Leading Companies, 2023
Table 3 Product Offerings of Leading Companies
Table 4 Low Growth Scenario Forecasts
Table 5 Reference Case Growth Scenario
Table 6 High Growth Case Scenario
Table 7 Global Fruit flavored Soft Drinks Revenue (USD Million) And CAGR (%) By Type (2021-2032)
Table 8 Global Fruit flavored Soft Drinks Revenue (USD Million) And CAGR (%) By Application (2021-2032)
Table 9 Global Fruit flavored Soft Drinks Revenue (USD Million) And CAGR (%) By Product (2021-2032)
Table 10 Global Fruit flavored Soft Drinks Market Revenue (USD Million) By Regions (2021-2032)
Table 11 Global Fruit flavored Soft Drinks Market Share (%) By Regions (2021-2032)
Table 12 North America Fruit flavored Soft Drinks Revenue (USD Million) By Country (2021-2032)
Table 13 Europe Fruit flavored Soft Drinks Revenue (USD Million) By Country (2021-2032)
Table 14 Asia Pacific Fruit flavored Soft Drinks Revenue (USD Million) By Country (2021-2032)
Table 15 South America Fruit flavored Soft Drinks Revenue (USD Million) By Country (2021-2032)
Table 16 Middle East and Africa Fruit flavored Soft Drinks Revenue (USD Million) By Region (2021-2032)
Table 17 North America Fruit flavored Soft Drinks Revenue (USD Million) By Type (2021-2032)
Table 18 North America Fruit flavored Soft Drinks Revenue (USD Million) By Application (2021-2032)
Table 19 North America Fruit flavored Soft Drinks Revenue (USD Million) By Product (2021-2032)
Table 20 Europe Fruit flavored Soft Drinks Revenue (USD Million) By Type (2021-2032)
Table 21 Europe Fruit flavored Soft Drinks Revenue (USD Million) By Application (2021-2032)
Table 22 Europe Fruit flavored Soft Drinks Revenue (USD Million) By Product (2021-2032)
Table 23 Asia Pacific Fruit flavored Soft Drinks Revenue (USD Million) By Type (2021-2032)
Table 24 Asia Pacific Fruit flavored Soft Drinks Revenue (USD Million) By Application (2021-2032)
Table 25 Asia Pacific Fruit flavored Soft Drinks Revenue (USD Million) By Product (2021-2032)
Table 26 South America Fruit flavored Soft Drinks Revenue (USD Million) By Type (2021-2032)
Table 27 South America Fruit flavored Soft Drinks Revenue (USD Million) By Application (2021-2032)
Table 28 South America Fruit flavored Soft Drinks Revenue (USD Million) By Product (2021-2032)
Table 29 Middle East and Africa Fruit flavored Soft Drinks Revenue (USD Million) By Type (2021-2032)
Table 30 Middle East and Africa Fruit flavored Soft Drinks Revenue (USD Million) By Application (2021-2032)
Table 31 Middle East and Africa Fruit flavored Soft Drinks Revenue (USD Million) By Product (2021-2032)
LIST OF FIGURES
Figure 1. Market Scope
Figure 2. Pricing Forecasts Per Unit, 2023- 2032
Figure 3. Porter’s Five Forces
Figure 4. Global Fruit flavored Soft Drinks Market Revenue (USD Million) By Regions (2021-2032)
Figure 5. Global Fruit flavored Soft Drinks Market Share (%) By Regions (2023)
Figure 6. North America Fruit flavored Soft Drinks Revenue (USD Million) By Country (2021-2032)
Figure 7. United States Fruit flavored Soft Drinks Revenue (USD Million) By Country (2021-2032)
Figure 8. Canada Fruit flavored Soft Drinks Revenue (USD Million) By Country (2021-2032)
Figure 9. Mexico Fruit flavored Soft Drinks Revenue (USD Million) By Country (2021-2032)
Figure 10. Europe Fruit flavored Soft Drinks Revenue (USD Million) By Country (2021-2032)
Figure 11. Germany Fruit flavored Soft Drinks Revenue (USD Million) By Country (2021-2032)
Figure 12. France Fruit flavored Soft Drinks Revenue (USD Million) By Country (2021-2032)
Figure 13. United Kingdom Fruit flavored Soft Drinks Revenue (USD Million) By Country (2021-2032)
Figure 14. Spain Fruit flavored Soft Drinks Revenue (USD Million) By Country (2021-2032)
Figure 15. Italy Fruit flavored Soft Drinks Revenue (USD Million) By Country (2021-2032)
Figure 16. Russia Fruit flavored Soft Drinks Revenue (USD Million) By Country (2021-2032)
Figure 17. Rest of Europe Fruit flavored Soft Drinks Revenue (USD Million) By Country (2021-2032)
Figure 11. Asia Pacific Fruit flavored Soft Drinks Revenue (USD Million) By Country (2021-2032)
Figure 12. China Fruit flavored Soft Drinks Revenue (USD Million) By Country (2021-2032)
Figure 13. Japan Fruit flavored Soft Drinks Revenue (USD Million) By Country (2021-2032)
Figure 14. India Fruit flavored Soft Drinks Revenue (USD Million) By Country (2021-2032)
Figure 15. South Korea Fruit flavored Soft Drinks Revenue (USD Million) By Country (2021-2032)
Figure 16. Australia Fruit flavored Soft Drinks Revenue (USD Million) By Country (2021-2032)
Figure 17. South East Asia Fruit flavored Soft Drinks Revenue (USD Million) By Country (2021-2032)
Figure 18. South America Fruit flavored Soft Drinks Revenue (USD Million) By Country (2021-2032)
Figure 19. Brazil Fruit flavored Soft Drinks Revenue (USD Million) By Country (2021-2032)
Figure 20. Argentina Fruit flavored Soft Drinks Revenue (USD Million) By Country (2021-2032)
Figure 21. Rest of Asia Pacific Fruit flavored Soft Drinks Revenue (USD Million) By Country (2021-2032)
Figure 22. Middle East and Africa Fruit flavored Soft Drinks Revenue (USD Million) By Region (2021-2032)
Figure 23. Saudi Arabia Fruit flavored Soft Drinks Revenue (USD Million) By Region (2021-2032)
Figure 24. The UAE Fruit flavored Soft Drinks Revenue (USD Million) By Region (2021-2032)
Figure 25. Rest of Middle East Fruit flavored Soft Drinks Revenue (USD Million) By Region (2021-2032)
Figure 26. South Africa Fruit flavored Soft Drinks Revenue (USD Million) By Region (2021-2032)
Figure 27. Africa Fruit flavored Soft Drinks Revenue (USD Million) By Region (2021-2032)
Figure 28. North America Fruit flavored Soft Drinks Revenue (USD Million) By Type (2021-2032)
Figure 29. North America Fruit flavored Soft Drinks Revenue (USD Million) By Application (2021-2032)
Figure 30. North America Fruit flavored Soft Drinks Revenue (USD Million) By Product (2021-2032)
Figure 31. Europe Fruit flavored Soft Drinks Revenue (USD Million) By Type (2021-2032)
Figure 32. Europe Fruit flavored Soft Drinks Revenue (USD Million) By Application (2021-2032)
Figure 33. Europe Fruit flavored Soft Drinks Revenue (USD Million) By Product (2021-2032)
Figure 34. Asia Pacific Fruit flavored Soft Drinks Revenue (USD Million) By Type (2021-2032)
Figure 35. Asia Pacific Fruit flavored Soft Drinks Revenue (USD Million) By Application (2021-2032)
Figure 36. Asia Pacific Fruit flavored Soft Drinks Revenue (USD Million) By Product (2021-2032)
Figure 37. South America Fruit flavored Soft Drinks Revenue (USD Million) By Type (2021-2032)
Figure 38. South America Fruit flavored Soft Drinks Revenue (USD Million) By Application (2021-2032)
Figure 39. South America Fruit flavored Soft Drinks Revenue (USD Million) By Product (2021-2032)
Figure 40. Middle East and Africa Fruit flavored Soft Drinks Revenue (USD Million) By Type (2021-2032)
Figure 41. Middle East and Africa Fruit flavored Soft Drinks Revenue (USD Million) By Application (2021-2032)
Figure 42. Middle East and Africa Fruit flavored Soft Drinks Revenue (USD Million) By Product (2021-2032)
By Product
Fruit-flavored Carbonated Soft Drinks
Fruit-flavored Non-carbonated Soft Drinks
By Sales channel
Supermarkets/ Hypermarkets
Departmental Store
Online
By Flavor
Orange
Apple
Mixed
Pineapple
Grapefruit
Mango
Others
Countries Analyzed
North America (US, Canada, Mexico)
Europe (Germany, UK, France, Spain, Italy, Russia, Rest of Europe)
Asia Pacific (China, India, Japan, South Korea, Australia, South East Asia, Rest of Asia)
South America (Brazil, Argentina, Rest of South America)
Middle East and Africa (Saudi Arabia, UAE, Rest of Middle East, South Africa, Egypt, Rest of Africa)
