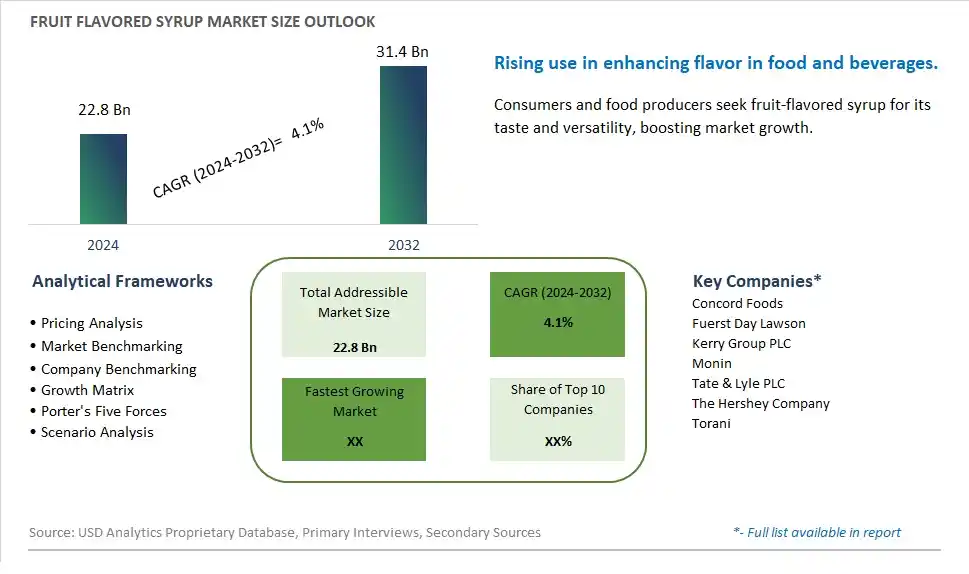
Global Fruit Flavored Syrup Market Size is valued at $22.8 Billion in 2024 and is forecast to register a growth rate (CAGR) of 4.1% to reach $31.4 Billion by 2032.
The global Fruit Flavored Syrup Market Comprehensive Study analyzes and forecasts the market size across 6 regions and 24 countries for diverse segments -By Type (Strawberry, Apple, Grape, Others), By Application (Beverages, Dairy & Frozen Dessert, Bakery and Confectionery, Others)
An Introduction to Fruit Flavored Syrup Market
In 2024, the Fruit Flavored Syrup market is experiencing significant growth, driven by the rising demand for versatile and flavorful sweeteners. Fruit-flavored syrups, used in beverages, desserts, and culinary applications, offer intense fruit flavors and convenience. The market benefits from advancements in flavor extraction and syrup formulation technologies, the growing trend of gourmet and artisanal foods, and the expansion of the global food and beverage sector. Additionally, the increasing focus on natural and high-quality ingredients is driving market growth.
Fruit Flavored Syrup Competitive Landscape
The market report analyses the leading companies in the industry including Concord Foods, Fuerst Day Lawson, Kerry Group PLC, Monin, Tate & Lyle PLC, The Hershey Company, Torani, and Others.
Fruit Flavored Syrup Market Dynamics
Fruit Flavored Syrup Market Trend: Increasing Demand for Natural and Authentic Flavors
The most prominent trend in the Fruit Flavored Syrup Market is the increasing demand for natural and authentic flavors. As consumers seek high-quality syrups that provide genuine fruit flavors, fruit-flavored syrups are gaining popularity for their versatility and premium taste. This trend is driven by the growing interest in clean-label products and the desire for natural ingredients in food and beverages.
Fruit Flavored Syrup Market Driver: Growth in Food and Beverage Industry
The key driver of the Fruit Flavored Syrup Market is the growth in the food and beverage industry. As more consumers incorporate flavored syrups into their recipes, drinks, and desserts, there is a higher demand for fruit-flavored syrups that enhance taste and offer convenience. This driver is supported by the trend towards innovative and flavorful food and beverage products, driving market growth for fruit-flavored syrups.
Fruit Flavored Syrup Market Opportunity: Development of Specialty and Gourmet Syrups
A significant opportunity in the Fruit Flavored Syrup Market lies in the development of specialty and gourmet syrups. By creating syrups with unique fruit combinations, organic ingredients, and functional additives, companies can attract health-conscious consumers and food enthusiasts. Offering premium syrups that cater to diverse tastes and dietary preferences can help expand market reach and increase consumer satisfaction, driving growth in the specialty syrup segment.
Fruit Flavored Syrup Market Share Analysis: Beverages is the fastest growing segment over the forecast period to 2032
The Beverages segment is the fastest-growing within the Fruit Flavored Syrup Market by application, projected to experience significant growth up to 2032. This growth is driven by the increasing consumer demand for flavored drinks and the versatility of fruit syrups in enhancing the taste of a wide range of beverages. Fruit flavored syrups are extensively used in cocktails, mocktails, sodas, flavored waters, and specialty coffees, catering to both at-home consumers and the food service industry. The rising popularity of artisanal and craft beverages has also fueled demand for high-quality, natural fruit syrups that can add unique flavors and appeal to discerning consumers. Additionally, the health and wellness trend is driving the market for syrups made with natural ingredients and no artificial additives, further boosting their application in beverages. The growing trend of ready-to-drink beverages and the proliferation of cafés and restaurants offering customized drinks continue to support the robust growth of the beverages segment in the fruit flavored syrup market.
Fruit Flavored Syrup Market Share Analysis: Strawberry segment generated the highest revenue share in the industry
Strawberry is the largest segment within the Fruit Flavored Syrup Market by type. The widespread popularity of strawberry flavor, known for its sweet and slightly tart profile, makes it a favorite among consumers of all ages. Strawberry syrup is extensively used in a variety of applications, including beverages, desserts, and bakery products, making it a versatile ingredient in both household and commercial kitchens. Its appeal is further enhanced by its association with freshness and natural sweetness, making it a preferred choice for flavoring everything from smoothies and milkshakes to cakes and ice creams. The vibrant color and universally loved taste of strawberry syrup ensure its prominent position in the market. The continuous demand from both retail consumers and the food service industry for strawberry-flavored products solidifies its status as the largest segment in the fruit flavored syrup market.
Fruit Flavored Syrup Market Segmentation
By Type
Strawberry
Apple
Grape
Others
By Application
Beverages
Dairy & Frozen Dessert
Bakery and Confectionery
Others
Countries Analyzed
North America (US, Canada, Mexico)
Europe (Germany, UK, France, Spain, Italy, Russia, Rest of Europe)
Asia Pacific (China, India, Japan, South Korea, Australia, South East Asia, Rest of Asia)
South America (Brazil, Argentina, Rest of South America)
Middle East and Africa (Saudi Arabia, UAE, Rest of Middle East, South Africa, Egypt, Rest of Africa)
Fruit Flavored Syrup Companies Profiled in the Study
Concord Foods
Fuerst Day Lawson
Kerry Group PLC
Monin
Tate & Lyle PLC
The Hershey Company
Torani
*- List Not Exhaustive
Chapter 1. TABLE OF CONTENTS
Chapter 2. Introduction to Fruit Flavored Syrup Market
2.1. Market Overview
2.2. Key Statistics and Report Highlights
2.3. Scope of the Comprehensive Study
2.3.1. Market Definition
2.3.2 Countries and Regions Covered
2.3.3 Research Objective
2.3.4 Units, Currency, and Conversions
2.3.5 Industry Value Chain
2.4. Key Market Segments
2.5. Key Companies
2.6. Study Period
Chapter 3. Strategic Analysis Review
3.1. Fruit Flavored Syrup Pricing Analysis and Forecast
3.2. Porter’s Five Forces
3.3. Market Ecosystem
3.4. SWOT Analysis
3.5. Regulatory Scenario
3.3. Effects of Inflation, Russia-Ukraine War, moderating economic growth, and other macroeconomic factors
Chapter 4. Competitive Landscape
4.1. Market Share Analysis
4.1.1. Global Fruit Flavored Syrup Market Share by Company, 2023
4.1.2. Product Offerings of Leading Fruit Flavored Syrup Companies
4.2. Market Entropy
4.2.1. New Product Launches in the Industry
4.2.2. Mergers, Acquisitions, Joint ventures, and Partnerships
4.3. Key Strategies and Best Practices
Chapter 5. Global Market Projections: Best, Reference, and Low Case Scenarios
5.1. Growth Analysis- Case Scenario Definitions
5.2. Low Growth Case Scenario Forecasts
5.3. Reference Growth Case Scenario Forecasts
5.4. High Growth Case Scenario Forecasts
Chapter 6. Market Dynamics
6.1. Fruit Flavored Syrup Market Drivers
6.2. Fruit Flavored Syrup Market Challenges
6.6. Fruit Flavored Syrup Market Opportunities
6.4. Fruit Flavored Syrup Market Trends
Chapter 7. Global Fruit Flavored Syrup Market Outlook Trends
7.1. Global Fruit Flavored Syrup Revenue (USD Million) and CAGR (%) by Type (2021-2032)
7.2. Global Fruit Flavored Syrup Revenue (USD Million) and CAGR (%) by Application (2021-2032)
7.3. Global Fruit Flavored Syrup Revenue (USD Million) and CAGR (%) by Product (2021-2032)
By Type
Strawberry
Apple
Grape
Others
By Application
Beverages
Dairy & Frozen Dessert
Bakery and Confectionery
Others
Chapter 8. Global Fruit Flavored Syrup Regional Analysis and Outlook
8.1. Global Fruit Flavored Syrup Revenue (USD Million) By Regions (2021- 2032)
8.2. North America Fruit Flavored Syrup Revenue (USD Million) by Country (2021-2032)
8.2.1. United States Fruit Flavored Syrup Regional Analysis and Outlook
8.2.2. Canada Fruit Flavored Syrup Regional Analysis and Outlook
8.2.3. Mexico Fruit Flavored Syrup Regional Analysis and Outlook
8.3. Europe Fruit Flavored Syrup Revenue (USD Million), by Country (2021-2032)
8.3.1. Germany Fruit Flavored Syrup Regional Analysis and Outlook
8.3.2. France Fruit Flavored Syrup Regional Analysis and Outlook
8.3.3. United Kingdom Fruit Flavored Syrup Regional Analysis and Outlook
8.3.4. Spain Fruit Flavored Syrup Regional Analysis and Outlook
8.3.5. Italy Fruit Flavored Syrup Regional Analysis and Outlook
8.3.6. Russia Fruit Flavored Syrup Regional Analysis and Outlook
8.3.7. Rest of Europe Fruit Flavored Syrup Regional Analysis and Outlook
8.4. Asia Pacific Fruit Flavored Syrup Revenue (USD Million) by Country (2021-2032)
8.4.1. China Fruit Flavored Syrup Regional Analysis and Outlook
8.4.2. Japan Fruit Flavored Syrup Regional Analysis and Outlook
8.4.3. India Fruit Flavored Syrup Regional Analysis and Outlook
8.4.4. South Korea Fruit Flavored Syrup Regional Analysis and Outlook
8.4.5. Australia Fruit Flavored Syrup Regional Analysis and Outlook
8.4.6. South East Asia Fruit Flavored Syrup Regional Analysis and Outlook
8.4.7. Rest of Asia Pacific Fruit Flavored Syrup Regional Analysis and Outlook
8.5. South America Fruit Flavored Syrup Revenue (USD Million), by Country (2021-2032)
8.5.1. Brazil Fruit Flavored Syrup Regional Analysis and Outlook
8.5.2. Argentina Fruit Flavored Syrup Regional Analysis and Outlook
8.5.3. Rest of South America Fruit Flavored Syrup Regional Analysis and Outlook
8.6. Middle East and Africa Fruit Flavored Syrup Revenue (USD Million) by Country (2021-2032)
8.6.1. Middle East Fruit Flavored Syrup Regional Analysis and Outlook
8.6.2. Africa Fruit Flavored Syrup Regional Analysis and Outlook
Chapter 9. North America Fruit Flavored Syrup Analysis and Outlook
9.1. North America Fruit Flavored Syrup Revenue (USD Million) by Segments (2021-2032)
9.1.1. North America Fruit Flavored Syrup Revenue (USD Million) by Type (2021-2032)
9.1.2. North America Fruit Flavored Syrup Revenue (USD Million) by Application (2021-2032)
9.1.3. North America Fruit Flavored Syrup Revenue (USD Million) by Product (2021-2032)
By Type
Strawberry
Apple
Grape
Others
By Application
Beverages
Dairy & Frozen Dessert
Bakery and Confectionery
Others
Chapter 10. Europe Fruit Flavored Syrup Analysis and Outlook
10.1. Europe Fruit Flavored Syrup Revenue (USD Million), by Segments (USD Million) (2021-2032)
10.1.1. Europe Fruit Flavored Syrup Revenue (USD Million) by Type (2021-2032)
10.1.2. Europe Fruit Flavored Syrup Revenue (USD Million) by Application (2021-2032)
10.1.3. Europe Fruit Flavored Syrup Revenue (USD Million) by Product (2021-2032)
By Type
Strawberry
Apple
Grape
Others
By Application
Beverages
Dairy & Frozen Dessert
Bakery and Confectionery
Others
Chapter 11. Asia Pacific Fruit Flavored Syrup Analysis and Outlook
11.1. Asia Pacific Fruit Flavored Syrup Revenue (USD Million), and Revenue (USD Million) by Segments (2021-2032)
11.1.1. Asia Pacific Fruit Flavored Syrup Revenue (USD Million) by Type (2021-2032)
11.1.2. Asia Pacific Fruit Flavored Syrup Revenue (USD Million) by Application (2021-2032)
11.1.3. Asia Pacific Fruit Flavored Syrup Revenue (USD Million) by Product (2021-2032)
By Type
Strawberry
Apple
Grape
Others
By Application
Beverages
Dairy & Frozen Dessert
Bakery and Confectionery
Others
Chapter 12. South America Fruit Flavored Syrup Analysis and Outlook
12.1. South America Fruit Flavored Syrup Revenue (USD Million), by Segments (2021-2032)
12.1.1. South America Fruit Flavored Syrup Revenue (USD Million) by Type (2021-2032)
12.1.2. South America Fruit Flavored Syrup Revenue (USD Million) by Application (2021-2032)
12.1.3. South America Fruit Flavored Syrup Revenue (USD Million) by Product (2021-2032)
By Type
Strawberry
Apple
Grape
Others
By Application
Beverages
Dairy & Frozen Dessert
Bakery and Confectionery
Others
Chapter 13. Middle East and Africa Fruit Flavored Syrup Analysis and Outlook
13.1. Middle East and Africa Fruit Flavored Syrup Revenue (USD Million), by Segments (2021-2032)
13.1.1. Middle East and Africa Fruit Flavored Syrup Revenue (USD Million) by Type (2021-2032)
13.1.2. Middle East and Africa Fruit Flavored Syrup Revenue (USD Million) by Application (2021-2032)
13.1.3. Middle East and Africa Fruit Flavored Syrup Revenue (USD Million) by Product (2021-2032)
By Type
Strawberry
Apple
Grape
Others
By Application
Beverages
Dairy & Frozen Dessert
Bakery and Confectionery
Others
Chapter 14. Fruit Flavored Syrup Company Profiles
14.1 Business Overview
14.2 Product Profiles
14.3 SWOT Profiles
14.5 Recent Developments
14.6 Financial Profile
List of Companies
Concord Foods
Fuerst Day Lawson
Kerry Group PLC
Monin
Tate & Lyle PLC
The Hershey Company
Torani
15. Methodology and Data Sources
15.1 Customization Offerings
15.2 Subscription Services
15.3 Related Reports
15.4 Publisher Expertise
LIST OF TABLES
Table 1 Market Segmentation Analysis
Table 2 Global Fruit Flavored Syrup Market Share of Leading Companies, 2023
Table 3 Product Offerings of Leading Companies
Table 4 Low Growth Scenario Forecasts
Table 5 Reference Case Growth Scenario
Table 6 High Growth Case Scenario
Table 7 Global Fruit Flavored Syrup Revenue (USD Million) And CAGR (%) By Type (2021-2032)
Table 8 Global Fruit Flavored Syrup Revenue (USD Million) And CAGR (%) By Application (2021-2032)
Table 9 Global Fruit Flavored Syrup Revenue (USD Million) And CAGR (%) By Product (2021-2032)
Table 10 Global Fruit Flavored Syrup Market Revenue (USD Million) By Regions (2021-2032)
Table 11 Global Fruit Flavored Syrup Market Share (%) By Regions (2021-2032)
Table 12 North America Fruit Flavored Syrup Revenue (USD Million) By Country (2021-2032)
Table 13 Europe Fruit Flavored Syrup Revenue (USD Million) By Country (2021-2032)
Table 14 Asia Pacific Fruit Flavored Syrup Revenue (USD Million) By Country (2021-2032)
Table 15 South America Fruit Flavored Syrup Revenue (USD Million) By Country (2021-2032)
Table 16 Middle East and Africa Fruit Flavored Syrup Revenue (USD Million) By Region (2021-2032)
Table 17 North America Fruit Flavored Syrup Revenue (USD Million) By Type (2021-2032)
Table 18 North America Fruit Flavored Syrup Revenue (USD Million) By Application (2021-2032)
Table 19 North America Fruit Flavored Syrup Revenue (USD Million) By Product (2021-2032)
Table 20 Europe Fruit Flavored Syrup Revenue (USD Million) By Type (2021-2032)
Table 21 Europe Fruit Flavored Syrup Revenue (USD Million) By Application (2021-2032)
Table 22 Europe Fruit Flavored Syrup Revenue (USD Million) By Product (2021-2032)
Table 23 Asia Pacific Fruit Flavored Syrup Revenue (USD Million) By Type (2021-2032)
Table 24 Asia Pacific Fruit Flavored Syrup Revenue (USD Million) By Application (2021-2032)
Table 25 Asia Pacific Fruit Flavored Syrup Revenue (USD Million) By Product (2021-2032)
Table 26 South America Fruit Flavored Syrup Revenue (USD Million) By Type (2021-2032)
Table 27 South America Fruit Flavored Syrup Revenue (USD Million) By Application (2021-2032)
Table 28 South America Fruit Flavored Syrup Revenue (USD Million) By Product (2021-2032)
Table 29 Middle East and Africa Fruit Flavored Syrup Revenue (USD Million) By Type (2021-2032)
Table 30 Middle East and Africa Fruit Flavored Syrup Revenue (USD Million) By Application (2021-2032)
Table 31 Middle East and Africa Fruit Flavored Syrup Revenue (USD Million) By Product (2021-2032)
LIST OF FIGURES
Figure 1. Market Scope
Figure 2. Pricing Forecasts Per Unit, 2023- 2032
Figure 3. Porter’s Five Forces
Figure 4. Global Fruit Flavored Syrup Market Revenue (USD Million) By Regions (2021-2032)
Figure 5. Global Fruit Flavored Syrup Market Share (%) By Regions (2023)
Figure 6. North America Fruit Flavored Syrup Revenue (USD Million) By Country (2021-2032)
Figure 7. United States Fruit Flavored Syrup Revenue (USD Million) By Country (2021-2032)
Figure 8. Canada Fruit Flavored Syrup Revenue (USD Million) By Country (2021-2032)
Figure 9. Mexico Fruit Flavored Syrup Revenue (USD Million) By Country (2021-2032)
Figure 10. Europe Fruit Flavored Syrup Revenue (USD Million) By Country (2021-2032)
Figure 11. Germany Fruit Flavored Syrup Revenue (USD Million) By Country (2021-2032)
Figure 12. France Fruit Flavored Syrup Revenue (USD Million) By Country (2021-2032)
Figure 13. United Kingdom Fruit Flavored Syrup Revenue (USD Million) By Country (2021-2032)
Figure 14. Spain Fruit Flavored Syrup Revenue (USD Million) By Country (2021-2032)
Figure 15. Italy Fruit Flavored Syrup Revenue (USD Million) By Country (2021-2032)
Figure 16. Russia Fruit Flavored Syrup Revenue (USD Million) By Country (2021-2032)
Figure 17. Rest of Europe Fruit Flavored Syrup Revenue (USD Million) By Country (2021-2032)
Figure 11. Asia Pacific Fruit Flavored Syrup Revenue (USD Million) By Country (2021-2032)
Figure 12. China Fruit Flavored Syrup Revenue (USD Million) By Country (2021-2032)
Figure 13. Japan Fruit Flavored Syrup Revenue (USD Million) By Country (2021-2032)
Figure 14. India Fruit Flavored Syrup Revenue (USD Million) By Country (2021-2032)
Figure 15. South Korea Fruit Flavored Syrup Revenue (USD Million) By Country (2021-2032)
Figure 16. Australia Fruit Flavored Syrup Revenue (USD Million) By Country (2021-2032)
Figure 17. South East Asia Fruit Flavored Syrup Revenue (USD Million) By Country (2021-2032)
Figure 18. South America Fruit Flavored Syrup Revenue (USD Million) By Country (2021-2032)
Figure 19. Brazil Fruit Flavored Syrup Revenue (USD Million) By Country (2021-2032)
Figure 20. Argentina Fruit Flavored Syrup Revenue (USD Million) By Country (2021-2032)
Figure 21. Rest of Asia Pacific Fruit Flavored Syrup Revenue (USD Million) By Country (2021-2032)
Figure 22. Middle East and Africa Fruit Flavored Syrup Revenue (USD Million) By Region (2021-2032)
Figure 23. Saudi Arabia Fruit Flavored Syrup Revenue (USD Million) By Region (2021-2032)
Figure 24. The UAE Fruit Flavored Syrup Revenue (USD Million) By Region (2021-2032)
Figure 25. Rest of Middle East Fruit Flavored Syrup Revenue (USD Million) By Region (2021-2032)
Figure 26. South Africa Fruit Flavored Syrup Revenue (USD Million) By Region (2021-2032)
Figure 27. Africa Fruit Flavored Syrup Revenue (USD Million) By Region (2021-2032)
Figure 28. North America Fruit Flavored Syrup Revenue (USD Million) By Type (2021-2032)
Figure 29. North America Fruit Flavored Syrup Revenue (USD Million) By Application (2021-2032)
Figure 30. North America Fruit Flavored Syrup Revenue (USD Million) By Product (2021-2032)
Figure 31. Europe Fruit Flavored Syrup Revenue (USD Million) By Type (2021-2032)
Figure 32. Europe Fruit Flavored Syrup Revenue (USD Million) By Application (2021-2032)
Figure 33. Europe Fruit Flavored Syrup Revenue (USD Million) By Product (2021-2032)
Figure 34. Asia Pacific Fruit Flavored Syrup Revenue (USD Million) By Type (2021-2032)
Figure 35. Asia Pacific Fruit Flavored Syrup Revenue (USD Million) By Application (2021-2032)
Figure 36. Asia Pacific Fruit Flavored Syrup Revenue (USD Million) By Product (2021-2032)
Figure 37. South America Fruit Flavored Syrup Revenue (USD Million) By Type (2021-2032)
Figure 38. South America Fruit Flavored Syrup Revenue (USD Million) By Application (2021-2032)
Figure 39. South America Fruit Flavored Syrup Revenue (USD Million) By Product (2021-2032)
Figure 40. Middle East and Africa Fruit Flavored Syrup Revenue (USD Million) By Type (2021-2032)
Figure 41. Middle East and Africa Fruit Flavored Syrup Revenue (USD Million) By Application (2021-2032)
Figure 42. Middle East and Africa Fruit Flavored Syrup Revenue (USD Million) By Product (2021-2032)
By Type
Strawberry
Apple
Grape
Others
By Application
Beverages
Dairy & Frozen Dessert
Bakery and Confectionery
Others
Countries Analyzed
North America (US, Canada, Mexico)
Europe (Germany, UK, France, Spain, Italy, Russia, Rest of Europe)
Asia Pacific (China, India, Japan, South Korea, Australia, South East Asia, Rest of Asia)
South America (Brazil, Argentina, Rest of South America)
Middle East and Africa (Saudi Arabia, UAE, Rest of Middle East, South Africa, Egypt, Rest of Africa)
