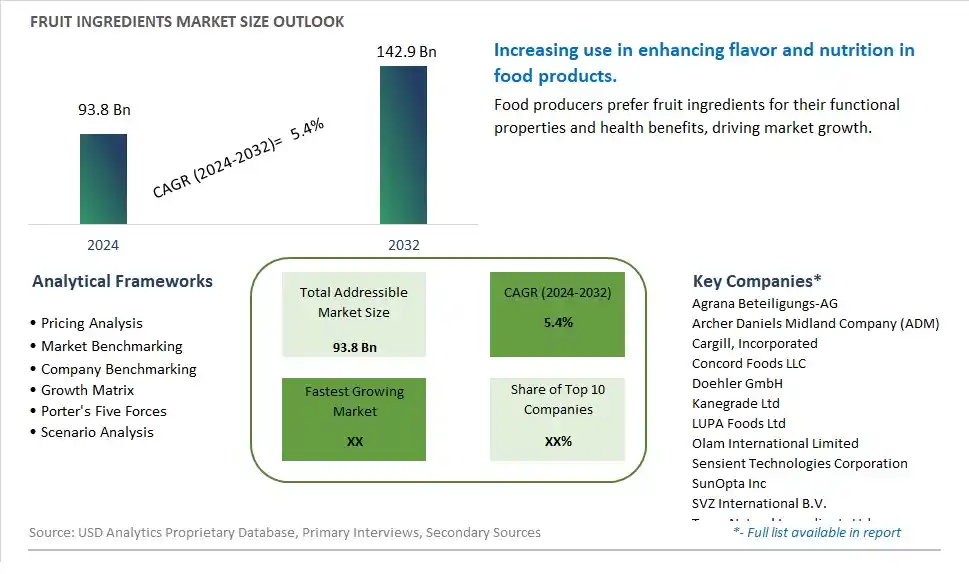
Global Fruit Ingredients Market Size is valued at $93.8 Billion in 2024 and is forecast to register a growth rate (CAGR) of 5.4% to reach $142.9 Billion by 2032.
The global Fruit Ingredients Market Comprehensive Study analyzes and forecasts the market size across 6 regions and 24 countries for diverse segments -By Type (Apple & Pears, Red Fruits & Berries, Citrus Fruits, Stone Fruits & Grapes, Tropical Fruits), By Application (Beverages, Confectionery Products, Bakery Products, Dairy Products, Desserts, Main Meal, Others)
An Introduction to Fruit Ingredients Market
The Fruit Ingredients market in 2024 is thriving, fueled by the rising demand for natural and nutritious food components. Fruit ingredients, including purees, extracts, and powders, are used in various applications such as beverages, dairy products, and snacks. The market benefits from advancements in fruit processing and preservation technologies, the growing trend of clean label and functional foods, and the expansion of the global food industry. Additionally, the increasing awareness of the health benefits of fruit-based ingredients is contributing to market growth.
Fruit Ingredients Competitive Landscape
The market report analyses the leading companies in the industry including Agrana Beteiligungs-AG, Archer Daniels Midland Company (ADM), Cargill, Incorporated, Concord Foods LLC, Doehler GmbH, Kanegrade Ltd, LUPA Foods Ltd, Olam International Limited, Sensient Technologies Corporation, SunOpta Inc, SVZ International B.V., Taura Natural Ingredients Ltd, Yaax International Ltd, and Others.
Fruit Ingredients Market Dynamics
Fruit Ingredients Market Trend: Increasing Use of Natural Ingredients in Food and Beverage Production
The most prominent trend in the Fruit Ingredients Market is the increasing use of natural ingredients in food and beverage production. As consumers seek healthier and more natural food products, fruit ingredients are gaining popularity for their nutritional benefits and natural flavors. This trend is driven by the growing demand for clean-label products that offer health benefits without synthetic additives.
Fruit Ingredients Market Driver: Growth in Health and Wellness Products
The key driver of the Fruit Ingredients Market is the growth in health and wellness products. As more consumers focus on maintaining a healthy lifestyle, there is a higher demand for products that incorporate natural fruit ingredients to enhance nutritional value and flavor. This driver is supported by the trend towards functional foods and beverages that provide specific health benefits, driving market growth for fruit ingredients.
Fruit Ingredients Market Opportunity: Innovation in Fruit Ingredient Applications
A significant opportunity in the Fruit Ingredients Market lies in innovation in fruit ingredient applications. By exploring new ways to incorporate fruit ingredients into various food and beverage products, such as snacks, supplements, and ready-to-eat meals, companies can enhance product quality and functionality. Offering innovative fruit ingredient solutions that cater to specific health needs and dietary preferences can help expand market reach and drive growth in the food and beverage sector.
Fruit Ingredients Market Share Analysis: Beverages is the fastest growing segment over the forecast period to 2032
The Beverages segment is the fastest-growing within the Fruit Ingredients Market by application, projected to experience significant growth up to 2032. This growth is driven by the increasing consumer demand for natural and health-enhancing beverage options. Fruit ingredients are widely used in a variety of beverages, including fruit juices, smoothies, flavored waters, energy drinks, and alcoholic beverages, providing natural flavors, nutrients, and appealing colors. The trend towards clean-label products, where consumers seek beverages with natural and recognizable ingredients, is significantly boosting the use of fruit ingredients. Additionally, the rise in health-conscious consumers and the popularity of functional beverages that offer added health benefits, such as vitamins, antioxidants, and probiotics, are contributing to the expansion of this segment. Innovations in beverage formulations and the introduction of new and exotic fruit flavors further drive consumer interest and market growth. As the beverage industry continues to innovate and cater to evolving consumer preferences, the demand for high-quality fruit ingredients is expected to soar, making the beverages segment the fastest-growing application in the fruit ingredients market.
Fruit Ingredients Market Share Analysis: Red Fruits & Berries segment generated the highest revenue share in the industry
Red Fruits & Berries is the largest segment within the Fruit Ingredients Market by type. This segment's dominance is due to the high demand for berries and red fruits, such as strawberries, raspberries, blueberries, and cherries, which are popular for their rich flavor, vibrant color, and high nutritional value. Red fruits and berries are packed with antioxidants, vitamins, and minerals, making them highly desirable for health-conscious consumers. They are widely used in various food and beverage applications, including smoothies, yogurts, baked goods, and desserts, adding both taste and health benefits. The versatility of red fruits and berries in culinary applications and their strong association with health and wellness trends ensure their sustained popularity. Further, the increasing availability of frozen and dried red fruits and berries extends their use throughout the year, further supporting their dominant market position. The combination of flavor, nutritional value, and versatility solidifies red fruits and berries as the largest segment in the fruit ingredients market.
Fruit Ingredients Market Segmentation
By Type
Apple & Pears
Red Fruits & Berries
Citrus Fruits
Stone Fruits & Grapes
Tropical Fruits
By Application
Beverages
Confectionery Products
Bakery Products
Dairy Products
Desserts
Main Meal
Others
Countries Analyzed
North America (US, Canada, Mexico)
Europe (Germany, UK, France, Spain, Italy, Russia, Rest of Europe)
Asia Pacific (China, India, Japan, South Korea, Australia, South East Asia, Rest of Asia)
South America (Brazil, Argentina, Rest of South America)
Middle East and Africa (Saudi Arabia, UAE, Rest of Middle East, South Africa, Egypt, Rest of Africa)
Fruit Ingredients Companies Profiled in the Study
Agrana Beteiligungs-AG
Archer Daniels Midland Company (ADM)
Cargill, Incorporated
Concord Foods LLC
Doehler GmbH
Kanegrade Ltd
LUPA Foods Ltd
Olam International Limited
Sensient Technologies Corporation
SunOpta Inc
SVZ International B.V.
Taura Natural Ingredients Ltd
Yaax International Ltd
*- List Not Exhaustive
Chapter 1. TABLE OF CONTENTS
Chapter 2. Introduction to Fruit Ingredients Market
2.1. Market Overview
2.2. Key Statistics and Report Highlights
2.3. Scope of the Comprehensive Study
2.3.1. Market Definition
2.3.2 Countries and Regions Covered
2.3.3 Research Objective
2.3.4 Units, Currency, and Conversions
2.3.5 Industry Value Chain
2.4. Key Market Segments
2.5. Key Companies
2.6. Study Period
Chapter 3. Strategic Analysis Review
3.1. Fruit Ingredients Pricing Analysis and Forecast
3.2. Porter’s Five Forces
3.3. Market Ecosystem
3.4. SWOT Analysis
3.5. Regulatory Scenario
3.3. Effects of Inflation, Russia-Ukraine War, moderating economic growth, and other macroeconomic factors
Chapter 4. Competitive Landscape
4.1. Market Share Analysis
4.1.1. Global Fruit Ingredients Market Share by Company, 2023
4.1.2. Product Offerings of Leading Fruit Ingredients Companies
4.2. Market Entropy
4.2.1. New Product Launches in the Industry
4.2.2. Mergers, Acquisitions, Joint ventures, and Partnerships
4.3. Key Strategies and Best Practices
Chapter 5. Global Market Projections: Best, Reference, and Low Case Scenarios
5.1. Growth Analysis- Case Scenario Definitions
5.2. Low Growth Case Scenario Forecasts
5.3. Reference Growth Case Scenario Forecasts
5.4. High Growth Case Scenario Forecasts
Chapter 6. Market Dynamics
6.1. Fruit Ingredients Market Drivers
6.2. Fruit Ingredients Market Challenges
6.6. Fruit Ingredients Market Opportunities
6.4. Fruit Ingredients Market Trends
Chapter 7. Global Fruit Ingredients Market Outlook Trends
7.1. Global Fruit Ingredients Revenue (USD Million) and CAGR (%) by Type (2021-2032)
7.2. Global Fruit Ingredients Revenue (USD Million) and CAGR (%) by Application (2021-2032)
7.3. Global Fruit Ingredients Revenue (USD Million) and CAGR (%) by Product (2021-2032)
By Type
Apple & Pears
Red Fruits & Berries
Citrus Fruits
Stone Fruits & Grapes
Tropical Fruits
By Application
Beverages
Confectionery Products
Bakery Products
Dairy Products
Desserts
Main Meal
Others
Chapter 8. Global Fruit Ingredients Regional Analysis and Outlook
8.1. Global Fruit Ingredients Revenue (USD Million) By Regions (2021- 2032)
8.2. North America Fruit Ingredients Revenue (USD Million) by Country (2021-2032)
8.2.1. United States Fruit Ingredients Regional Analysis and Outlook
8.2.2. Canada Fruit Ingredients Regional Analysis and Outlook
8.2.3. Mexico Fruit Ingredients Regional Analysis and Outlook
8.3. Europe Fruit Ingredients Revenue (USD Million), by Country (2021-2032)
8.3.1. Germany Fruit Ingredients Regional Analysis and Outlook
8.3.2. France Fruit Ingredients Regional Analysis and Outlook
8.3.3. United Kingdom Fruit Ingredients Regional Analysis and Outlook
8.3.4. Spain Fruit Ingredients Regional Analysis and Outlook
8.3.5. Italy Fruit Ingredients Regional Analysis and Outlook
8.3.6. Russia Fruit Ingredients Regional Analysis and Outlook
8.3.7. Rest of Europe Fruit Ingredients Regional Analysis and Outlook
8.4. Asia Pacific Fruit Ingredients Revenue (USD Million) by Country (2021-2032)
8.4.1. China Fruit Ingredients Regional Analysis and Outlook
8.4.2. Japan Fruit Ingredients Regional Analysis and Outlook
8.4.3. India Fruit Ingredients Regional Analysis and Outlook
8.4.4. South Korea Fruit Ingredients Regional Analysis and Outlook
8.4.5. Australia Fruit Ingredients Regional Analysis and Outlook
8.4.6. South East Asia Fruit Ingredients Regional Analysis and Outlook
8.4.7. Rest of Asia Pacific Fruit Ingredients Regional Analysis and Outlook
8.5. South America Fruit Ingredients Revenue (USD Million), by Country (2021-2032)
8.5.1. Brazil Fruit Ingredients Regional Analysis and Outlook
8.5.2. Argentina Fruit Ingredients Regional Analysis and Outlook
8.5.3. Rest of South America Fruit Ingredients Regional Analysis and Outlook
8.6. Middle East and Africa Fruit Ingredients Revenue (USD Million) by Country (2021-2032)
8.6.1. Middle East Fruit Ingredients Regional Analysis and Outlook
8.6.2. Africa Fruit Ingredients Regional Analysis and Outlook
Chapter 9. North America Fruit Ingredients Analysis and Outlook
9.1. North America Fruit Ingredients Revenue (USD Million) by Segments (2021-2032)
9.1.1. North America Fruit Ingredients Revenue (USD Million) by Type (2021-2032)
9.1.2. North America Fruit Ingredients Revenue (USD Million) by Application (2021-2032)
9.1.3. North America Fruit Ingredients Revenue (USD Million) by Product (2021-2032)
By Type
Apple & Pears
Red Fruits & Berries
Citrus Fruits
Stone Fruits & Grapes
Tropical Fruits
By Application
Beverages
Confectionery Products
Bakery Products
Dairy Products
Desserts
Main Meal
Others
Chapter 10. Europe Fruit Ingredients Analysis and Outlook
10.1. Europe Fruit Ingredients Revenue (USD Million), by Segments (USD Million) (2021-2032)
10.1.1. Europe Fruit Ingredients Revenue (USD Million) by Type (2021-2032)
10.1.2. Europe Fruit Ingredients Revenue (USD Million) by Application (2021-2032)
10.1.3. Europe Fruit Ingredients Revenue (USD Million) by Product (2021-2032)
By Type
Apple & Pears
Red Fruits & Berries
Citrus Fruits
Stone Fruits & Grapes
Tropical Fruits
By Application
Beverages
Confectionery Products
Bakery Products
Dairy Products
Desserts
Main Meal
Others
Chapter 11. Asia Pacific Fruit Ingredients Analysis and Outlook
11.1. Asia Pacific Fruit Ingredients Revenue (USD Million), and Revenue (USD Million) by Segments (2021-2032)
11.1.1. Asia Pacific Fruit Ingredients Revenue (USD Million) by Type (2021-2032)
11.1.2. Asia Pacific Fruit Ingredients Revenue (USD Million) by Application (2021-2032)
11.1.3. Asia Pacific Fruit Ingredients Revenue (USD Million) by Product (2021-2032)
By Type
Apple & Pears
Red Fruits & Berries
Citrus Fruits
Stone Fruits & Grapes
Tropical Fruits
By Application
Beverages
Confectionery Products
Bakery Products
Dairy Products
Desserts
Main Meal
Others
Chapter 12. South America Fruit Ingredients Analysis and Outlook
12.1. South America Fruit Ingredients Revenue (USD Million), by Segments (2021-2032)
12.1.1. South America Fruit Ingredients Revenue (USD Million) by Type (2021-2032)
12.1.2. South America Fruit Ingredients Revenue (USD Million) by Application (2021-2032)
12.1.3. South America Fruit Ingredients Revenue (USD Million) by Product (2021-2032)
By Type
Apple & Pears
Red Fruits & Berries
Citrus Fruits
Stone Fruits & Grapes
Tropical Fruits
By Application
Beverages
Confectionery Products
Bakery Products
Dairy Products
Desserts
Main Meal
Others
Chapter 13. Middle East and Africa Fruit Ingredients Analysis and Outlook
13.1. Middle East and Africa Fruit Ingredients Revenue (USD Million), by Segments (2021-2032)
13.1.1. Middle East and Africa Fruit Ingredients Revenue (USD Million) by Type (2021-2032)
13.1.2. Middle East and Africa Fruit Ingredients Revenue (USD Million) by Application (2021-2032)
13.1.3. Middle East and Africa Fruit Ingredients Revenue (USD Million) by Product (2021-2032)
By Type
Apple & Pears
Red Fruits & Berries
Citrus Fruits
Stone Fruits & Grapes
Tropical Fruits
By Application
Beverages
Confectionery Products
Bakery Products
Dairy Products
Desserts
Main Meal
Others
Chapter 14. Fruit Ingredients Company Profiles
14.1 Business Overview
14.2 Product Profiles
14.3 SWOT Profiles
14.5 Recent Developments
14.6 Financial Profile
List of Companies
Agrana Beteiligungs-AG
Archer Daniels Midland Company (ADM)
Cargill, Incorporated
Concord Foods LLC
Doehler GmbH
Kanegrade Ltd
LUPA Foods Ltd
Olam International Limited
Sensient Technologies Corporation
SunOpta Inc
SVZ International B.V.
Taura Natural Ingredients Ltd
Yaax International Ltd
15. Methodology and Data Sources
15.1 Customization Offerings
15.2 Subscription Services
15.3 Related Reports
15.4 Publisher Expertise
LIST OF TABLES
Table 1 Market Segmentation Analysis
Table 2 Global Fruit Ingredients Market Share of Leading Companies, 2023
Table 3 Product Offerings of Leading Companies
Table 4 Low Growth Scenario Forecasts
Table 5 Reference Case Growth Scenario
Table 6 High Growth Case Scenario
Table 7 Global Fruit Ingredients Revenue (USD Million) And CAGR (%) By Type (2021-2032)
Table 8 Global Fruit Ingredients Revenue (USD Million) And CAGR (%) By Application (2021-2032)
Table 9 Global Fruit Ingredients Revenue (USD Million) And CAGR (%) By Product (2021-2032)
Table 10 Global Fruit Ingredients Market Revenue (USD Million) By Regions (2021-2032)
Table 11 Global Fruit Ingredients Market Share (%) By Regions (2021-2032)
Table 12 North America Fruit Ingredients Revenue (USD Million) By Country (2021-2032)
Table 13 Europe Fruit Ingredients Revenue (USD Million) By Country (2021-2032)
Table 14 Asia Pacific Fruit Ingredients Revenue (USD Million) By Country (2021-2032)
Table 15 South America Fruit Ingredients Revenue (USD Million) By Country (2021-2032)
Table 16 Middle East and Africa Fruit Ingredients Revenue (USD Million) By Region (2021-2032)
Table 17 North America Fruit Ingredients Revenue (USD Million) By Type (2021-2032)
Table 18 North America Fruit Ingredients Revenue (USD Million) By Application (2021-2032)
Table 19 North America Fruit Ingredients Revenue (USD Million) By Product (2021-2032)
Table 20 Europe Fruit Ingredients Revenue (USD Million) By Type (2021-2032)
Table 21 Europe Fruit Ingredients Revenue (USD Million) By Application (2021-2032)
Table 22 Europe Fruit Ingredients Revenue (USD Million) By Product (2021-2032)
Table 23 Asia Pacific Fruit Ingredients Revenue (USD Million) By Type (2021-2032)
Table 24 Asia Pacific Fruit Ingredients Revenue (USD Million) By Application (2021-2032)
Table 25 Asia Pacific Fruit Ingredients Revenue (USD Million) By Product (2021-2032)
Table 26 South America Fruit Ingredients Revenue (USD Million) By Type (2021-2032)
Table 27 South America Fruit Ingredients Revenue (USD Million) By Application (2021-2032)
Table 28 South America Fruit Ingredients Revenue (USD Million) By Product (2021-2032)
Table 29 Middle East and Africa Fruit Ingredients Revenue (USD Million) By Type (2021-2032)
Table 30 Middle East and Africa Fruit Ingredients Revenue (USD Million) By Application (2021-2032)
Table 31 Middle East and Africa Fruit Ingredients Revenue (USD Million) By Product (2021-2032)
LIST OF FIGURES
Figure 1. Market Scope
Figure 2. Pricing Forecasts Per Unit, 2023- 2032
Figure 3. Porter’s Five Forces
Figure 4. Global Fruit Ingredients Market Revenue (USD Million) By Regions (2021-2032)
Figure 5. Global Fruit Ingredients Market Share (%) By Regions (2023)
Figure 6. North America Fruit Ingredients Revenue (USD Million) By Country (2021-2032)
Figure 7. United States Fruit Ingredients Revenue (USD Million) By Country (2021-2032)
Figure 8. Canada Fruit Ingredients Revenue (USD Million) By Country (2021-2032)
Figure 9. Mexico Fruit Ingredients Revenue (USD Million) By Country (2021-2032)
Figure 10. Europe Fruit Ingredients Revenue (USD Million) By Country (2021-2032)
Figure 11. Germany Fruit Ingredients Revenue (USD Million) By Country (2021-2032)
Figure 12. France Fruit Ingredients Revenue (USD Million) By Country (2021-2032)
Figure 13. United Kingdom Fruit Ingredients Revenue (USD Million) By Country (2021-2032)
Figure 14. Spain Fruit Ingredients Revenue (USD Million) By Country (2021-2032)
Figure 15. Italy Fruit Ingredients Revenue (USD Million) By Country (2021-2032)
Figure 16. Russia Fruit Ingredients Revenue (USD Million) By Country (2021-2032)
Figure 17. Rest of Europe Fruit Ingredients Revenue (USD Million) By Country (2021-2032)
Figure 11. Asia Pacific Fruit Ingredients Revenue (USD Million) By Country (2021-2032)
Figure 12. China Fruit Ingredients Revenue (USD Million) By Country (2021-2032)
Figure 13. Japan Fruit Ingredients Revenue (USD Million) By Country (2021-2032)
Figure 14. India Fruit Ingredients Revenue (USD Million) By Country (2021-2032)
Figure 15. South Korea Fruit Ingredients Revenue (USD Million) By Country (2021-2032)
Figure 16. Australia Fruit Ingredients Revenue (USD Million) By Country (2021-2032)
Figure 17. South East Asia Fruit Ingredients Revenue (USD Million) By Country (2021-2032)
Figure 18. South America Fruit Ingredients Revenue (USD Million) By Country (2021-2032)
Figure 19. Brazil Fruit Ingredients Revenue (USD Million) By Country (2021-2032)
Figure 20. Argentina Fruit Ingredients Revenue (USD Million) By Country (2021-2032)
Figure 21. Rest of Asia Pacific Fruit Ingredients Revenue (USD Million) By Country (2021-2032)
Figure 22. Middle East and Africa Fruit Ingredients Revenue (USD Million) By Region (2021-2032)
Figure 23. Saudi Arabia Fruit Ingredients Revenue (USD Million) By Region (2021-2032)
Figure 24. The UAE Fruit Ingredients Revenue (USD Million) By Region (2021-2032)
Figure 25. Rest of Middle East Fruit Ingredients Revenue (USD Million) By Region (2021-2032)
Figure 26. South Africa Fruit Ingredients Revenue (USD Million) By Region (2021-2032)
Figure 27. Africa Fruit Ingredients Revenue (USD Million) By Region (2021-2032)
Figure 28. North America Fruit Ingredients Revenue (USD Million) By Type (2021-2032)
Figure 29. North America Fruit Ingredients Revenue (USD Million) By Application (2021-2032)
Figure 30. North America Fruit Ingredients Revenue (USD Million) By Product (2021-2032)
Figure 31. Europe Fruit Ingredients Revenue (USD Million) By Type (2021-2032)
Figure 32. Europe Fruit Ingredients Revenue (USD Million) By Application (2021-2032)
Figure 33. Europe Fruit Ingredients Revenue (USD Million) By Product (2021-2032)
Figure 34. Asia Pacific Fruit Ingredients Revenue (USD Million) By Type (2021-2032)
Figure 35. Asia Pacific Fruit Ingredients Revenue (USD Million) By Application (2021-2032)
Figure 36. Asia Pacific Fruit Ingredients Revenue (USD Million) By Product (2021-2032)
Figure 37. South America Fruit Ingredients Revenue (USD Million) By Type (2021-2032)
Figure 38. South America Fruit Ingredients Revenue (USD Million) By Application (2021-2032)
Figure 39. South America Fruit Ingredients Revenue (USD Million) By Product (2021-2032)
Figure 40. Middle East and Africa Fruit Ingredients Revenue (USD Million) By Type (2021-2032)
Figure 41. Middle East and Africa Fruit Ingredients Revenue (USD Million) By Application (2021-2032)
Figure 42. Middle East and Africa Fruit Ingredients Revenue (USD Million) By Product (2021-2032)
By Type
Apple & Pears
Red Fruits & Berries
Citrus Fruits
Stone Fruits & Grapes
Tropical Fruits
By Application
Beverages
Confectionery Products
Bakery Products
Dairy Products
Desserts
Main Meal
Others
Countries Analyzed
North America (US, Canada, Mexico)
Europe (Germany, UK, France, Spain, Italy, Russia, Rest of Europe)
Asia Pacific (China, India, Japan, South Korea, Australia, South East Asia, Rest of Asia)
South America (Brazil, Argentina, Rest of South America)
Middle East and Africa (Saudi Arabia, UAE, Rest of Middle East, South Africa, Egypt, Rest of Africa)
