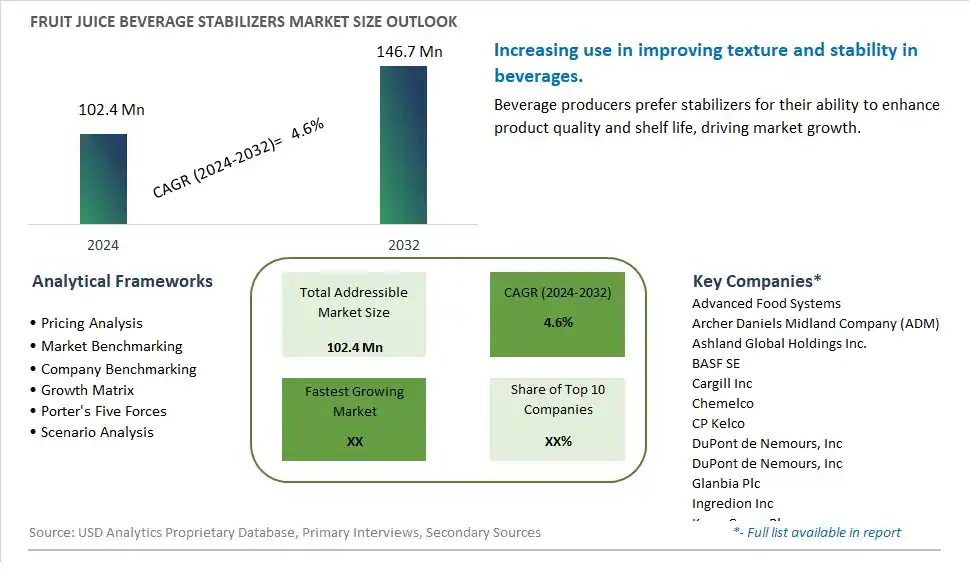
Global Fruit Juice Beverage Stabilizers Market Size is valued at $102.4 Million in 2024 and is forecast to register a growth rate (CAGR) of 4.6% to reach $146.7 Million by 2032.
The global Fruit Juice Beverage Stabilizers Market Comprehensive Study analyzes and forecasts the market size across 6 regions and 24 countries for diverse segments -By Type (Xanthan gum, Carrageenan, Gum Arabic, Carboxymethyl cellulose (CMC), Others), By Application (Clear Juice, Cloudy Juice)
An Introduction to Fruit Juice Beverage Stabilizers Market
In 2024, the Fruit Juice Beverage Stabilizers market is experiencing significant growth, driven by the rising demand for high-quality and stable fruit juice products. Beverage stabilizers, used to maintain consistency, texture, and shelf life, are essential in the fruit juice industry. The market benefits from advancements in stabilizer formulation and application technologies, the growing trend of natural and functional beverages, and the expansion of the global beverage sector. Additionally, the increasing focus on clean label and natural stabilizers is driving market growth.
Fruit Juice Beverage Stabilizers Competitive Landscape
The market report analyses the leading companies in the industry including Advanced Food Systems, Archer Daniels Midland Company (ADM), Ashland Global Holdings Inc., BASF SE, Cargill Inc, Chemelco, CP Kelco, DuPont de Nemours, Inc, DuPont de Nemours, Inc, Glanbia Plc, Ingredion Inc, Kerry Group Plc, Palsgaard A/S, Tate & Lyle Plc, W.R. Grace, and Others.
Fruit Juice Beverage Stabilizers Market Dynamics
Fruit Juice Beverage Stabilizers Market Trend: Increasing Demand for Natural and Functional Beverage Ingredients
The most prominent trend in the Fruit Juice Beverage Stabilizers Market is the increasing demand for natural and functional beverage ingredients. As consumers seek healthier and more natural beverages, stabilizers that enhance the quality and stability of fruit juice drinks are gaining popularity. This trend is driven by the growing demand for clean-label products and the desire for beverages that offer health benefits without synthetic additives.
Fruit Juice Beverage Stabilizers Market Driver: Growth in Functional Beverage Consumption
The key driver of the Fruit Juice Beverage Stabilizers Market is the growth in functional beverage consumption. As more consumers focus on improving their health through their beverage choices, there is a higher demand for fruit juice beverages that provide specific health benefits. This driver is supported by the trend towards functional drinks that offer added nutrients, vitamins, and antioxidants, driving market growth for beverage stabilizers.
Fruit Juice Beverage Stabilizers Market Opportunity: Innovation in Stabilizer Formulations and Applications
A significant opportunity in the Fruit Juice Beverage Stabilizers Market lies in innovation in stabilizer formulations and applications. By developing new stabilizer blends that cater to specific beverage needs, such as enhanced mouthfeel, improved shelf life, or added health benefits, companies can attract a broader audience. Offering innovative stabilizer solutions that enhance the quality and functionality of fruit juice beverages can help expand market reach and drive growth in the beverage industry.
Fruit Juice Beverage Stabilizers Market Share Analysis: Cloudy Juice is the fastest growing segment over the forecast period to 2032
The Cloudy Juice segment is the fastest-growing within the Fruit Juice Beverage Stabilizers Market by application, projected to experience significant growth up to 2032. This growth is driven by the increasing consumer preference for natural, minimally processed juices that retain their pulp and fiber content, giving them a cloudy appearance. Cloudy juices are perceived as more wholesome and nutritious compared to clear juices, as they often contain more vitamins, minerals, and antioxidants. The demand for functional beverages and clean-label products is also contributing to the growth of this segment, as consumers seek out beverages that offer health benefits and transparency in ingredients. Stabilizers play a crucial role in maintaining the consistency, texture, and shelf life of cloudy juices by preventing the separation of pulp from the liquid. Innovations in stabilizer formulations that cater to the clean-label trend, such as natural and organic stabilizers, are further boosting the demand in this segment. As the trend towards health-conscious and natural beverages continues to rise, the cloudy juice segment is expected to maintain its rapid growth, solidifying its position as the fastest-growing application in the fruit juice beverage stabilizers market.
Fruit Juice Beverage Stabilizers Market Share Analysis: Xanthan Gum segment generated the highest revenue share in the industry
Xanthan Gum is the largest segment within the Fruit Juice Beverage Stabilizers Market by type. This segment's prominence is due to the versatile and effective stabilizing properties of xanthan gum, making it a preferred choice for beverage manufacturers. Xanthan gum is widely used to enhance the texture and viscosity of fruit juice beverages, ensuring a smooth and consistent product. It effectively prevents the separation of ingredients, maintaining the desired consistency and prolonging shelf life. The compatibility of xanthan gum with a wide range of juice formulations, including both clear and cloudy juices, further contributes to its extensive use in the industry. Additionally, xanthan gum is favored for its ability to perform well under varying temperature and pH conditions, which is crucial for maintaining the quality of fruit juices during processing and storage. Its acceptance as a safe and natural ingredient also aligns with the growing consumer demand for clean-label products. The combination of functionality, versatility, and consumer acceptance ensures that xanthan gum remains the largest segment in the fruit juice beverage stabilizers market.
Fruit Juice Beverage Stabilizers Market Segmentation
By Type
Xanthan gum
Carrageenan
Gum Arabic
Carboxymethyl cellulose (CMC)
Others
By Application
Clear Juice
Cloudy Juice
Countries Analyzed
North America (US, Canada, Mexico)
Europe (Germany, UK, France, Spain, Italy, Russia, Rest of Europe)
Asia Pacific (China, India, Japan, South Korea, Australia, South East Asia, Rest of Asia)
South America (Brazil, Argentina, Rest of South America)
Middle East and Africa (Saudi Arabia, UAE, Rest of Middle East, South Africa, Egypt, Rest of Africa)
Fruit Juice Beverage Stabilizers Companies Profiled in the Study
Advanced Food Systems
Archer Daniels Midland Company (ADM)
Ashland Global Holdings Inc.
BASF SE
Cargill Inc
Chemelco
CP Kelco
DuPont de Nemours, Inc
DuPont de Nemours, Inc
Glanbia Plc
Ingredion Inc
Kerry Group Plc
Palsgaard A/S
Tate & Lyle Plc
W.R. Grace
*- List Not Exhaustive
Chapter 1. TABLE OF CONTENTS
Chapter 2. Introduction to Fruit Juice Beverage Stabilizers Market
2.1. Market Overview
2.2. Key Statistics and Report Highlights
2.3. Scope of the Comprehensive Study
2.3.1. Market Definition
2.3.2 Countries and Regions Covered
2.3.3 Research Objective
2.3.4 Units, Currency, and Conversions
2.3.5 Industry Value Chain
2.4. Key Market Segments
2.5. Key Companies
2.6. Study Period
Chapter 3. Strategic Analysis Review
3.1. Fruit Juice Beverage Stabilizers Pricing Analysis and Forecast
3.2. Porter’s Five Forces
3.3. Market Ecosystem
3.4. SWOT Analysis
3.5. Regulatory Scenario
3.3. Effects of Inflation, Russia-Ukraine War, moderating economic growth, and other macroeconomic factors
Chapter 4. Competitive Landscape
4.1. Market Share Analysis
4.1.1. Global Fruit Juice Beverage Stabilizers Market Share by Company, 2023
4.1.2. Product Offerings of Leading Fruit Juice Beverage Stabilizers Companies
4.2. Market Entropy
4.2.1. New Product Launches in the Industry
4.2.2. Mergers, Acquisitions, Joint ventures, and Partnerships
4.3. Key Strategies and Best Practices
Chapter 5. Global Market Projections: Best, Reference, and Low Case Scenarios
5.1. Growth Analysis- Case Scenario Definitions
5.2. Low Growth Case Scenario Forecasts
5.3. Reference Growth Case Scenario Forecasts
5.4. High Growth Case Scenario Forecasts
Chapter 6. Market Dynamics
6.1. Fruit Juice Beverage Stabilizers Market Drivers
6.2. Fruit Juice Beverage Stabilizers Market Challenges
6.6. Fruit Juice Beverage Stabilizers Market Opportunities
6.4. Fruit Juice Beverage Stabilizers Market Trends
Chapter 7. Global Fruit Juice Beverage Stabilizers Market Outlook Trends
7.1. Global Fruit Juice Beverage Stabilizers Revenue (USD Million) and CAGR (%) by Type (2021-2032)
7.2. Global Fruit Juice Beverage Stabilizers Revenue (USD Million) and CAGR (%) by Application (2021-2032)
7.3. Global Fruit Juice Beverage Stabilizers Revenue (USD Million) and CAGR (%) by Product (2021-2032)
By Type
Xanthan gum
Carrageenan
Gum Arabic
Carboxymethyl cellulose (CMC)
Others
By Application
Clear Juice
Cloudy Juice
Chapter 8. Global Fruit Juice Beverage Stabilizers Regional Analysis and Outlook
8.1. Global Fruit Juice Beverage Stabilizers Revenue (USD Million) By Regions (2021- 2032)
8.2. North America Fruit Juice Beverage Stabilizers Revenue (USD Million) by Country (2021-2032)
8.2.1. United States Fruit Juice Beverage Stabilizers Regional Analysis and Outlook
8.2.2. Canada Fruit Juice Beverage Stabilizers Regional Analysis and Outlook
8.2.3. Mexico Fruit Juice Beverage Stabilizers Regional Analysis and Outlook
8.3. Europe Fruit Juice Beverage Stabilizers Revenue (USD Million), by Country (2021-2032)
8.3.1. Germany Fruit Juice Beverage Stabilizers Regional Analysis and Outlook
8.3.2. France Fruit Juice Beverage Stabilizers Regional Analysis and Outlook
8.3.3. United Kingdom Fruit Juice Beverage Stabilizers Regional Analysis and Outlook
8.3.4. Spain Fruit Juice Beverage Stabilizers Regional Analysis and Outlook
8.3.5. Italy Fruit Juice Beverage Stabilizers Regional Analysis and Outlook
8.3.6. Russia Fruit Juice Beverage Stabilizers Regional Analysis and Outlook
8.3.7. Rest of Europe Fruit Juice Beverage Stabilizers Regional Analysis and Outlook
8.4. Asia Pacific Fruit Juice Beverage Stabilizers Revenue (USD Million) by Country (2021-2032)
8.4.1. China Fruit Juice Beverage Stabilizers Regional Analysis and Outlook
8.4.2. Japan Fruit Juice Beverage Stabilizers Regional Analysis and Outlook
8.4.3. India Fruit Juice Beverage Stabilizers Regional Analysis and Outlook
8.4.4. South Korea Fruit Juice Beverage Stabilizers Regional Analysis and Outlook
8.4.5. Australia Fruit Juice Beverage Stabilizers Regional Analysis and Outlook
8.4.6. South East Asia Fruit Juice Beverage Stabilizers Regional Analysis and Outlook
8.4.7. Rest of Asia Pacific Fruit Juice Beverage Stabilizers Regional Analysis and Outlook
8.5. South America Fruit Juice Beverage Stabilizers Revenue (USD Million), by Country (2021-2032)
8.5.1. Brazil Fruit Juice Beverage Stabilizers Regional Analysis and Outlook
8.5.2. Argentina Fruit Juice Beverage Stabilizers Regional Analysis and Outlook
8.5.3. Rest of South America Fruit Juice Beverage Stabilizers Regional Analysis and Outlook
8.6. Middle East and Africa Fruit Juice Beverage Stabilizers Revenue (USD Million) by Country (2021-2032)
8.6.1. Middle East Fruit Juice Beverage Stabilizers Regional Analysis and Outlook
8.6.2. Africa Fruit Juice Beverage Stabilizers Regional Analysis and Outlook
Chapter 9. North America Fruit Juice Beverage Stabilizers Analysis and Outlook
9.1. North America Fruit Juice Beverage Stabilizers Revenue (USD Million) by Segments (2021-2032)
9.1.1. North America Fruit Juice Beverage Stabilizers Revenue (USD Million) by Type (2021-2032)
9.1.2. North America Fruit Juice Beverage Stabilizers Revenue (USD Million) by Application (2021-2032)
9.1.3. North America Fruit Juice Beverage Stabilizers Revenue (USD Million) by Product (2021-2032)
By Type
Xanthan gum
Carrageenan
Gum Arabic
Carboxymethyl cellulose (CMC)
Others
By Application
Clear Juice
Cloudy Juice
Chapter 10. Europe Fruit Juice Beverage Stabilizers Analysis and Outlook
10.1. Europe Fruit Juice Beverage Stabilizers Revenue (USD Million), by Segments (USD Million) (2021-2032)
10.1.1. Europe Fruit Juice Beverage Stabilizers Revenue (USD Million) by Type (2021-2032)
10.1.2. Europe Fruit Juice Beverage Stabilizers Revenue (USD Million) by Application (2021-2032)
10.1.3. Europe Fruit Juice Beverage Stabilizers Revenue (USD Million) by Product (2021-2032)
By Type
Xanthan gum
Carrageenan
Gum Arabic
Carboxymethyl cellulose (CMC)
Others
By Application
Clear Juice
Cloudy Juice
Chapter 11. Asia Pacific Fruit Juice Beverage Stabilizers Analysis and Outlook
11.1. Asia Pacific Fruit Juice Beverage Stabilizers Revenue (USD Million), and Revenue (USD Million) by Segments (2021-2032)
11.1.1. Asia Pacific Fruit Juice Beverage Stabilizers Revenue (USD Million) by Type (2021-2032)
11.1.2. Asia Pacific Fruit Juice Beverage Stabilizers Revenue (USD Million) by Application (2021-2032)
11.1.3. Asia Pacific Fruit Juice Beverage Stabilizers Revenue (USD Million) by Product (2021-2032)
By Type
Xanthan gum
Carrageenan
Gum Arabic
Carboxymethyl cellulose (CMC)
Others
By Application
Clear Juice
Cloudy Juice
Chapter 12. South America Fruit Juice Beverage Stabilizers Analysis and Outlook
12.1. South America Fruit Juice Beverage Stabilizers Revenue (USD Million), by Segments (2021-2032)
12.1.1. South America Fruit Juice Beverage Stabilizers Revenue (USD Million) by Type (2021-2032)
12.1.2. South America Fruit Juice Beverage Stabilizers Revenue (USD Million) by Application (2021-2032)
12.1.3. South America Fruit Juice Beverage Stabilizers Revenue (USD Million) by Product (2021-2032)
By Type
Xanthan gum
Carrageenan
Gum Arabic
Carboxymethyl cellulose (CMC)
Others
By Application
Clear Juice
Cloudy Juice
Chapter 13. Middle East and Africa Fruit Juice Beverage Stabilizers Analysis and Outlook
13.1. Middle East and Africa Fruit Juice Beverage Stabilizers Revenue (USD Million), by Segments (2021-2032)
13.1.1. Middle East and Africa Fruit Juice Beverage Stabilizers Revenue (USD Million) by Type (2021-2032)
13.1.2. Middle East and Africa Fruit Juice Beverage Stabilizers Revenue (USD Million) by Application (2021-2032)
13.1.3. Middle East and Africa Fruit Juice Beverage Stabilizers Revenue (USD Million) by Product (2021-2032)
By Type
Xanthan gum
Carrageenan
Gum Arabic
Carboxymethyl cellulose (CMC)
Others
By Application
Clear Juice
Cloudy Juice
Chapter 14. Fruit Juice Beverage Stabilizers Company Profiles
14.1 Business Overview
14.2 Product Profiles
14.3 SWOT Profiles
14.5 Recent Developments
14.6 Financial Profile
List of Companies
Advanced Food Systems
Archer Daniels Midland Company (ADM)
Ashland Global Holdings Inc.
BASF SE
Cargill Inc
Chemelco
CP Kelco
DuPont de Nemours, Inc
DuPont de Nemours, Inc
Glanbia Plc
Ingredion Inc
Kerry Group Plc
Palsgaard A/S
Tate & Lyle Plc
W.R. Grace
15. Methodology and Data Sources
15.1 Customization Offerings
15.2 Subscription Services
15.3 Related Reports
15.4 Publisher Expertise
LIST OF TABLES
Table 1 Market Segmentation Analysis
Table 2 Global Fruit Juice Beverage Stabilizers Market Share of Leading Companies, 2023
Table 3 Product Offerings of Leading Companies
Table 4 Low Growth Scenario Forecasts
Table 5 Reference Case Growth Scenario
Table 6 High Growth Case Scenario
Table 7 Global Fruit Juice Beverage Stabilizers Revenue (USD Million) And CAGR (%) By Type (2021-2032)
Table 8 Global Fruit Juice Beverage Stabilizers Revenue (USD Million) And CAGR (%) By Application (2021-2032)
Table 9 Global Fruit Juice Beverage Stabilizers Revenue (USD Million) And CAGR (%) By Product (2021-2032)
Table 10 Global Fruit Juice Beverage Stabilizers Market Revenue (USD Million) By Regions (2021-2032)
Table 11 Global Fruit Juice Beverage Stabilizers Market Share (%) By Regions (2021-2032)
Table 12 North America Fruit Juice Beverage Stabilizers Revenue (USD Million) By Country (2021-2032)
Table 13 Europe Fruit Juice Beverage Stabilizers Revenue (USD Million) By Country (2021-2032)
Table 14 Asia Pacific Fruit Juice Beverage Stabilizers Revenue (USD Million) By Country (2021-2032)
Table 15 South America Fruit Juice Beverage Stabilizers Revenue (USD Million) By Country (2021-2032)
Table 16 Middle East and Africa Fruit Juice Beverage Stabilizers Revenue (USD Million) By Region (2021-2032)
Table 17 North America Fruit Juice Beverage Stabilizers Revenue (USD Million) By Type (2021-2032)
Table 18 North America Fruit Juice Beverage Stabilizers Revenue (USD Million) By Application (2021-2032)
Table 19 North America Fruit Juice Beverage Stabilizers Revenue (USD Million) By Product (2021-2032)
Table 20 Europe Fruit Juice Beverage Stabilizers Revenue (USD Million) By Type (2021-2032)
Table 21 Europe Fruit Juice Beverage Stabilizers Revenue (USD Million) By Application (2021-2032)
Table 22 Europe Fruit Juice Beverage Stabilizers Revenue (USD Million) By Product (2021-2032)
Table 23 Asia Pacific Fruit Juice Beverage Stabilizers Revenue (USD Million) By Type (2021-2032)
Table 24 Asia Pacific Fruit Juice Beverage Stabilizers Revenue (USD Million) By Application (2021-2032)
Table 25 Asia Pacific Fruit Juice Beverage Stabilizers Revenue (USD Million) By Product (2021-2032)
Table 26 South America Fruit Juice Beverage Stabilizers Revenue (USD Million) By Type (2021-2032)
Table 27 South America Fruit Juice Beverage Stabilizers Revenue (USD Million) By Application (2021-2032)
Table 28 South America Fruit Juice Beverage Stabilizers Revenue (USD Million) By Product (2021-2032)
Table 29 Middle East and Africa Fruit Juice Beverage Stabilizers Revenue (USD Million) By Type (2021-2032)
Table 30 Middle East and Africa Fruit Juice Beverage Stabilizers Revenue (USD Million) By Application (2021-2032)
Table 31 Middle East and Africa Fruit Juice Beverage Stabilizers Revenue (USD Million) By Product (2021-2032)
LIST OF FIGURES
Figure 1. Market Scope
Figure 2. Pricing Forecasts Per Unit, 2023- 2032
Figure 3. Porter’s Five Forces
Figure 4. Global Fruit Juice Beverage Stabilizers Market Revenue (USD Million) By Regions (2021-2032)
Figure 5. Global Fruit Juice Beverage Stabilizers Market Share (%) By Regions (2023)
Figure 6. North America Fruit Juice Beverage Stabilizers Revenue (USD Million) By Country (2021-2032)
Figure 7. United States Fruit Juice Beverage Stabilizers Revenue (USD Million) By Country (2021-2032)
Figure 8. Canada Fruit Juice Beverage Stabilizers Revenue (USD Million) By Country (2021-2032)
Figure 9. Mexico Fruit Juice Beverage Stabilizers Revenue (USD Million) By Country (2021-2032)
Figure 10. Europe Fruit Juice Beverage Stabilizers Revenue (USD Million) By Country (2021-2032)
Figure 11. Germany Fruit Juice Beverage Stabilizers Revenue (USD Million) By Country (2021-2032)
Figure 12. France Fruit Juice Beverage Stabilizers Revenue (USD Million) By Country (2021-2032)
Figure 13. United Kingdom Fruit Juice Beverage Stabilizers Revenue (USD Million) By Country (2021-2032)
Figure 14. Spain Fruit Juice Beverage Stabilizers Revenue (USD Million) By Country (2021-2032)
Figure 15. Italy Fruit Juice Beverage Stabilizers Revenue (USD Million) By Country (2021-2032)
Figure 16. Russia Fruit Juice Beverage Stabilizers Revenue (USD Million) By Country (2021-2032)
Figure 17. Rest of Europe Fruit Juice Beverage Stabilizers Revenue (USD Million) By Country (2021-2032)
Figure 11. Asia Pacific Fruit Juice Beverage Stabilizers Revenue (USD Million) By Country (2021-2032)
Figure 12. China Fruit Juice Beverage Stabilizers Revenue (USD Million) By Country (2021-2032)
Figure 13. Japan Fruit Juice Beverage Stabilizers Revenue (USD Million) By Country (2021-2032)
Figure 14. India Fruit Juice Beverage Stabilizers Revenue (USD Million) By Country (2021-2032)
Figure 15. South Korea Fruit Juice Beverage Stabilizers Revenue (USD Million) By Country (2021-2032)
Figure 16. Australia Fruit Juice Beverage Stabilizers Revenue (USD Million) By Country (2021-2032)
Figure 17. South East Asia Fruit Juice Beverage Stabilizers Revenue (USD Million) By Country (2021-2032)
Figure 18. South America Fruit Juice Beverage Stabilizers Revenue (USD Million) By Country (2021-2032)
Figure 19. Brazil Fruit Juice Beverage Stabilizers Revenue (USD Million) By Country (2021-2032)
Figure 20. Argentina Fruit Juice Beverage Stabilizers Revenue (USD Million) By Country (2021-2032)
Figure 21. Rest of Asia Pacific Fruit Juice Beverage Stabilizers Revenue (USD Million) By Country (2021-2032)
Figure 22. Middle East and Africa Fruit Juice Beverage Stabilizers Revenue (USD Million) By Region (2021-2032)
Figure 23. Saudi Arabia Fruit Juice Beverage Stabilizers Revenue (USD Million) By Region (2021-2032)
Figure 24. The UAE Fruit Juice Beverage Stabilizers Revenue (USD Million) By Region (2021-2032)
Figure 25. Rest of Middle East Fruit Juice Beverage Stabilizers Revenue (USD Million) By Region (2021-2032)
Figure 26. South Africa Fruit Juice Beverage Stabilizers Revenue (USD Million) By Region (2021-2032)
Figure 27. Africa Fruit Juice Beverage Stabilizers Revenue (USD Million) By Region (2021-2032)
Figure 28. North America Fruit Juice Beverage Stabilizers Revenue (USD Million) By Type (2021-2032)
Figure 29. North America Fruit Juice Beverage Stabilizers Revenue (USD Million) By Application (2021-2032)
Figure 30. North America Fruit Juice Beverage Stabilizers Revenue (USD Million) By Product (2021-2032)
Figure 31. Europe Fruit Juice Beverage Stabilizers Revenue (USD Million) By Type (2021-2032)
Figure 32. Europe Fruit Juice Beverage Stabilizers Revenue (USD Million) By Application (2021-2032)
Figure 33. Europe Fruit Juice Beverage Stabilizers Revenue (USD Million) By Product (2021-2032)
Figure 34. Asia Pacific Fruit Juice Beverage Stabilizers Revenue (USD Million) By Type (2021-2032)
Figure 35. Asia Pacific Fruit Juice Beverage Stabilizers Revenue (USD Million) By Application (2021-2032)
Figure 36. Asia Pacific Fruit Juice Beverage Stabilizers Revenue (USD Million) By Product (2021-2032)
Figure 37. South America Fruit Juice Beverage Stabilizers Revenue (USD Million) By Type (2021-2032)
Figure 38. South America Fruit Juice Beverage Stabilizers Revenue (USD Million) By Application (2021-2032)
Figure 39. South America Fruit Juice Beverage Stabilizers Revenue (USD Million) By Product (2021-2032)
Figure 40. Middle East and Africa Fruit Juice Beverage Stabilizers Revenue (USD Million) By Type (2021-2032)
Figure 41. Middle East and Africa Fruit Juice Beverage Stabilizers Revenue (USD Million) By Application (2021-2032)
Figure 42. Middle East and Africa Fruit Juice Beverage Stabilizers Revenue (USD Million) By Product (2021-2032)
By Type
Xanthan gum
Carrageenan
Gum Arabic
Carboxymethyl cellulose (CMC)
Others
By Application
Clear Juice
Cloudy Juice
Countries Analyzed
North America (US, Canada, Mexico)
Europe (Germany, UK, France, Spain, Italy, Russia, Rest of Europe)
Asia Pacific (China, India, Japan, South Korea, Australia, South East Asia, Rest of Asia)
South America (Brazil, Argentina, Rest of South America)
Middle East and Africa (Saudi Arabia, UAE, Rest of Middle East, South Africa, Egypt, Rest of Africa)
