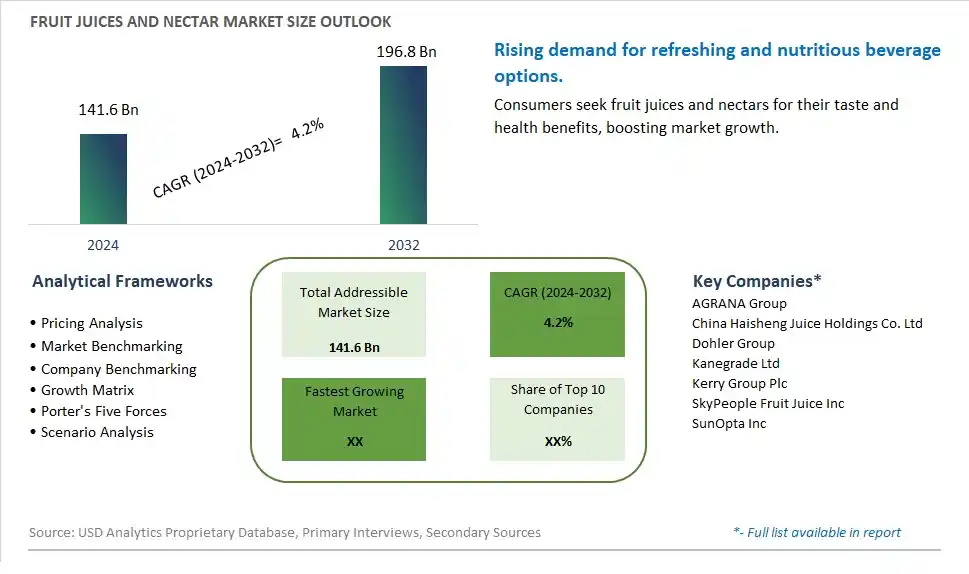
Global Fruit Juices and Nectar Market Size is valued at $141.6 Billion in 2024 and is forecast to register a growth rate (CAGR) of 4.2% to reach $196.8 Billion by 2032.
The global Fruit Juices and Nectar Market Comprehensive Study analyzes and forecasts the market size across 6 regions and 24 countries for diverse segments -By Type (Apple, Orange, Grapes, Pineapple, Pear, Others), By Application (Beverages, Dairy and Food, Bakery, Confectionary, Others)
An Introduction to Fruit Juices and Nectar Market
The Fruit Juices and Nectar market in 2024 is thriving, fueled by the rising demand for natural and nutritious beverages. Fruit juices and nectars, made from a variety of fruits, are popular for their refreshing taste and health benefits. The market benefits from advancements in juice extraction and preservation technologies, the growing trend of health-conscious consumption, and the expansion of the global beverage sector. Additionally, the increasing focus on clean label and minimally processed juices is contributing to market growth.
Fruit Juices and Nectar Competitive Landscape
The market report analyses the leading companies in the industry including AGRANA Group, China Haisheng Juice Holdings Co. Ltd, Dohler Group, Kanegrade Ltd, Kerry Group Plc, SkyPeople Fruit Juice Inc, SunOpta Inc, and Others.
Fruit Juices and Nectar Market Dynamics
Fruit Juices and Nectar Market Trend: Rising Popularity of Natural and Functional Beverages
The most prominent trend in the Fruit Juices and Nectar Market is the rising popularity of natural and functional beverages. As consumers seek healthier drink options that offer nutritional benefits, fruit juices and nectars made from natural ingredients are gaining traction. This trend is driven by the growing interest in clean-label products and the desire for beverages that provide hydration, nutrition, and overall wellness benefits.
Fruit Juices and Nectar Market Driver: Growth in Health and Wellness Consciousness
The key driver of the Fruit Juices and Nectar Market is the growth in health and wellness consciousness among consumers. As more people focus on boosting their immune systems and incorporating nutrient-rich foods into their diets, the demand for fruit juices and nectars, known for their vitamins and antioxidants, continues to rise. This driver is supported by the trend towards using natural ingredients in beverages and the desire for healthier drink options, driving market growth.
Fruit Juices and Nectar Market Opportunity: Innovation in Flavors and Packaging
A significant opportunity in the Fruit Juices and Nectar Market lies in innovation in flavors and packaging. By developing new and unique fruit juice and nectar blends, incorporating functional ingredients such as vitamins and minerals, and offering convenient packaging solutions, companies can attract a broader audience. Highlighting the health benefits and natural ingredients of these beverages can help drive consumer interest and market growth.
Fruit Juices and Nectar Market Share Analysis: Beverages is the fastest growing segment over the forecast period to 2032
The Beverages segment is the fastest-growing within the Fruit Juices and Nectar Market by application, projected to experience significant growth up to 2032. This rapid growth is driven by the increasing consumer demand for natural and healthy beverage options. Fruit juices and nectars are highly favored for their rich nutrient content and refreshing taste, making them a popular choice among health-conscious consumers. The rise of functional beverages, which include added vitamins, minerals, and other health-enhancing ingredients, is also fueling the demand for fruit juices and nectars. Additionally, the trend towards clean-label products, which prioritize natural ingredients and transparency, is boosting the popularity of these beverages. Innovations in packaging and product formulations, such as organic and no-sugar-added options, further cater to the evolving preferences of consumers. The convenience of ready-to-drink fruit juices and nectars available in various retail channels, including supermarkets, hypermarkets, and online platforms, ensures broad accessibility. As consumers continue to prioritize health and wellness in their dietary choices, the beverages segment is expected to maintain its rapid expansion, solidifying its position as the fastest-growing application in the fruit juices and nectar market.
Fruit Juices and Nectar Market Share Analysis: Orange segment generated the highest revenue share in the industry
Orange is the largest segment within the Fruit Juices and Nectar Market by type. This segment's dominance is attributed to the widespread popularity and high demand for orange juice, which is a staple in many households worldwide. Orange juice is renowned for its refreshing taste and high vitamin C content, which appeals to health-conscious consumers seeking to boost their immune system and overall health. The versatility of orange juice, whether consumed on its own or used as an ingredient in various recipes, further enhances its market appeal. Additionally, the consistent year-round availability of oranges and advancements in juicing technology have ensured a steady supply of high-quality orange juice. The extensive distribution network, including supermarkets, convenience stores, and online platforms, makes orange juice readily accessible to a broad consumer base. The combination of nutritional benefits, taste appeal, and widespread availability ensures that orange remains the largest segment in the fruit juices and nectar market.
Fruit Juices and Nectar Market Segmentation
By Type
Apple
Orange
Grapes
Pineapple
Pear
Others
By Application
Beverages
Dairy and Food
Bakery
Confectionary
Others
Countries Analyzed
North America (US, Canada, Mexico)
Europe (Germany, UK, France, Spain, Italy, Russia, Rest of Europe)
Asia Pacific (China, India, Japan, South Korea, Australia, South East Asia, Rest of Asia)
South America (Brazil, Argentina, Rest of South America)
Middle East and Africa (Saudi Arabia, UAE, Rest of Middle East, South Africa, Egypt, Rest of Africa)
Fruit Juices and Nectar Companies Profiled in the Study
AGRANA Group
China Haisheng Juice Holdings Co. Ltd
Dohler Group
Kanegrade Ltd
Kerry Group Plc
SkyPeople Fruit Juice Inc
SunOpta Inc
*- List Not Exhaustive
Chapter 1. TABLE OF CONTENTS
Chapter 2. Introduction to Fruit Juices and Nectar Market
2.1. Market Overview
2.2. Key Statistics and Report Highlights
2.3. Scope of the Comprehensive Study
2.3.1. Market Definition
2.3.2 Countries and Regions Covered
2.3.3 Research Objective
2.3.4 Units, Currency, and Conversions
2.3.5 Industry Value Chain
2.4. Key Market Segments
2.5. Key Companies
2.6. Study Period
Chapter 3. Strategic Analysis Review
3.1. Fruit Juices and Nectar Pricing Analysis and Forecast
3.2. Porter’s Five Forces
3.3. Market Ecosystem
3.4. SWOT Analysis
3.5. Regulatory Scenario
3.3. Effects of Inflation, Russia-Ukraine War, moderating economic growth, and other macroeconomic factors
Chapter 4. Competitive Landscape
4.1. Market Share Analysis
4.1.1. Global Fruit Juices and Nectar Market Share by Company, 2023
4.1.2. Product Offerings of Leading Fruit Juices and Nectar Companies
4.2. Market Entropy
4.2.1. New Product Launches in the Industry
4.2.2. Mergers, Acquisitions, Joint ventures, and Partnerships
4.3. Key Strategies and Best Practices
Chapter 5. Global Market Projections: Best, Reference, and Low Case Scenarios
5.1. Growth Analysis- Case Scenario Definitions
5.2. Low Growth Case Scenario Forecasts
5.3. Reference Growth Case Scenario Forecasts
5.4. High Growth Case Scenario Forecasts
Chapter 6. Market Dynamics
6.1. Fruit Juices and Nectar Market Drivers
6.2. Fruit Juices and Nectar Market Challenges
6.6. Fruit Juices and Nectar Market Opportunities
6.4. Fruit Juices and Nectar Market Trends
Chapter 7. Global Fruit Juices and Nectar Market Outlook Trends
7.1. Global Fruit Juices and Nectar Revenue (USD Million) and CAGR (%) by Type (2021-2032)
7.2. Global Fruit Juices and Nectar Revenue (USD Million) and CAGR (%) by Application (2021-2032)
7.3. Global Fruit Juices and Nectar Revenue (USD Million) and CAGR (%) by Product (2021-2032)
By Type
Apple
Orange
Grapes
Pineapple
Pear
Others
By Application
Beverages
Dairy and Food
Bakery
Confectionary
Others
Chapter 8. Global Fruit Juices and Nectar Regional Analysis and Outlook
8.1. Global Fruit Juices and Nectar Revenue (USD Million) By Regions (2021- 2032)
8.2. North America Fruit Juices and Nectar Revenue (USD Million) by Country (2021-2032)
8.2.1. United States Fruit Juices and Nectar Regional Analysis and Outlook
8.2.2. Canada Fruit Juices and Nectar Regional Analysis and Outlook
8.2.3. Mexico Fruit Juices and Nectar Regional Analysis and Outlook
8.3. Europe Fruit Juices and Nectar Revenue (USD Million), by Country (2021-2032)
8.3.1. Germany Fruit Juices and Nectar Regional Analysis and Outlook
8.3.2. France Fruit Juices and Nectar Regional Analysis and Outlook
8.3.3. United Kingdom Fruit Juices and Nectar Regional Analysis and Outlook
8.3.4. Spain Fruit Juices and Nectar Regional Analysis and Outlook
8.3.5. Italy Fruit Juices and Nectar Regional Analysis and Outlook
8.3.6. Russia Fruit Juices and Nectar Regional Analysis and Outlook
8.3.7. Rest of Europe Fruit Juices and Nectar Regional Analysis and Outlook
8.4. Asia Pacific Fruit Juices and Nectar Revenue (USD Million) by Country (2021-2032)
8.4.1. China Fruit Juices and Nectar Regional Analysis and Outlook
8.4.2. Japan Fruit Juices and Nectar Regional Analysis and Outlook
8.4.3. India Fruit Juices and Nectar Regional Analysis and Outlook
8.4.4. South Korea Fruit Juices and Nectar Regional Analysis and Outlook
8.4.5. Australia Fruit Juices and Nectar Regional Analysis and Outlook
8.4.6. South East Asia Fruit Juices and Nectar Regional Analysis and Outlook
8.4.7. Rest of Asia Pacific Fruit Juices and Nectar Regional Analysis and Outlook
8.5. South America Fruit Juices and Nectar Revenue (USD Million), by Country (2021-2032)
8.5.1. Brazil Fruit Juices and Nectar Regional Analysis and Outlook
8.5.2. Argentina Fruit Juices and Nectar Regional Analysis and Outlook
8.5.3. Rest of South America Fruit Juices and Nectar Regional Analysis and Outlook
8.6. Middle East and Africa Fruit Juices and Nectar Revenue (USD Million) by Country (2021-2032)
8.6.1. Middle East Fruit Juices and Nectar Regional Analysis and Outlook
8.6.2. Africa Fruit Juices and Nectar Regional Analysis and Outlook
Chapter 9. North America Fruit Juices and Nectar Analysis and Outlook
9.1. North America Fruit Juices and Nectar Revenue (USD Million) by Segments (2021-2032)
9.1.1. North America Fruit Juices and Nectar Revenue (USD Million) by Type (2021-2032)
9.1.2. North America Fruit Juices and Nectar Revenue (USD Million) by Application (2021-2032)
9.1.3. North America Fruit Juices and Nectar Revenue (USD Million) by Product (2021-2032)
By Type
Apple
Orange
Grapes
Pineapple
Pear
Others
By Application
Beverages
Dairy and Food
Bakery
Confectionary
Others
Chapter 10. Europe Fruit Juices and Nectar Analysis and Outlook
10.1. Europe Fruit Juices and Nectar Revenue (USD Million), by Segments (USD Million) (2021-2032)
10.1.1. Europe Fruit Juices and Nectar Revenue (USD Million) by Type (2021-2032)
10.1.2. Europe Fruit Juices and Nectar Revenue (USD Million) by Application (2021-2032)
10.1.3. Europe Fruit Juices and Nectar Revenue (USD Million) by Product (2021-2032)
By Type
Apple
Orange
Grapes
Pineapple
Pear
Others
By Application
Beverages
Dairy and Food
Bakery
Confectionary
Others
Chapter 11. Asia Pacific Fruit Juices and Nectar Analysis and Outlook
11.1. Asia Pacific Fruit Juices and Nectar Revenue (USD Million), and Revenue (USD Million) by Segments (2021-2032)
11.1.1. Asia Pacific Fruit Juices and Nectar Revenue (USD Million) by Type (2021-2032)
11.1.2. Asia Pacific Fruit Juices and Nectar Revenue (USD Million) by Application (2021-2032)
11.1.3. Asia Pacific Fruit Juices and Nectar Revenue (USD Million) by Product (2021-2032)
By Type
Apple
Orange
Grapes
Pineapple
Pear
Others
By Application
Beverages
Dairy and Food
Bakery
Confectionary
Others
Chapter 12. South America Fruit Juices and Nectar Analysis and Outlook
12.1. South America Fruit Juices and Nectar Revenue (USD Million), by Segments (2021-2032)
12.1.1. South America Fruit Juices and Nectar Revenue (USD Million) by Type (2021-2032)
12.1.2. South America Fruit Juices and Nectar Revenue (USD Million) by Application (2021-2032)
12.1.3. South America Fruit Juices and Nectar Revenue (USD Million) by Product (2021-2032)
By Type
Apple
Orange
Grapes
Pineapple
Pear
Others
By Application
Beverages
Dairy and Food
Bakery
Confectionary
Others
Chapter 13. Middle East and Africa Fruit Juices and Nectar Analysis and Outlook
13.1. Middle East and Africa Fruit Juices and Nectar Revenue (USD Million), by Segments (2021-2032)
13.1.1. Middle East and Africa Fruit Juices and Nectar Revenue (USD Million) by Type (2021-2032)
13.1.2. Middle East and Africa Fruit Juices and Nectar Revenue (USD Million) by Application (2021-2032)
13.1.3. Middle East and Africa Fruit Juices and Nectar Revenue (USD Million) by Product (2021-2032)
By Type
Apple
Orange
Grapes
Pineapple
Pear
Others
By Application
Beverages
Dairy and Food
Bakery
Confectionary
Others
Chapter 14. Fruit Juices and Nectar Company Profiles
14.1 Business Overview
14.2 Product Profiles
14.3 SWOT Profiles
14.5 Recent Developments
14.6 Financial Profile
List of Companies
AGRANA Group
China Haisheng Juice Holdings Co. Ltd
Dohler Group
Kanegrade Ltd
Kerry Group Plc
SkyPeople Fruit Juice Inc
SunOpta Inc
15. Methodology and Data Sources
15.1 Customization Offerings
15.2 Subscription Services
15.3 Related Reports
15.4 Publisher Expertise
LIST OF TABLES
Table 1 Market Segmentation Analysis
Table 2 Global Fruit Juices and Nectar Market Share of Leading Companies, 2023
Table 3 Product Offerings of Leading Companies
Table 4 Low Growth Scenario Forecasts
Table 5 Reference Case Growth Scenario
Table 6 High Growth Case Scenario
Table 7 Global Fruit Juices and Nectar Revenue (USD Million) And CAGR (%) By Type (2021-2032)
Table 8 Global Fruit Juices and Nectar Revenue (USD Million) And CAGR (%) By Application (2021-2032)
Table 9 Global Fruit Juices and Nectar Revenue (USD Million) And CAGR (%) By Product (2021-2032)
Table 10 Global Fruit Juices and Nectar Market Revenue (USD Million) By Regions (2021-2032)
Table 11 Global Fruit Juices and Nectar Market Share (%) By Regions (2021-2032)
Table 12 North America Fruit Juices and Nectar Revenue (USD Million) By Country (2021-2032)
Table 13 Europe Fruit Juices and Nectar Revenue (USD Million) By Country (2021-2032)
Table 14 Asia Pacific Fruit Juices and Nectar Revenue (USD Million) By Country (2021-2032)
Table 15 South America Fruit Juices and Nectar Revenue (USD Million) By Country (2021-2032)
Table 16 Middle East and Africa Fruit Juices and Nectar Revenue (USD Million) By Region (2021-2032)
Table 17 North America Fruit Juices and Nectar Revenue (USD Million) By Type (2021-2032)
Table 18 North America Fruit Juices and Nectar Revenue (USD Million) By Application (2021-2032)
Table 19 North America Fruit Juices and Nectar Revenue (USD Million) By Product (2021-2032)
Table 20 Europe Fruit Juices and Nectar Revenue (USD Million) By Type (2021-2032)
Table 21 Europe Fruit Juices and Nectar Revenue (USD Million) By Application (2021-2032)
Table 22 Europe Fruit Juices and Nectar Revenue (USD Million) By Product (2021-2032)
Table 23 Asia Pacific Fruit Juices and Nectar Revenue (USD Million) By Type (2021-2032)
Table 24 Asia Pacific Fruit Juices and Nectar Revenue (USD Million) By Application (2021-2032)
Table 25 Asia Pacific Fruit Juices and Nectar Revenue (USD Million) By Product (2021-2032)
Table 26 South America Fruit Juices and Nectar Revenue (USD Million) By Type (2021-2032)
Table 27 South America Fruit Juices and Nectar Revenue (USD Million) By Application (2021-2032)
Table 28 South America Fruit Juices and Nectar Revenue (USD Million) By Product (2021-2032)
Table 29 Middle East and Africa Fruit Juices and Nectar Revenue (USD Million) By Type (2021-2032)
Table 30 Middle East and Africa Fruit Juices and Nectar Revenue (USD Million) By Application (2021-2032)
Table 31 Middle East and Africa Fruit Juices and Nectar Revenue (USD Million) By Product (2021-2032)
LIST OF FIGURES
Figure 1. Market Scope
Figure 2. Pricing Forecasts Per Unit, 2023- 2032
Figure 3. Porter’s Five Forces
Figure 4. Global Fruit Juices and Nectar Market Revenue (USD Million) By Regions (2021-2032)
Figure 5. Global Fruit Juices and Nectar Market Share (%) By Regions (2023)
Figure 6. North America Fruit Juices and Nectar Revenue (USD Million) By Country (2021-2032)
Figure 7. United States Fruit Juices and Nectar Revenue (USD Million) By Country (2021-2032)
Figure 8. Canada Fruit Juices and Nectar Revenue (USD Million) By Country (2021-2032)
Figure 9. Mexico Fruit Juices and Nectar Revenue (USD Million) By Country (2021-2032)
Figure 10. Europe Fruit Juices and Nectar Revenue (USD Million) By Country (2021-2032)
Figure 11. Germany Fruit Juices and Nectar Revenue (USD Million) By Country (2021-2032)
Figure 12. France Fruit Juices and Nectar Revenue (USD Million) By Country (2021-2032)
Figure 13. United Kingdom Fruit Juices and Nectar Revenue (USD Million) By Country (2021-2032)
Figure 14. Spain Fruit Juices and Nectar Revenue (USD Million) By Country (2021-2032)
Figure 15. Italy Fruit Juices and Nectar Revenue (USD Million) By Country (2021-2032)
Figure 16. Russia Fruit Juices and Nectar Revenue (USD Million) By Country (2021-2032)
Figure 17. Rest of Europe Fruit Juices and Nectar Revenue (USD Million) By Country (2021-2032)
Figure 11. Asia Pacific Fruit Juices and Nectar Revenue (USD Million) By Country (2021-2032)
Figure 12. China Fruit Juices and Nectar Revenue (USD Million) By Country (2021-2032)
Figure 13. Japan Fruit Juices and Nectar Revenue (USD Million) By Country (2021-2032)
Figure 14. India Fruit Juices and Nectar Revenue (USD Million) By Country (2021-2032)
Figure 15. South Korea Fruit Juices and Nectar Revenue (USD Million) By Country (2021-2032)
Figure 16. Australia Fruit Juices and Nectar Revenue (USD Million) By Country (2021-2032)
Figure 17. South East Asia Fruit Juices and Nectar Revenue (USD Million) By Country (2021-2032)
Figure 18. South America Fruit Juices and Nectar Revenue (USD Million) By Country (2021-2032)
Figure 19. Brazil Fruit Juices and Nectar Revenue (USD Million) By Country (2021-2032)
Figure 20. Argentina Fruit Juices and Nectar Revenue (USD Million) By Country (2021-2032)
Figure 21. Rest of Asia Pacific Fruit Juices and Nectar Revenue (USD Million) By Country (2021-2032)
Figure 22. Middle East and Africa Fruit Juices and Nectar Revenue (USD Million) By Region (2021-2032)
Figure 23. Saudi Arabia Fruit Juices and Nectar Revenue (USD Million) By Region (2021-2032)
Figure 24. The UAE Fruit Juices and Nectar Revenue (USD Million) By Region (2021-2032)
Figure 25. Rest of Middle East Fruit Juices and Nectar Revenue (USD Million) By Region (2021-2032)
Figure 26. South Africa Fruit Juices and Nectar Revenue (USD Million) By Region (2021-2032)
Figure 27. Africa Fruit Juices and Nectar Revenue (USD Million) By Region (2021-2032)
Figure 28. North America Fruit Juices and Nectar Revenue (USD Million) By Type (2021-2032)
Figure 29. North America Fruit Juices and Nectar Revenue (USD Million) By Application (2021-2032)
Figure 30. North America Fruit Juices and Nectar Revenue (USD Million) By Product (2021-2032)
Figure 31. Europe Fruit Juices and Nectar Revenue (USD Million) By Type (2021-2032)
Figure 32. Europe Fruit Juices and Nectar Revenue (USD Million) By Application (2021-2032)
Figure 33. Europe Fruit Juices and Nectar Revenue (USD Million) By Product (2021-2032)
Figure 34. Asia Pacific Fruit Juices and Nectar Revenue (USD Million) By Type (2021-2032)
Figure 35. Asia Pacific Fruit Juices and Nectar Revenue (USD Million) By Application (2021-2032)
Figure 36. Asia Pacific Fruit Juices and Nectar Revenue (USD Million) By Product (2021-2032)
Figure 37. South America Fruit Juices and Nectar Revenue (USD Million) By Type (2021-2032)
Figure 38. South America Fruit Juices and Nectar Revenue (USD Million) By Application (2021-2032)
Figure 39. South America Fruit Juices and Nectar Revenue (USD Million) By Product (2021-2032)
Figure 40. Middle East and Africa Fruit Juices and Nectar Revenue (USD Million) By Type (2021-2032)
Figure 41. Middle East and Africa Fruit Juices and Nectar Revenue (USD Million) By Application (2021-2032)
Figure 42. Middle East and Africa Fruit Juices and Nectar Revenue (USD Million) By Product (2021-2032)
By Type
Apple
Orange
Grapes
Pineapple
Pear
Others
By Application
Beverages
Dairy and Food
Bakery
Confectionary
Others
Countries Analyzed
North America (US, Canada, Mexico)
Europe (Germany, UK, France, Spain, Italy, Russia, Rest of Europe)
Asia Pacific (China, India, Japan, South Korea, Australia, South East Asia, Rest of Asia)
South America (Brazil, Argentina, Rest of South America)
Middle East and Africa (Saudi Arabia, UAE, Rest of Middle East, South Africa, Egypt, Rest of Africa)
