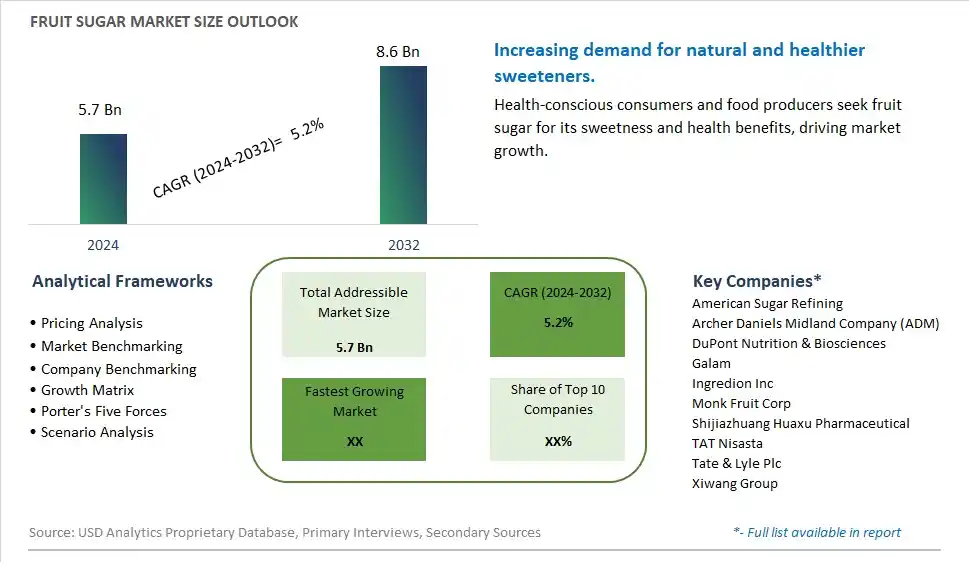
Global Fruit Sugar Market Size is valued at $5.7 Billion in 2024 and is forecast to register a growth rate (CAGR) of 5.2% to reach $8.6 Billion by 2032.
The global Fruit Sugar Market Comprehensive Study analyzes and forecasts the market size across 6 regions and 24 countries for diverse segments -By Type (Berries Sugar, Citrus Fruits Sugar, Apple Sugar, Mango Sugar, Banana Sugar, Others), By Application (Food and Beverage, Pharmaceutical, Others)
An Introduction to Fruit Sugar Market
In 2024, the Fruit Sugar market is experiencing significant growth, driven by the rising demand for natural and low-glycemic sweeteners. Fruit sugar, derived from fruits such as apples and grapes, is popular among health-conscious consumers and those managing blood sugar levels. The market benefits from advancements in sugar extraction and formulation technologies, the growing trend of clean label and natural ingredients, and the expansion of the functional food and beverage sectors. Additionally, the increasing focus on reducing sugar intake and promoting healthy eating is driving market growth.
Fruit Sugar Competitive Landscape
The market report analyses the leading companies in the industry including American Sugar Refining, Archer Daniels Midland Company (ADM), DuPont Nutrition & Biosciences, Galam, Ingredion Inc, Monk Fruit Corp, Shijiazhuang Huaxu Pharmaceutical, TAT Nisasta, Tate & Lyle Plc, Xiwang Group, and Others.
Fruit Sugar Market Dynamics
Fruit Sugar Market Trend: Rising Demand for Natural and Low-Calorie Sweeteners
The most prominent trend in the Fruit Sugar Market is the rising demand for natural and low-calorie sweeteners. As consumers seek to reduce sugar intake without compromising on taste, fruit sugar is gaining popularity for its natural origin and lower calorie content. This trend is driven by the increasing prevalence of diabetes, obesity, and other lifestyle-related health issues, which are prompting consumers to opt for healthier alternatives to sugar.
Fruit Sugar Market Driver: Increase in Health and Wellness Products
The key driver of the Fruit Sugar Market is the increase in health and wellness products. As more consumers focus on managing their weight and improving their overall health, there is a higher demand for natural sweeteners that offer the sweetness of sugar without the associated health risks. Fruit sugar, with its low-calorie content and natural properties, is widely used in the production of sugar-free, reduced-calorie, and functional food products, driving its market growth.
Fruit Sugar Market Opportunity: Expansion into Functional and Fortified Foods
A significant opportunity in the Fruit Sugar Market lies in the expansion into functional and fortified foods. By incorporating fruit sugar into a variety of food products, such as protein bars, fortified snacks, and health drinks, companies can cater to the growing demand for functional foods that offer specific health benefits. This approach can help manufacturers capture a larger share of the health-conscious consumer market and drive market growth.
Fruit Sugar Market Share Analysis: Food and Beverage is the fastest growing segment over the forecast period to 2032
The Food and Beverage segment is the fastest-growing within the Fruit Sugar Market by application, projected to experience significant growth up to 2032. This rapid growth is driven by the increasing consumer demand for natural and healthy sweeteners in food and beverages. Fruit sugars, derived from fruits like berries, citrus, apples, and mangoes, are favored for their natural origin and health benefits compared to traditional refined sugars. They are used in a wide range of products, including beverages, baked goods, confectionery, dairy products, and sauces, to enhance sweetness while providing additional nutritional benefits. The growing trend towards clean-label and organic products has further boosted the demand for fruit sugars in the food and beverage industry. Manufacturers are increasingly incorporating fruit sugars into their products to cater to health-conscious consumers who seek natural ingredients and lower-calorie options. Innovations in product formulations and the rising popularity of functional foods and beverages that offer health benefits beyond basic nutrition are also contributing to the segment's growth. As the food and beverage industry continues to evolve and prioritize health and wellness, the demand for fruit sugars is expected to soar, solidifying the Food and Beverage segment as the fastest-growing application in the fruit sugar market.
Fruit Sugar Market Share Analysis: Berries Sugar segment generated the highest revenue share in the industry
Berries Sugar is the largest segment within the Fruit Sugar Market by type. This segment's dominance is attributed to the high demand for berry-derived sugars, which are known for their sweet flavor, high nutritional value, and numerous health benefits. Sugars extracted from berries like strawberries, blueberries, raspberries, and blackberries are rich in antioxidants, vitamins, and minerals, making them a popular choice among health-conscious consumers. Berry sugars are widely used in a variety of applications, including beverages, baked goods, dairy products, and dietary supplements, to enhance sweetness and nutritional content. The natural sweetness of berry sugars, combined with their vibrant color and flavor, makes them a versatile ingredient in both food and beverage products. Additionally, the increasing awareness of the health benefits associated with berry consumption, such as improved heart health and reduced inflammation, has further boosted their popularity. The broad appeal of berries and their extensive use in various culinary and nutritional applications ensure that Berries Sugar remains the largest segment in the fruit sugar market.
Fruit Sugar Market Segmentation
By Type
Berries Sugar
Citrus Fruits Sugar
Apple Sugar
Mango Sugar
Banana Sugar
Others
By Application
Food and Beverage
Pharmaceutical
Others
Countries Analyzed
North America (US, Canada, Mexico)
Europe (Germany, UK, France, Spain, Italy, Russia, Rest of Europe)
Asia Pacific (China, India, Japan, South Korea, Australia, South East Asia, Rest of Asia)
South America (Brazil, Argentina, Rest of South America)
Middle East and Africa (Saudi Arabia, UAE, Rest of Middle East, South Africa, Egypt, Rest of Africa)
Fruit Sugar Companies Profiled in the Study
American Sugar Refining
Archer Daniels Midland Company (ADM)
DuPont Nutrition & Biosciences
Galam
Ingredion Inc
Monk Fruit Corp
Shijiazhuang Huaxu Pharmaceutical
TAT Nisasta
Tate & Lyle Plc
Xiwang Group
*- List Not Exhaustive
Chapter 1. TABLE OF CONTENTS
Chapter 2. Introduction to Fruit Sugar Market
2.1. Market Overview
2.2. Key Statistics and Report Highlights
2.3. Scope of the Comprehensive Study
2.3.1. Market Definition
2.3.2 Countries and Regions Covered
2.3.3 Research Objective
2.3.4 Units, Currency, and Conversions
2.3.5 Industry Value Chain
2.4. Key Market Segments
2.5. Key Companies
2.6. Study Period
Chapter 3. Strategic Analysis Review
3.1. Fruit Sugar Pricing Analysis and Forecast
3.2. Porter’s Five Forces
3.3. Market Ecosystem
3.4. SWOT Analysis
3.5. Regulatory Scenario
3.3. Effects of Inflation, Russia-Ukraine War, moderating economic growth, and other macroeconomic factors
Chapter 4. Competitive Landscape
4.1. Market Share Analysis
4.1.1. Global Fruit Sugar Market Share by Company, 2023
4.1.2. Product Offerings of Leading Fruit Sugar Companies
4.2. Market Entropy
4.2.1. New Product Launches in the Industry
4.2.2. Mergers, Acquisitions, Joint ventures, and Partnerships
4.3. Key Strategies and Best Practices
Chapter 5. Global Market Projections: Best, Reference, and Low Case Scenarios
5.1. Growth Analysis- Case Scenario Definitions
5.2. Low Growth Case Scenario Forecasts
5.3. Reference Growth Case Scenario Forecasts
5.4. High Growth Case Scenario Forecasts
Chapter 6. Market Dynamics
6.1. Fruit Sugar Market Drivers
6.2. Fruit Sugar Market Challenges
6.6. Fruit Sugar Market Opportunities
6.4. Fruit Sugar Market Trends
Chapter 7. Global Fruit Sugar Market Outlook Trends
7.1. Global Fruit Sugar Revenue (USD Million) and CAGR (%) by Type (2021-2032)
7.2. Global Fruit Sugar Revenue (USD Million) and CAGR (%) by Application (2021-2032)
7.3. Global Fruit Sugar Revenue (USD Million) and CAGR (%) by Product (2021-2032)
By Type
Berries Sugar
Citrus Fruits Sugar
Apple Sugar
Mango Sugar
Banana Sugar
Others
By Application
Food and Beverage
Pharmaceutical
Others
Chapter 8. Global Fruit Sugar Regional Analysis and Outlook
8.1. Global Fruit Sugar Revenue (USD Million) By Regions (2021- 2032)
8.2. North America Fruit Sugar Revenue (USD Million) by Country (2021-2032)
8.2.1. United States Fruit Sugar Regional Analysis and Outlook
8.2.2. Canada Fruit Sugar Regional Analysis and Outlook
8.2.3. Mexico Fruit Sugar Regional Analysis and Outlook
8.3. Europe Fruit Sugar Revenue (USD Million), by Country (2021-2032)
8.3.1. Germany Fruit Sugar Regional Analysis and Outlook
8.3.2. France Fruit Sugar Regional Analysis and Outlook
8.3.3. United Kingdom Fruit Sugar Regional Analysis and Outlook
8.3.4. Spain Fruit Sugar Regional Analysis and Outlook
8.3.5. Italy Fruit Sugar Regional Analysis and Outlook
8.3.6. Russia Fruit Sugar Regional Analysis and Outlook
8.3.7. Rest of Europe Fruit Sugar Regional Analysis and Outlook
8.4. Asia Pacific Fruit Sugar Revenue (USD Million) by Country (2021-2032)
8.4.1. China Fruit Sugar Regional Analysis and Outlook
8.4.2. Japan Fruit Sugar Regional Analysis and Outlook
8.4.3. India Fruit Sugar Regional Analysis and Outlook
8.4.4. South Korea Fruit Sugar Regional Analysis and Outlook
8.4.5. Australia Fruit Sugar Regional Analysis and Outlook
8.4.6. South East Asia Fruit Sugar Regional Analysis and Outlook
8.4.7. Rest of Asia Pacific Fruit Sugar Regional Analysis and Outlook
8.5. South America Fruit Sugar Revenue (USD Million), by Country (2021-2032)
8.5.1. Brazil Fruit Sugar Regional Analysis and Outlook
8.5.2. Argentina Fruit Sugar Regional Analysis and Outlook
8.5.3. Rest of South America Fruit Sugar Regional Analysis and Outlook
8.6. Middle East and Africa Fruit Sugar Revenue (USD Million) by Country (2021-2032)
8.6.1. Middle East Fruit Sugar Regional Analysis and Outlook
8.6.2. Africa Fruit Sugar Regional Analysis and Outlook
Chapter 9. North America Fruit Sugar Analysis and Outlook
9.1. North America Fruit Sugar Revenue (USD Million) by Segments (2021-2032)
9.1.1. North America Fruit Sugar Revenue (USD Million) by Type (2021-2032)
9.1.2. North America Fruit Sugar Revenue (USD Million) by Application (2021-2032)
9.1.3. North America Fruit Sugar Revenue (USD Million) by Product (2021-2032)
By Type
Berries Sugar
Citrus Fruits Sugar
Apple Sugar
Mango Sugar
Banana Sugar
Others
By Application
Food and Beverage
Pharmaceutical
Others
Chapter 10. Europe Fruit Sugar Analysis and Outlook
10.1. Europe Fruit Sugar Revenue (USD Million), by Segments (USD Million) (2021-2032)
10.1.1. Europe Fruit Sugar Revenue (USD Million) by Type (2021-2032)
10.1.2. Europe Fruit Sugar Revenue (USD Million) by Application (2021-2032)
10.1.3. Europe Fruit Sugar Revenue (USD Million) by Product (2021-2032)
By Type
Berries Sugar
Citrus Fruits Sugar
Apple Sugar
Mango Sugar
Banana Sugar
Others
By Application
Food and Beverage
Pharmaceutical
Others
Chapter 11. Asia Pacific Fruit Sugar Analysis and Outlook
11.1. Asia Pacific Fruit Sugar Revenue (USD Million), and Revenue (USD Million) by Segments (2021-2032)
11.1.1. Asia Pacific Fruit Sugar Revenue (USD Million) by Type (2021-2032)
11.1.2. Asia Pacific Fruit Sugar Revenue (USD Million) by Application (2021-2032)
11.1.3. Asia Pacific Fruit Sugar Revenue (USD Million) by Product (2021-2032)
By Type
Berries Sugar
Citrus Fruits Sugar
Apple Sugar
Mango Sugar
Banana Sugar
Others
By Application
Food and Beverage
Pharmaceutical
Others
Chapter 12. South America Fruit Sugar Analysis and Outlook
12.1. South America Fruit Sugar Revenue (USD Million), by Segments (2021-2032)
12.1.1. South America Fruit Sugar Revenue (USD Million) by Type (2021-2032)
12.1.2. South America Fruit Sugar Revenue (USD Million) by Application (2021-2032)
12.1.3. South America Fruit Sugar Revenue (USD Million) by Product (2021-2032)
By Type
Berries Sugar
Citrus Fruits Sugar
Apple Sugar
Mango Sugar
Banana Sugar
Others
By Application
Food and Beverage
Pharmaceutical
Others
Chapter 13. Middle East and Africa Fruit Sugar Analysis and Outlook
13.1. Middle East and Africa Fruit Sugar Revenue (USD Million), by Segments (2021-2032)
13.1.1. Middle East and Africa Fruit Sugar Revenue (USD Million) by Type (2021-2032)
13.1.2. Middle East and Africa Fruit Sugar Revenue (USD Million) by Application (2021-2032)
13.1.3. Middle East and Africa Fruit Sugar Revenue (USD Million) by Product (2021-2032)
By Type
Berries Sugar
Citrus Fruits Sugar
Apple Sugar
Mango Sugar
Banana Sugar
Others
By Application
Food and Beverage
Pharmaceutical
Others
Chapter 14. Fruit Sugar Company Profiles
14.1 Business Overview
14.2 Product Profiles
14.3 SWOT Profiles
14.5 Recent Developments
14.6 Financial Profile
List of Companies
American Sugar Refining
Archer Daniels Midland Company (ADM)
DuPont Nutrition & Biosciences
Galam
Ingredion Inc
Monk Fruit Corp
Shijiazhuang Huaxu Pharmaceutical
TAT Nisasta
Tate & Lyle Plc
Xiwang Group
15. Methodology and Data Sources
15.1 Customization Offerings
15.2 Subscription Services
15.3 Related Reports
15.4 Publisher Expertise
LIST OF TABLES
Table 1 Market Segmentation Analysis
Table 2 Global Fruit Sugar Market Share of Leading Companies, 2023
Table 3 Product Offerings of Leading Companies
Table 4 Low Growth Scenario Forecasts
Table 5 Reference Case Growth Scenario
Table 6 High Growth Case Scenario
Table 7 Global Fruit Sugar Revenue (USD Million) And CAGR (%) By Type (2021-2032)
Table 8 Global Fruit Sugar Revenue (USD Million) And CAGR (%) By Application (2021-2032)
Table 9 Global Fruit Sugar Revenue (USD Million) And CAGR (%) By Product (2021-2032)
Table 10 Global Fruit Sugar Market Revenue (USD Million) By Regions (2021-2032)
Table 11 Global Fruit Sugar Market Share (%) By Regions (2021-2032)
Table 12 North America Fruit Sugar Revenue (USD Million) By Country (2021-2032)
Table 13 Europe Fruit Sugar Revenue (USD Million) By Country (2021-2032)
Table 14 Asia Pacific Fruit Sugar Revenue (USD Million) By Country (2021-2032)
Table 15 South America Fruit Sugar Revenue (USD Million) By Country (2021-2032)
Table 16 Middle East and Africa Fruit Sugar Revenue (USD Million) By Region (2021-2032)
Table 17 North America Fruit Sugar Revenue (USD Million) By Type (2021-2032)
Table 18 North America Fruit Sugar Revenue (USD Million) By Application (2021-2032)
Table 19 North America Fruit Sugar Revenue (USD Million) By Product (2021-2032)
Table 20 Europe Fruit Sugar Revenue (USD Million) By Type (2021-2032)
Table 21 Europe Fruit Sugar Revenue (USD Million) By Application (2021-2032)
Table 22 Europe Fruit Sugar Revenue (USD Million) By Product (2021-2032)
Table 23 Asia Pacific Fruit Sugar Revenue (USD Million) By Type (2021-2032)
Table 24 Asia Pacific Fruit Sugar Revenue (USD Million) By Application (2021-2032)
Table 25 Asia Pacific Fruit Sugar Revenue (USD Million) By Product (2021-2032)
Table 26 South America Fruit Sugar Revenue (USD Million) By Type (2021-2032)
Table 27 South America Fruit Sugar Revenue (USD Million) By Application (2021-2032)
Table 28 South America Fruit Sugar Revenue (USD Million) By Product (2021-2032)
Table 29 Middle East and Africa Fruit Sugar Revenue (USD Million) By Type (2021-2032)
Table 30 Middle East and Africa Fruit Sugar Revenue (USD Million) By Application (2021-2032)
Table 31 Middle East and Africa Fruit Sugar Revenue (USD Million) By Product (2021-2032)
LIST OF FIGURES
Figure 1. Market Scope
Figure 2. Pricing Forecasts Per Unit, 2023- 2032
Figure 3. Porter’s Five Forces
Figure 4. Global Fruit Sugar Market Revenue (USD Million) By Regions (2021-2032)
Figure 5. Global Fruit Sugar Market Share (%) By Regions (2023)
Figure 6. North America Fruit Sugar Revenue (USD Million) By Country (2021-2032)
Figure 7. United States Fruit Sugar Revenue (USD Million) By Country (2021-2032)
Figure 8. Canada Fruit Sugar Revenue (USD Million) By Country (2021-2032)
Figure 9. Mexico Fruit Sugar Revenue (USD Million) By Country (2021-2032)
Figure 10. Europe Fruit Sugar Revenue (USD Million) By Country (2021-2032)
Figure 11. Germany Fruit Sugar Revenue (USD Million) By Country (2021-2032)
Figure 12. France Fruit Sugar Revenue (USD Million) By Country (2021-2032)
Figure 13. United Kingdom Fruit Sugar Revenue (USD Million) By Country (2021-2032)
Figure 14. Spain Fruit Sugar Revenue (USD Million) By Country (2021-2032)
Figure 15. Italy Fruit Sugar Revenue (USD Million) By Country (2021-2032)
Figure 16. Russia Fruit Sugar Revenue (USD Million) By Country (2021-2032)
Figure 17. Rest of Europe Fruit Sugar Revenue (USD Million) By Country (2021-2032)
Figure 11. Asia Pacific Fruit Sugar Revenue (USD Million) By Country (2021-2032)
Figure 12. China Fruit Sugar Revenue (USD Million) By Country (2021-2032)
Figure 13. Japan Fruit Sugar Revenue (USD Million) By Country (2021-2032)
Figure 14. India Fruit Sugar Revenue (USD Million) By Country (2021-2032)
Figure 15. South Korea Fruit Sugar Revenue (USD Million) By Country (2021-2032)
Figure 16. Australia Fruit Sugar Revenue (USD Million) By Country (2021-2032)
Figure 17. South East Asia Fruit Sugar Revenue (USD Million) By Country (2021-2032)
Figure 18. South America Fruit Sugar Revenue (USD Million) By Country (2021-2032)
Figure 19. Brazil Fruit Sugar Revenue (USD Million) By Country (2021-2032)
Figure 20. Argentina Fruit Sugar Revenue (USD Million) By Country (2021-2032)
Figure 21. Rest of Asia Pacific Fruit Sugar Revenue (USD Million) By Country (2021-2032)
Figure 22. Middle East and Africa Fruit Sugar Revenue (USD Million) By Region (2021-2032)
Figure 23. Saudi Arabia Fruit Sugar Revenue (USD Million) By Region (2021-2032)
Figure 24. The UAE Fruit Sugar Revenue (USD Million) By Region (2021-2032)
Figure 25. Rest of Middle East Fruit Sugar Revenue (USD Million) By Region (2021-2032)
Figure 26. South Africa Fruit Sugar Revenue (USD Million) By Region (2021-2032)
Figure 27. Africa Fruit Sugar Revenue (USD Million) By Region (2021-2032)
Figure 28. North America Fruit Sugar Revenue (USD Million) By Type (2021-2032)
Figure 29. North America Fruit Sugar Revenue (USD Million) By Application (2021-2032)
Figure 30. North America Fruit Sugar Revenue (USD Million) By Product (2021-2032)
Figure 31. Europe Fruit Sugar Revenue (USD Million) By Type (2021-2032)
Figure 32. Europe Fruit Sugar Revenue (USD Million) By Application (2021-2032)
Figure 33. Europe Fruit Sugar Revenue (USD Million) By Product (2021-2032)
Figure 34. Asia Pacific Fruit Sugar Revenue (USD Million) By Type (2021-2032)
Figure 35. Asia Pacific Fruit Sugar Revenue (USD Million) By Application (2021-2032)
Figure 36. Asia Pacific Fruit Sugar Revenue (USD Million) By Product (2021-2032)
Figure 37. South America Fruit Sugar Revenue (USD Million) By Type (2021-2032)
Figure 38. South America Fruit Sugar Revenue (USD Million) By Application (2021-2032)
Figure 39. South America Fruit Sugar Revenue (USD Million) By Product (2021-2032)
Figure 40. Middle East and Africa Fruit Sugar Revenue (USD Million) By Type (2021-2032)
Figure 41. Middle East and Africa Fruit Sugar Revenue (USD Million) By Application (2021-2032)
Figure 42. Middle East and Africa Fruit Sugar Revenue (USD Million) By Product (2021-2032)
By Type
Berries Sugar
Citrus Fruits Sugar
Apple Sugar
Mango Sugar
Banana Sugar
Others
By Application
Food and Beverage
Pharmaceutical
Others
Countries Analyzed
North America (US, Canada, Mexico)
Europe (Germany, UK, France, Spain, Italy, Russia, Rest of Europe)
Asia Pacific (China, India, Japan, South Korea, Australia, South East Asia, Rest of Asia)
South America (Brazil, Argentina, Rest of South America)
Middle East and Africa (Saudi Arabia, UAE, Rest of Middle East, South Africa, Egypt, Rest of Africa)
