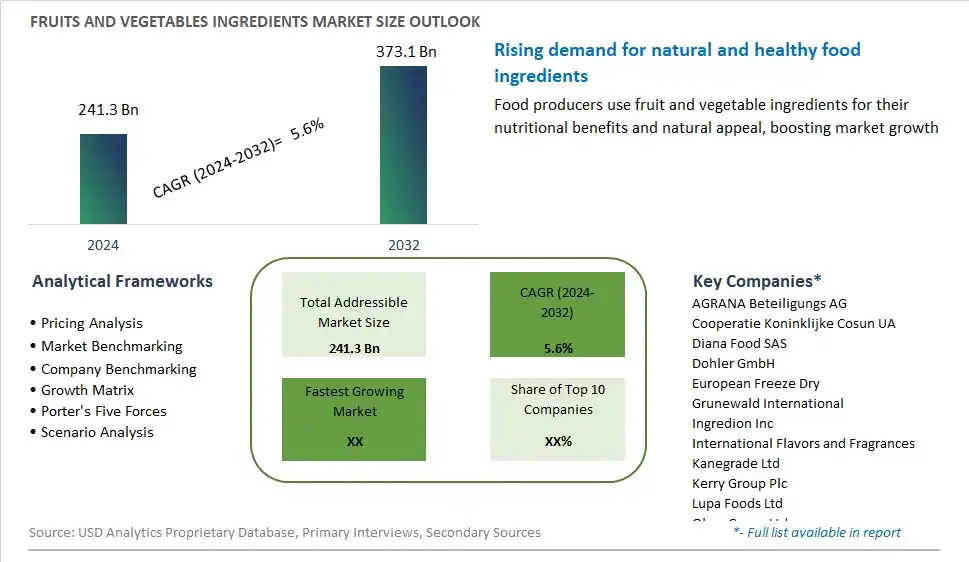
Global Fruits and Vegetables Ingredients Market Size is valued at $241.3 Billion in 2024 and is forecast to register a growth rate (CAGR) of 5.6% to reach $373.1 Billion by 2032.
The global Fruits and Vegetables Ingredients Market Comprehensive Study analyzes and forecasts the market size across 6 regions and 24 countries for diverse segments -By Ingredient (Fruits, Vegetables), By Form (Concentrates, Pastes and Purees, Pieces, Powders, NFC Juices), By Application (Beverages, Confectionary Products, Bakery Products, Soups and Sauces, Dairy Products, RTE Products)
An Introduction to Fruits and Vegetables Ingredients Market
The Fruits and Vegetables Ingredients Market focuses on the production and sale of processed ingredients derived from fruits and vegetables, such as purees, concentrates, powders, and extracts. These ingredients are used in a wide range of food and beverage products. The market is driven by increasing consumer demand for natural and healthy ingredients, rising popularity of plant-based diets, and growing use of fruit and vegetable ingredients in functional foods and beverages. Additionally, advancements in processing technologies and the expansion of product applications support market growth.
Fruits and Vegetables Ingredients Competitive Landscape
The market report analyses the leading companies in the industry including AGRANA Beteiligungs AG, Cooperatie Koninklijke Cosun UA, Diana Food SAS, Dohler GmbH, European Freeze Dry, Grunewald International, Ingredion Inc, International Flavors and Fragrances, Kanegrade Ltd, Kerry Group Plc, Lupa Foods Ltd, Olam Group Ltd, Sensient Technologies Corp, SunOpta Inc, Tate & Lyle Plc, The Scoular Co., Yaax International Inc, and Others.
Fruits and Vegetables Ingredients Market Dynamics
Fruits and Vegetables Ingredients Market Trend: Growing Demand for Clean Label and Natural Ingredients
A significant trend in the fruits and vegetables ingredients market is the growing demand for clean label and natural ingredients in food and beverage products. Consumers are increasingly seeking products with simple, recognizable ingredients, leading to a shift away from artificial additives and preservatives. Fruits and vegetables ingredients, such as natural flavors, colors, extracts, and concentrates, are gaining popularity as they offer a way to enhance the nutritional profile, flavor, and appearance of food products while meeting clean label criteria. This trend reflects a broader movement towards healthier and more transparent food choices, with consumers prioritizing products that are minimally processed and free from synthetic chemicals.
Market Driver: Rise in Plant-Based and Health-Conscious Diets
A key driver of the fruits and vegetables ingredients market is the rise in plant-based and health-conscious diets, driven by increasing awareness of the health benefits associated with consuming fruits and vegetables. As consumers seek to incorporate more plant-based foods into their diets, there is a growing demand for ingredients derived from fruits and vegetables that offer nutritional value, flavor, and functional properties. Fruits and vegetables ingredients are versatile and can be used in a wide range of food and beverage applications, including snacks, beverages, dairy alternatives, baked goods, and ready-to-eat meals. Moreover, the rise of health and wellness trends, such as clean eating, organic, and plant-powered diets, has further fueled demand for fruits and vegetables ingredients as consumers look for ways to support their health and well-being through their food choices.
Market Opportunity: Innovation in Functional and Value-Added Ingredients
An opportunity for growth in the fruits and vegetables ingredients market lies in innovation in functional and value-added ingredients that offer additional health benefits and appeal to evolving consumer preferences. There is potential to develop ingredients enriched with vitamins, minerals, antioxidants, dietary fibers, and other bioactive compounds that contribute to health promotion and disease prevention. Additionally, there is an opportunity to introduce value-added ingredients with specific functional properties, such as natural sweeteners, flavor enhancers, texturizers, and shelf-life extenders, that improve the taste, texture, and stability of food products. Furthermore, there is potential to innovate with novel ingredients derived from underutilized or exotic fruits and vegetables, tapping into emerging culinary trends and global flavor profiles. By focusing on innovation and addressing consumer needs for healthier, more natural ingredients, manufacturers can capitalize on the opportunities presented by the dynamic fruits and vegetables ingredients market.
Fruits and Vegetables Ingredients Market Share Analysis: Fruits held the dominant market share in 2024
Within the Fruits and Vegetables Ingredients Market, the Fruits segment stands as the largest, driven by its versatile applications and widespread consumer appeal. Fruits serve as a cornerstone ingredient in a myriad of food and beverage products, ranging from juices and smoothies to desserts and snacks. Their natural sweetness, vibrant colors, and rich nutritional profile make them a favored choice among consumers seeking flavorful and nutritious ingredients. Further, fruits offer a wide variety of flavors and textures, allowing manufacturers to create innovative and diverse products that cater to evolving consumer preferences. With the growing emphasis on healthy eating and clean label ingredients, the Fruits segment continues to dominate the market, solidifying its position as the largest and most sought-after category in the Fruits and Vegetables Ingredients Market.
Fruits and Vegetables Ingredients Market Share Analysis: Powders market is poised to register the fastest growth rae over the forecast period to 2032
In the dynamic realm of the Fruits and Vegetables Ingredients Market, the Powders segment is the fastest-growing, propelled by its versatility and convenience. Fruit and vegetable powders offer a concentrated form of natural flavors and nutrients, making them an ideal ingredient for a wide array of food and beverage applications. Their long shelf life, ease of handling, and enhanced flavor retention compared to fresh produce appeal to manufacturers seeking efficient and cost-effective ingredient solutions. Further, the growing demand for natural and clean label products drives the adoption of fruit and vegetable powders as alternatives to artificial flavorings and additives. As consumer preferences continue to evolve towards healthier and more sustainable food choices, the Powders segment is poised to sustain its rapid growth trajectory, reshaping the Fruits and Vegetables Ingredients Market with its versatility and nutritional benefits.
Fruits and Vegetables Ingredients Market Share Analysis: Beverages held the dominant market share in 2024
Within the Fruits and Vegetables Ingredients Market, the Beverages segment reigns supreme as the largest, driven by its widespread usage and versatile applications. Fruits and vegetables serve as essential ingredients in a multitude of beverage formulations, including juices, smoothies, teas, and flavored waters. Their natural sweetness, vibrant colors, and rich nutritional profiles make them prized components in beverages, appealing to health-conscious consumers seeking refreshing and nutritious options. Further, the growing trend towards natural and clean label products further fuels the demand for fruit and vegetable ingredients in beverages, as consumers prioritize wholesome and recognizable ingredients. As the beverage industry continues to innovate with new flavor combinations and functional formulations, the Beverages segment maintains its dominance, solidifying its position as the largest and most indispensable segment in the Fruits and Vegetables Ingredients Market.
Fruits and Vegetables Ingredients Market Segmentation
By Ingredient
Fruits
Vegetables
By Form
Concentrates
Pastes and Purees
Pieces
Powders
NFC Juices
By Application
Beverages
Confectionary Products
Bakery Products
Soups and Sauces
Dairy Products
RTE Products
Countries Analyzed
North America (US, Canada, Mexico)
Europe (Germany, UK, France, Spain, Italy, Russia, Rest of Europe)
Asia Pacific (China, India, Japan, South Korea, Australia, South East Asia, Rest of Asia)
South America (Brazil, Argentina, Rest of South America)
Middle East and Africa (Saudi Arabia, UAE, Rest of Middle East, South Africa, Egypt, Rest of Africa)
Fruits and Vegetables Ingredients Companies Profiled in the Study
AGRANA Beteiligungs AG
Cooperatie Koninklijke Cosun UA
Diana Food SAS
Dohler GmbH
European Freeze Dry
Grunewald International
Ingredion Inc
International Flavors and Fragrances
Kanegrade Ltd
Kerry Group Plc
Lupa Foods Ltd
Olam Group Ltd
Sensient Technologies Corp
SunOpta Inc
Tate & Lyle Plc
The Scoular Co.
Yaax International Inc
*- List Not Exhaustive
Chapter 1. TABLE OF CONTENTS
Chapter 2. Introduction to Fruits and Vegetables Ingredients Market
2.1. Market Overview
2.2. Key Statistics and Report Highlights
2.3. Scope of the Comprehensive Study
2.3.1. Market Definition
2.3.2 Countries and Regions Covered
2.3.3 Research Objective
2.3.4 Units, Currency, and Conversions
2.3.5 Industry Value Chain
2.4. Key Market Segments
2.5. Key Companies
2.6. Study Period
Chapter 3. Strategic Analysis Review
3.1. Fruits and Vegetables Ingredients Pricing Analysis and Forecast
3.2. Porter’s Five Forces
3.3. Market Ecosystem
3.4. SWOT Analysis
3.5. Regulatory Scenario
3.3. Effects of Inflation, Russia-Ukraine War, moderating economic growth, and other macroeconomic factors
Chapter 4. Competitive Landscape
4.1. Market Share Analysis
4.1.1. Global Fruits and Vegetables Ingredients Market Share by Company, 2023
4.1.2. Product Offerings of Leading Fruits and Vegetables Ingredients Companies
4.2. Market Entropy
4.2.1. New Product Launches in the Industry
4.2.2. Mergers, Acquisitions, Joint ventures, and Partnerships
4.3. Key Strategies and Best Practices
Chapter 5. Global Market Projections: Best, Reference, and Low Case Scenarios
5.1. Growth Analysis- Case Scenario Definitions
5.2. Low Growth Case Scenario Forecasts
5.3. Reference Growth Case Scenario Forecasts
5.4. High Growth Case Scenario Forecasts
Chapter 6. Market Dynamics
6.1. Fruits and Vegetables Ingredients Market Drivers
6.2. Fruits and Vegetables Ingredients Market Challenges
6.6. Fruits and Vegetables Ingredients Market Opportunities
6.4. Fruits and Vegetables Ingredients Market Trends
Chapter 7. Global Fruits and Vegetables Ingredients Market Outlook Trends
7.1. Global Fruits and Vegetables Ingredients Revenue (USD Million) and CAGR (%) by Type (2021-2032)
7.2. Global Fruits and Vegetables Ingredients Revenue (USD Million) and CAGR (%) by Application (2021-2032)
7.3. Global Fruits and Vegetables Ingredients Revenue (USD Million) and CAGR (%) by Product (2021-2032)
By Ingredient
Fruits
Vegetables
By Form
Concentrates
Pastes and Purees
Pieces
Powders
NFC Juices
By Application
Beverages
Confectionary Products
Bakery Products
Soups and Sauces
Dairy Products
RTE Products
Chapter 8. Global Fruits and Vegetables Ingredients Regional Analysis and Outlook
8.1. Global Fruits and Vegetables Ingredients Revenue (USD Million) By Regions (2021- 2032)
8.2. North America Fruits and Vegetables Ingredients Revenue (USD Million) by Country (2021-2032)
8.2.1. United States Fruits and Vegetables Ingredients Regional Analysis and Outlook
8.2.2. Canada Fruits and Vegetables Ingredients Regional Analysis and Outlook
8.2.3. Mexico Fruits and Vegetables Ingredients Regional Analysis and Outlook
8.3. Europe Fruits and Vegetables Ingredients Revenue (USD Million), by Country (2021-2032)
8.3.1. Germany Fruits and Vegetables Ingredients Regional Analysis and Outlook
8.3.2. France Fruits and Vegetables Ingredients Regional Analysis and Outlook
8.3.3. United Kingdom Fruits and Vegetables Ingredients Regional Analysis and Outlook
8.3.4. Spain Fruits and Vegetables Ingredients Regional Analysis and Outlook
8.3.5. Italy Fruits and Vegetables Ingredients Regional Analysis and Outlook
8.3.6. Russia Fruits and Vegetables Ingredients Regional Analysis and Outlook
8.3.7. Rest of Europe Fruits and Vegetables Ingredients Regional Analysis and Outlook
8.4. Asia Pacific Fruits and Vegetables Ingredients Revenue (USD Million) by Country (2021-2032)
8.4.1. China Fruits and Vegetables Ingredients Regional Analysis and Outlook
8.4.2. Japan Fruits and Vegetables Ingredients Regional Analysis and Outlook
8.4.3. India Fruits and Vegetables Ingredients Regional Analysis and Outlook
8.4.4. South Korea Fruits and Vegetables Ingredients Regional Analysis and Outlook
8.4.5. Australia Fruits and Vegetables Ingredients Regional Analysis and Outlook
8.4.6. South East Asia Fruits and Vegetables Ingredients Regional Analysis and Outlook
8.4.7. Rest of Asia Pacific Fruits and Vegetables Ingredients Regional Analysis and Outlook
8.5. South America Fruits and Vegetables Ingredients Revenue (USD Million), by Country (2021-2032)
8.5.1. Brazil Fruits and Vegetables Ingredients Regional Analysis and Outlook
8.5.2. Argentina Fruits and Vegetables Ingredients Regional Analysis and Outlook
8.5.3. Rest of South America Fruits and Vegetables Ingredients Regional Analysis and Outlook
8.6. Middle East and Africa Fruits and Vegetables Ingredients Revenue (USD Million) by Country (2021-2032)
8.6.1. Middle East Fruits and Vegetables Ingredients Regional Analysis and Outlook
8.6.2. Africa Fruits and Vegetables Ingredients Regional Analysis and Outlook
Chapter 9. North America Fruits and Vegetables Ingredients Analysis and Outlook
9.1. North America Fruits and Vegetables Ingredients Revenue (USD Million) by Segments (2021-2032)
9.1.1. North America Fruits and Vegetables Ingredients Revenue (USD Million) by Type (2021-2032)
9.1.2. North America Fruits and Vegetables Ingredients Revenue (USD Million) by Application (2021-2032)
9.1.3. North America Fruits and Vegetables Ingredients Revenue (USD Million) by Product (2021-2032)
By Ingredient
Fruits
Vegetables
By Form
Concentrates
Pastes and Purees
Pieces
Powders
NFC Juices
By Application
Beverages
Confectionary Products
Bakery Products
Soups and Sauces
Dairy Products
RTE Products
Chapter 10. Europe Fruits and Vegetables Ingredients Analysis and Outlook
10.1. Europe Fruits and Vegetables Ingredients Revenue (USD Million), by Segments (USD Million) (2021-2032)
10.1.1. Europe Fruits and Vegetables Ingredients Revenue (USD Million) by Type (2021-2032)
10.1.2. Europe Fruits and Vegetables Ingredients Revenue (USD Million) by Application (2021-2032)
10.1.3. Europe Fruits and Vegetables Ingredients Revenue (USD Million) by Product (2021-2032)
By Ingredient
Fruits
Vegetables
By Form
Concentrates
Pastes and Purees
Pieces
Powders
NFC Juices
By Application
Beverages
Confectionary Products
Bakery Products
Soups and Sauces
Dairy Products
RTE Products
Chapter 11. Asia Pacific Fruits and Vegetables Ingredients Analysis and Outlook
11.1. Asia Pacific Fruits and Vegetables Ingredients Revenue (USD Million), and Revenue (USD Million) by Segments (2021-2032)
11.1.1. Asia Pacific Fruits and Vegetables Ingredients Revenue (USD Million) by Type (2021-2032)
11.1.2. Asia Pacific Fruits and Vegetables Ingredients Revenue (USD Million) by Application (2021-2032)
11.1.3. Asia Pacific Fruits and Vegetables Ingredients Revenue (USD Million) by Product (2021-2032)
By Ingredient
Fruits
Vegetables
By Form
Concentrates
Pastes and Purees
Pieces
Powders
NFC Juices
By Application
Beverages
Confectionary Products
Bakery Products
Soups and Sauces
Dairy Products
RTE Products
Chapter 12. South America Fruits and Vegetables Ingredients Analysis and Outlook
12.1. South America Fruits and Vegetables Ingredients Revenue (USD Million), by Segments (2021-2032)
12.1.1. South America Fruits and Vegetables Ingredients Revenue (USD Million) by Type (2021-2032)
12.1.2. South America Fruits and Vegetables Ingredients Revenue (USD Million) by Application (2021-2032)
12.1.3. South America Fruits and Vegetables Ingredients Revenue (USD Million) by Product (2021-2032)
By Ingredient
Fruits
Vegetables
By Form
Concentrates
Pastes and Purees
Pieces
Powders
NFC Juices
By Application
Beverages
Confectionary Products
Bakery Products
Soups and Sauces
Dairy Products
RTE Products
Chapter 13. Middle East and Africa Fruits and Vegetables Ingredients Analysis and Outlook
13.1. Middle East and Africa Fruits and Vegetables Ingredients Revenue (USD Million), by Segments (2021-2032)
13.1.1. Middle East and Africa Fruits and Vegetables Ingredients Revenue (USD Million) by Type (2021-2032)
13.1.2. Middle East and Africa Fruits and Vegetables Ingredients Revenue (USD Million) by Application (2021-2032)
13.1.3. Middle East and Africa Fruits and Vegetables Ingredients Revenue (USD Million) by Product (2021-2032)
By Ingredient
Fruits
Vegetables
By Form
Concentrates
Pastes and Purees
Pieces
Powders
NFC Juices
By Application
Beverages
Confectionary Products
Bakery Products
Soups and Sauces
Dairy Products
RTE Products
Chapter 14. Fruits and Vegetables Ingredients Company Profiles
14.1 Business Overview
14.2 Product Profiles
14.3 SWOT Profiles
14.5 Recent Developments
14.6 Financial Profile
List of Companies
AGRANA Beteiligungs AG
Cooperatie Koninklijke Cosun UA
Diana Food SAS
Dohler GmbH
European Freeze Dry
Grunewald International
Ingredion Inc
International Flavors and Fragrances
Kanegrade Ltd
Kerry Group Plc
Lupa Foods Ltd
Olam Group Ltd
Sensient Technologies Corp
SunOpta Inc
Tate & Lyle Plc
The Scoular Co.
Yaax International Inc
15. Methodology and Data Sources
15.1 Customization Offerings
15.2 Subscription Services
15.3 Related Reports
15.4 Publisher Expertise
LIST OF TABLES
Table 1 Market Segmentation Analysis
Table 2 Global Fruits and Vegetables Ingredients Market Share of Leading Companies, 2023
Table 3 Product Offerings of Leading Companies
Table 4 Low Growth Scenario Forecasts
Table 5 Reference Case Growth Scenario
Table 6 High Growth Case Scenario
Table 7 Global Fruits and Vegetables Ingredients Revenue (USD Million) And CAGR (%) By Type (2021-2032)
Table 8 Global Fruits and Vegetables Ingredients Revenue (USD Million) And CAGR (%) By Application (2021-2032)
Table 9 Global Fruits and Vegetables Ingredients Revenue (USD Million) And CAGR (%) By Product (2021-2032)
Table 10 Global Fruits and Vegetables Ingredients Market Revenue (USD Million) By Regions (2021-2032)
Table 11 Global Fruits and Vegetables Ingredients Market Share (%) By Regions (2021-2032)
Table 12 North America Fruits and Vegetables Ingredients Revenue (USD Million) By Country (2021-2032)
Table 13 Europe Fruits and Vegetables Ingredients Revenue (USD Million) By Country (2021-2032)
Table 14 Asia Pacific Fruits and Vegetables Ingredients Revenue (USD Million) By Country (2021-2032)
Table 15 South America Fruits and Vegetables Ingredients Revenue (USD Million) By Country (2021-2032)
Table 16 Middle East and Africa Fruits and Vegetables Ingredients Revenue (USD Million) By Region (2021-2032)
Table 17 North America Fruits and Vegetables Ingredients Revenue (USD Million) By Type (2021-2032)
Table 18 North America Fruits and Vegetables Ingredients Revenue (USD Million) By Application (2021-2032)
Table 19 North America Fruits and Vegetables Ingredients Revenue (USD Million) By Product (2021-2032)
Table 20 Europe Fruits and Vegetables Ingredients Revenue (USD Million) By Type (2021-2032)
Table 21 Europe Fruits and Vegetables Ingredients Revenue (USD Million) By Application (2021-2032)
Table 22 Europe Fruits and Vegetables Ingredients Revenue (USD Million) By Product (2021-2032)
Table 23 Asia Pacific Fruits and Vegetables Ingredients Revenue (USD Million) By Type (2021-2032)
Table 24 Asia Pacific Fruits and Vegetables Ingredients Revenue (USD Million) By Application (2021-2032)
Table 25 Asia Pacific Fruits and Vegetables Ingredients Revenue (USD Million) By Product (2021-2032)
Table 26 South America Fruits and Vegetables Ingredients Revenue (USD Million) By Type (2021-2032)
Table 27 South America Fruits and Vegetables Ingredients Revenue (USD Million) By Application (2021-2032)
Table 28 South America Fruits and Vegetables Ingredients Revenue (USD Million) By Product (2021-2032)
Table 29 Middle East and Africa Fruits and Vegetables Ingredients Revenue (USD Million) By Type (2021-2032)
Table 30 Middle East and Africa Fruits and Vegetables Ingredients Revenue (USD Million) By Application (2021-2032)
Table 31 Middle East and Africa Fruits and Vegetables Ingredients Revenue (USD Million) By Product (2021-2032)
LIST OF FIGURES
Figure 1. Market Scope
Figure 2. Pricing Forecasts Per Unit, 2023- 2032
Figure 3. Porter’s Five Forces
Figure 4. Global Fruits and Vegetables Ingredients Market Revenue (USD Million) By Regions (2021-2032)
Figure 5. Global Fruits and Vegetables Ingredients Market Share (%) By Regions (2023)
Figure 6. North America Fruits and Vegetables Ingredients Revenue (USD Million) By Country (2021-2032)
Figure 7. United States Fruits and Vegetables Ingredients Revenue (USD Million) By Country (2021-2032)
Figure 8. Canada Fruits and Vegetables Ingredients Revenue (USD Million) By Country (2021-2032)
Figure 9. Mexico Fruits and Vegetables Ingredients Revenue (USD Million) By Country (2021-2032)
Figure 10. Europe Fruits and Vegetables Ingredients Revenue (USD Million) By Country (2021-2032)
Figure 11. Germany Fruits and Vegetables Ingredients Revenue (USD Million) By Country (2021-2032)
Figure 12. France Fruits and Vegetables Ingredients Revenue (USD Million) By Country (2021-2032)
Figure 13. United Kingdom Fruits and Vegetables Ingredients Revenue (USD Million) By Country (2021-2032)
Figure 14. Spain Fruits and Vegetables Ingredients Revenue (USD Million) By Country (2021-2032)
Figure 15. Italy Fruits and Vegetables Ingredients Revenue (USD Million) By Country (2021-2032)
Figure 16. Russia Fruits and Vegetables Ingredients Revenue (USD Million) By Country (2021-2032)
Figure 17. Rest of Europe Fruits and Vegetables Ingredients Revenue (USD Million) By Country (2021-2032)
Figure 11. Asia Pacific Fruits and Vegetables Ingredients Revenue (USD Million) By Country (2021-2032)
Figure 12. China Fruits and Vegetables Ingredients Revenue (USD Million) By Country (2021-2032)
Figure 13. Japan Fruits and Vegetables Ingredients Revenue (USD Million) By Country (2021-2032)
Figure 14. India Fruits and Vegetables Ingredients Revenue (USD Million) By Country (2021-2032)
Figure 15. South Korea Fruits and Vegetables Ingredients Revenue (USD Million) By Country (2021-2032)
Figure 16. Australia Fruits and Vegetables Ingredients Revenue (USD Million) By Country (2021-2032)
Figure 17. South East Asia Fruits and Vegetables Ingredients Revenue (USD Million) By Country (2021-2032)
Figure 18. South America Fruits and Vegetables Ingredients Revenue (USD Million) By Country (2021-2032)
Figure 19. Brazil Fruits and Vegetables Ingredients Revenue (USD Million) By Country (2021-2032)
Figure 20. Argentina Fruits and Vegetables Ingredients Revenue (USD Million) By Country (2021-2032)
Figure 21. Rest of Asia Pacific Fruits and Vegetables Ingredients Revenue (USD Million) By Country (2021-2032)
Figure 22. Middle East and Africa Fruits and Vegetables Ingredients Revenue (USD Million) By Region (2021-2032)
Figure 23. Saudi Arabia Fruits and Vegetables Ingredients Revenue (USD Million) By Region (2021-2032)
Figure 24. The UAE Fruits and Vegetables Ingredients Revenue (USD Million) By Region (2021-2032)
Figure 25. Rest of Middle East Fruits and Vegetables Ingredients Revenue (USD Million) By Region (2021-2032)
Figure 26. South Africa Fruits and Vegetables Ingredients Revenue (USD Million) By Region (2021-2032)
Figure 27. Africa Fruits and Vegetables Ingredients Revenue (USD Million) By Region (2021-2032)
Figure 28. North America Fruits and Vegetables Ingredients Revenue (USD Million) By Type (2021-2032)
Figure 29. North America Fruits and Vegetables Ingredients Revenue (USD Million) By Application (2021-2032)
Figure 30. North America Fruits and Vegetables Ingredients Revenue (USD Million) By Product (2021-2032)
Figure 31. Europe Fruits and Vegetables Ingredients Revenue (USD Million) By Type (2021-2032)
Figure 32. Europe Fruits and Vegetables Ingredients Revenue (USD Million) By Application (2021-2032)
Figure 33. Europe Fruits and Vegetables Ingredients Revenue (USD Million) By Product (2021-2032)
Figure 34. Asia Pacific Fruits and Vegetables Ingredients Revenue (USD Million) By Type (2021-2032)
Figure 35. Asia Pacific Fruits and Vegetables Ingredients Revenue (USD Million) By Application (2021-2032)
Figure 36. Asia Pacific Fruits and Vegetables Ingredients Revenue (USD Million) By Product (2021-2032)
Figure 37. South America Fruits and Vegetables Ingredients Revenue (USD Million) By Type (2021-2032)
Figure 38. South America Fruits and Vegetables Ingredients Revenue (USD Million) By Application (2021-2032)
Figure 39. South America Fruits and Vegetables Ingredients Revenue (USD Million) By Product (2021-2032)
Figure 40. Middle East and Africa Fruits and Vegetables Ingredients Revenue (USD Million) By Type (2021-2032)
Figure 41. Middle East and Africa Fruits and Vegetables Ingredients Revenue (USD Million) By Application (2021-2032)
Figure 42. Middle East and Africa Fruits and Vegetables Ingredients Revenue (USD Million) By Product (2021-2032)
By Ingredient
Fruits
Vegetables
By Form
Concentrates
Pastes and Purees
Pieces
Powders
NFC Juices
By Application
Beverages
Confectionary Products
Bakery Products
Soups and Sauces
Dairy Products
RTE Products
Countries Analyzed
North America (US, Canada, Mexico)
Europe (Germany, UK, France, Spain, Italy, Russia, Rest of Europe)
Asia Pacific (China, India, Japan, South Korea, Australia, South East Asia, Rest of Asia)
South America (Brazil, Argentina, Rest of South America)
Middle East and Africa (Saudi Arabia, UAE, Rest of Middle East, South Africa, Egypt, Rest of Africa)
