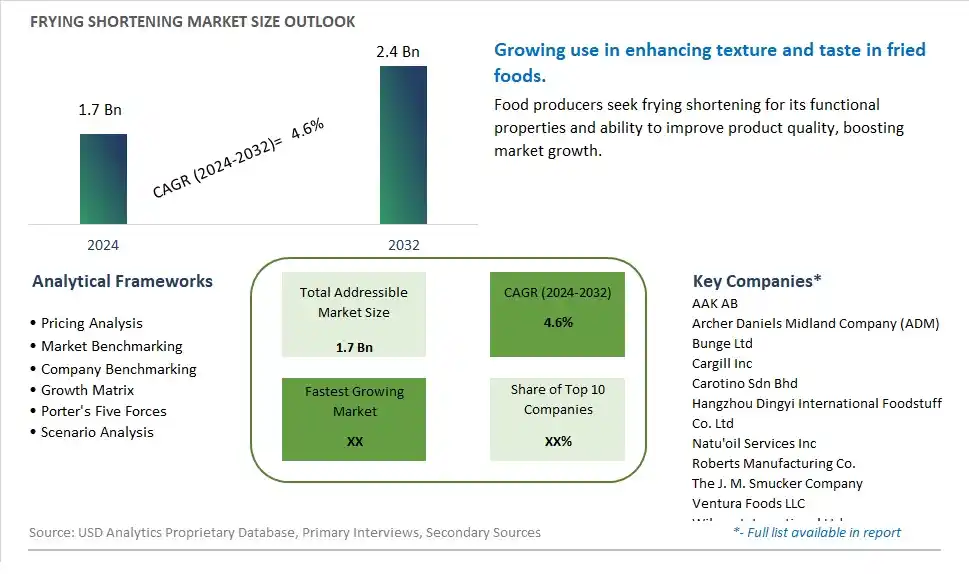
Global Frying Shortening Market Size is valued at $1.7 Billion in 2024 and is forecast to register a growth rate (CAGR) of 4.6% to reach $2.4 Billion by 2032.
The global Frying Shortening Market Comprehensive Study analyzes and forecasts the market size across 6 regions and 24 countries for diverse segments -By Type (Organic, Conventional), By Form (Powder, Block), By Source (Palm, Soybean, Sunflower seeds, Maize, Castor, Groundnut, Coconut, Others), By End-User (Confectionary Industry, Bakery Products, Dairy Products, Processed Food, Dietary supplements, Others)
An Introduction to Frying Shortening Market
In 2024, the Frying Shortening market is witnessing significant growth, driven by the rising demand for high-performance fats and oils in the foodservice and food processing industries. Frying shortening, known for its stability and ability to enhance the texture and flavor of fried foods, is essential in both commercial and home kitchens. The market benefits from advancements in fat processing and formulation technologies, the growing trend of convenience foods, and the expansion of the global fast food and snack sectors. Additionally, the increasing focus on healthier shortening options with lower trans fats is contributing to market growth.
Frying Shortening Competitive Landscape
The market report analyses the leading companies in the industry including AAK AB, Archer Daniels Midland Company (ADM), Bunge Ltd, Cargill Inc, Carotino Sdn Bhd, Hangzhou Dingyi International Foodstuff Co. Ltd, Natu'oil Services Inc, Roberts Manufacturing Co., The J. M. Smucker Company, Ventura Foods LLC, Wilmar International Ltd, and Others.
Frying Shortening Market Dynamics
Frying Shortening Market Trend: Increasing Demand for Healthier and Functional Frying Oils
The most prominent trend in the Frying Shortening Market is the increasing demand for healthier and functional frying oils. As consumers seek to reduce unhealthy fats and improve the nutritional quality of their diets, frying shortening products that offer health benefits are gaining popularity. This trend is driven by the growing interest in functional foods and the desire for oils that support heart health and overall wellness.
Frying Shortening Market Driver: Growth in Foodservice and Fast Food Industry
The key driver of the Frying Shortening Market is the growth in the foodservice and fast food industry. As more consumers dine out and seek quick meal solutions, there is a higher demand for frying shortenings that provide consistent frying performance and improve the taste and texture of fried foods. This driver is supported by the expansion of fast food chains and the introduction of new fried food products, driving market growth for frying shortenings.
Frying Shortening Market Opportunity: Development of Specialty and Functional Frying Shortenings
A significant opportunity in the Frying Shortening Market lies in the development of specialty and functional frying shortenings. By creating products that cater to specific dietary needs, such as trans-fat-free, high-oleic, or enriched with omega-3 fatty acids, companies can attract health-conscious consumers. Offering innovative frying shortenings that provide both culinary and health benefits can help expand market reach and increase consumer satisfaction, driving growth in the specialty oil segment.
Frying Shortening Market Share Analysis: Bakery Products is the fastest growing segment over the forecast period to 2032
The Bakery Products segment is the fastest-growing within the Frying Shortening Market by end-user, projected to experience significant growth up to 2032. This rapid expansion is driven by the increasing consumer demand for bakery items such as cakes, pastries, bread, and cookies. Frying shortening plays a crucial role in the bakery industry by enhancing the texture, volume, and shelf life of baked goods. The rise of artisanal bakeries and the growing trend of home baking have further fueled the demand for high-quality shortening products. Additionally, the shift towards healthier and more sustainable ingredients has led manufacturers to innovate and offer shortenings that cater to these preferences, such as non-hydrogenated and trans-fat-free options. The convenience and versatility of frying shortening in baking applications, combined with the rising consumption of baked goods globally, contribute to the robust growth of this segment. As the bakery industry continues to expand and evolve, the demand for specialized frying shortening products is expected to increase, solidifying the bakery products segment as the fastest-growing end-user in the frying shortening market.
Frying Shortening Market Share Analysis: Conventional segment generated the highest revenue share in the industry
Conventional frying shortening is the largest segment within the Frying Shortening Market by type. This segment's dominance is attributed to its widespread availability, cost-effectiveness, and established use in various culinary and industrial applications. Conventional shortening, made from hydrogenated vegetable oils, provides the necessary stability and performance required for high-temperature frying, making it a staple in commercial kitchens and food processing facilities. Its consistent quality and reliable performance ensure that it remains a preferred choice for frying applications. The extensive use of conventional shortening in fast food chains, restaurants, and food manufacturing further solidifies its leading position in the market. Despite the growing interest in organic and healthier alternatives, conventional frying shortening continues to hold a significant market share due to its affordability and proven effectiveness in producing crispy and flavorful fried foods.
Frying Shortening Market Share Analysis: Palm is the fastest growing segment over the forecast period to 2032
Palm is the largest segment within the Frying Shortening Market by source. This segment's prominence is due to the high yield and versatility of palm oil, which makes it an economically viable and widely used ingredient in the production of frying shortening. Palm oil's stability at high temperatures and its neutral flavor make it an ideal choice for frying a variety of foods. Additionally, palm oil is rich in saturated and unsaturated fats, providing the desired texture and mouthfeel in fried products. The extensive cultivation and production of palm oil in tropical regions, coupled with its cost-effectiveness, contribute to its dominant market position. Despite concerns regarding sustainability and environmental impact, palm oil remains the preferred source for frying shortening due to its functional properties and widespread availability.
Frying Shortening Market Share Analysis: Palm segment generated the highest revenue share in the industry
Palm is the largest segment within the Frying Shortening Market by source. This segment's dominance is attributed to the widespread use and high yield of palm oil, making it an economically viable choice for frying shortening production. Palm oil is favored for its stability at high temperatures, neutral flavor, and rich content of saturated and unsaturated fats, which contribute to the desired texture and mouthfeel in fried products. The extensive cultivation of palm oil in tropical regions and its cost-effectiveness further enhance its market position. Despite environmental concerns, palm oil remains the preferred source for frying shortening due to its functional properties and availability.
Frying Shortening Market Share Analysis: Bakery Products is the fastest growing segment over the forecast period to 2032
The Bakery Products segment is the fastest-growing within the Frying Shortening Market by end-user, projected to experience significant growth up to 2032. This growth is driven by the increasing consumer demand for various bakery items such as cakes, pastries, bread, and cookies. Frying shortening is essential in the bakery industry for enhancing the texture, volume, and shelf life of baked goods. The rise of artisanal bakeries and the trend of home baking have further boosted the demand for high-quality shortening products. Additionally, the shift towards healthier and sustainable ingredients has led to innovations in frying shortening, such as non-hydrogenated and trans-fat-free options. The convenience and versatility of frying shortening in baking applications, along with the global increase in baked goods consumption, contribute to the robust growth of this segment. As the bakery industry continues to expand, the demand for specialized frying shortening products is expected to rise, making the bakery products segment the fastest-growing end-user in the frying shortening market.
Frying Shortening Market Segmentation
By Type
Organic
Conventional
By Form
Powder
Block
By Source
Palm
Soybean
Sunflower seeds
Maize
Castor
Groundnut
Coconut
Others
By End-User
Confectionary Industry
Bakery Products
Dairy Products
Processed Food
Dietary supplements
Others
Countries Analyzed
North America (US, Canada, Mexico)
Europe (Germany, UK, France, Spain, Italy, Russia, Rest of Europe)
Asia Pacific (China, India, Japan, South Korea, Australia, South East Asia, Rest of Asia)
South America (Brazil, Argentina, Rest of South America)
Middle East and Africa (Saudi Arabia, UAE, Rest of Middle East, South Africa, Egypt, Rest of Africa)
Frying Shortening Companies Profiled in the Study
AAK AB
Archer Daniels Midland Company (ADM)
Bunge Ltd
Cargill Inc
Carotino Sdn Bhd
Hangzhou Dingyi International Foodstuff Co. Ltd
Natu'oil Services Inc
Roberts Manufacturing Co.
The J. M. Smucker Company
Ventura Foods LLC
Wilmar International Ltd
*- List Not Exhaustive
Chapter 1. TABLE OF CONTENTS
Chapter 2. Introduction to Frying Shortening Market
2.1. Market Overview
2.2. Key Statistics and Report Highlights
2.3. Scope of the Comprehensive Study
2.3.1. Market Definition
2.3.2 Countries and Regions Covered
2.3.3 Research Objective
2.3.4 Units, Currency, and Conversions
2.3.5 Industry Value Chain
2.4. Key Market Segments
2.5. Key Companies
2.6. Study Period
Chapter 3. Strategic Analysis Review
3.1. Frying Shortening Pricing Analysis and Forecast
3.2. Porter’s Five Forces
3.3. Market Ecosystem
3.4. SWOT Analysis
3.5. Regulatory Scenario
3.3. Effects of Inflation, Russia-Ukraine War, moderating economic growth, and other macroeconomic factors
Chapter 4. Competitive Landscape
4.1. Market Share Analysis
4.1.1. Global Frying Shortening Market Share by Company, 2023
4.1.2. Product Offerings of Leading Frying Shortening Companies
4.2. Market Entropy
4.2.1. New Product Launches in the Industry
4.2.2. Mergers, Acquisitions, Joint ventures, and Partnerships
4.3. Key Strategies and Best Practices
Chapter 5. Global Market Projections: Best, Reference, and Low Case Scenarios
5.1. Growth Analysis- Case Scenario Definitions
5.2. Low Growth Case Scenario Forecasts
5.3. Reference Growth Case Scenario Forecasts
5.4. High Growth Case Scenario Forecasts
Chapter 6. Market Dynamics
6.1. Frying Shortening Market Drivers
6.2. Frying Shortening Market Challenges
6.6. Frying Shortening Market Opportunities
6.4. Frying Shortening Market Trends
Chapter 7. Global Frying Shortening Market Outlook Trends
7.1. Global Frying Shortening Revenue (USD Million) and CAGR (%) by Type (2021-2032)
7.2. Global Frying Shortening Revenue (USD Million) and CAGR (%) by Application (2021-2032)
7.3. Global Frying Shortening Revenue (USD Million) and CAGR (%) by Product (2021-2032)
By Type
Organic
Conventional
By Form
Powder
Block
By Source
Palm
Soybean
Sunflower seeds
Maize
Castor
Groundnut
Coconut
Others
By End-User
Confectionary Industry
Bakery Products
Dairy Products
Processed Food
Dietary supplements
Others
Chapter 8. Global Frying Shortening Regional Analysis and Outlook
8.1. Global Frying Shortening Revenue (USD Million) By Regions (2021- 2032)
8.2. North America Frying Shortening Revenue (USD Million) by Country (2021-2032)
8.2.1. United States Frying Shortening Regional Analysis and Outlook
8.2.2. Canada Frying Shortening Regional Analysis and Outlook
8.2.3. Mexico Frying Shortening Regional Analysis and Outlook
8.3. Europe Frying Shortening Revenue (USD Million), by Country (2021-2032)
8.3.1. Germany Frying Shortening Regional Analysis and Outlook
8.3.2. France Frying Shortening Regional Analysis and Outlook
8.3.3. United Kingdom Frying Shortening Regional Analysis and Outlook
8.3.4. Spain Frying Shortening Regional Analysis and Outlook
8.3.5. Italy Frying Shortening Regional Analysis and Outlook
8.3.6. Russia Frying Shortening Regional Analysis and Outlook
8.3.7. Rest of Europe Frying Shortening Regional Analysis and Outlook
8.4. Asia Pacific Frying Shortening Revenue (USD Million) by Country (2021-2032)
8.4.1. China Frying Shortening Regional Analysis and Outlook
8.4.2. Japan Frying Shortening Regional Analysis and Outlook
8.4.3. India Frying Shortening Regional Analysis and Outlook
8.4.4. South Korea Frying Shortening Regional Analysis and Outlook
8.4.5. Australia Frying Shortening Regional Analysis and Outlook
8.4.6. South East Asia Frying Shortening Regional Analysis and Outlook
8.4.7. Rest of Asia Pacific Frying Shortening Regional Analysis and Outlook
8.5. South America Frying Shortening Revenue (USD Million), by Country (2021-2032)
8.5.1. Brazil Frying Shortening Regional Analysis and Outlook
8.5.2. Argentina Frying Shortening Regional Analysis and Outlook
8.5.3. Rest of South America Frying Shortening Regional Analysis and Outlook
8.6. Middle East and Africa Frying Shortening Revenue (USD Million) by Country (2021-2032)
8.6.1. Middle East Frying Shortening Regional Analysis and Outlook
8.6.2. Africa Frying Shortening Regional Analysis and Outlook
Chapter 9. North America Frying Shortening Analysis and Outlook
9.1. North America Frying Shortening Revenue (USD Million) by Segments (2021-2032)
9.1.1. North America Frying Shortening Revenue (USD Million) by Type (2021-2032)
9.1.2. North America Frying Shortening Revenue (USD Million) by Application (2021-2032)
9.1.3. North America Frying Shortening Revenue (USD Million) by Product (2021-2032)
By Type
Organic
Conventional
By Form
Powder
Block
By Source
Palm
Soybean
Sunflower seeds
Maize
Castor
Groundnut
Coconut
Others
By End-User
Confectionary Industry
Bakery Products
Dairy Products
Processed Food
Dietary supplements
Others
Chapter 10. Europe Frying Shortening Analysis and Outlook
10.1. Europe Frying Shortening Revenue (USD Million), by Segments (USD Million) (2021-2032)
10.1.1. Europe Frying Shortening Revenue (USD Million) by Type (2021-2032)
10.1.2. Europe Frying Shortening Revenue (USD Million) by Application (2021-2032)
10.1.3. Europe Frying Shortening Revenue (USD Million) by Product (2021-2032)
By Type
Organic
Conventional
By Form
Powder
Block
By Source
Palm
Soybean
Sunflower seeds
Maize
Castor
Groundnut
Coconut
Others
By End-User
Confectionary Industry
Bakery Products
Dairy Products
Processed Food
Dietary supplements
Others
Chapter 11. Asia Pacific Frying Shortening Analysis and Outlook
11.1. Asia Pacific Frying Shortening Revenue (USD Million), and Revenue (USD Million) by Segments (2021-2032)
11.1.1. Asia Pacific Frying Shortening Revenue (USD Million) by Type (2021-2032)
11.1.2. Asia Pacific Frying Shortening Revenue (USD Million) by Application (2021-2032)
11.1.3. Asia Pacific Frying Shortening Revenue (USD Million) by Product (2021-2032)
By Type
Organic
Conventional
By Form
Powder
Block
By Source
Palm
Soybean
Sunflower seeds
Maize
Castor
Groundnut
Coconut
Others
By End-User
Confectionary Industry
Bakery Products
Dairy Products
Processed Food
Dietary supplements
Others
Chapter 12. South America Frying Shortening Analysis and Outlook
12.1. South America Frying Shortening Revenue (USD Million), by Segments (2021-2032)
12.1.1. South America Frying Shortening Revenue (USD Million) by Type (2021-2032)
12.1.2. South America Frying Shortening Revenue (USD Million) by Application (2021-2032)
12.1.3. South America Frying Shortening Revenue (USD Million) by Product (2021-2032)
By Type
Organic
Conventional
By Form
Powder
Block
By Source
Palm
Soybean
Sunflower seeds
Maize
Castor
Groundnut
Coconut
Others
By End-User
Confectionary Industry
Bakery Products
Dairy Products
Processed Food
Dietary supplements
Others
Chapter 13. Middle East and Africa Frying Shortening Analysis and Outlook
13.1. Middle East and Africa Frying Shortening Revenue (USD Million), by Segments (2021-2032)
13.1.1. Middle East and Africa Frying Shortening Revenue (USD Million) by Type (2021-2032)
13.1.2. Middle East and Africa Frying Shortening Revenue (USD Million) by Application (2021-2032)
13.1.3. Middle East and Africa Frying Shortening Revenue (USD Million) by Product (2021-2032)
By Type
Organic
Conventional
By Form
Powder
Block
By Source
Palm
Soybean
Sunflower seeds
Maize
Castor
Groundnut
Coconut
Others
By End-User
Confectionary Industry
Bakery Products
Dairy Products
Processed Food
Dietary supplements
Others
Chapter 14. Frying Shortening Company Profiles
14.1 Business Overview
14.2 Product Profiles
14.3 SWOT Profiles
14.5 Recent Developments
14.6 Financial Profile
List of Companies
AAK AB
Archer Daniels Midland Company (ADM)
Bunge Ltd
Cargill Inc
Carotino Sdn Bhd
Hangzhou Dingyi International Foodstuff Co. Ltd
Natu'oil Services Inc
Roberts Manufacturing Co.
The J. M. Smucker Company
Ventura Foods LLC
Wilmar International Ltd
15. Methodology and Data Sources
15.1 Customization Offerings
15.2 Subscription Services
15.3 Related Reports
15.4 Publisher Expertise
LIST OF TABLES
Table 1 Market Segmentation Analysis
Table 2 Global Frying Shortening Market Share of Leading Companies, 2023
Table 3 Product Offerings of Leading Companies
Table 4 Low Growth Scenario Forecasts
Table 5 Reference Case Growth Scenario
Table 6 High Growth Case Scenario
Table 7 Global Frying Shortening Revenue (USD Million) And CAGR (%) By Type (2021-2032)
Table 8 Global Frying Shortening Revenue (USD Million) And CAGR (%) By Application (2021-2032)
Table 9 Global Frying Shortening Revenue (USD Million) And CAGR (%) By Product (2021-2032)
Table 10 Global Frying Shortening Market Revenue (USD Million) By Regions (2021-2032)
Table 11 Global Frying Shortening Market Share (%) By Regions (2021-2032)
Table 12 North America Frying Shortening Revenue (USD Million) By Country (2021-2032)
Table 13 Europe Frying Shortening Revenue (USD Million) By Country (2021-2032)
Table 14 Asia Pacific Frying Shortening Revenue (USD Million) By Country (2021-2032)
Table 15 South America Frying Shortening Revenue (USD Million) By Country (2021-2032)
Table 16 Middle East and Africa Frying Shortening Revenue (USD Million) By Region (2021-2032)
Table 17 North America Frying Shortening Revenue (USD Million) By Type (2021-2032)
Table 18 North America Frying Shortening Revenue (USD Million) By Application (2021-2032)
Table 19 North America Frying Shortening Revenue (USD Million) By Product (2021-2032)
Table 20 Europe Frying Shortening Revenue (USD Million) By Type (2021-2032)
Table 21 Europe Frying Shortening Revenue (USD Million) By Application (2021-2032)
Table 22 Europe Frying Shortening Revenue (USD Million) By Product (2021-2032)
Table 23 Asia Pacific Frying Shortening Revenue (USD Million) By Type (2021-2032)
Table 24 Asia Pacific Frying Shortening Revenue (USD Million) By Application (2021-2032)
Table 25 Asia Pacific Frying Shortening Revenue (USD Million) By Product (2021-2032)
Table 26 South America Frying Shortening Revenue (USD Million) By Type (2021-2032)
Table 27 South America Frying Shortening Revenue (USD Million) By Application (2021-2032)
Table 28 South America Frying Shortening Revenue (USD Million) By Product (2021-2032)
Table 29 Middle East and Africa Frying Shortening Revenue (USD Million) By Type (2021-2032)
Table 30 Middle East and Africa Frying Shortening Revenue (USD Million) By Application (2021-2032)
Table 31 Middle East and Africa Frying Shortening Revenue (USD Million) By Product (2021-2032)
LIST OF FIGURES
Figure 1. Market Scope
Figure 2. Pricing Forecasts Per Unit, 2023- 2032
Figure 3. Porter’s Five Forces
Figure 4. Global Frying Shortening Market Revenue (USD Million) By Regions (2021-2032)
Figure 5. Global Frying Shortening Market Share (%) By Regions (2023)
Figure 6. North America Frying Shortening Revenue (USD Million) By Country (2021-2032)
Figure 7. United States Frying Shortening Revenue (USD Million) By Country (2021-2032)
Figure 8. Canada Frying Shortening Revenue (USD Million) By Country (2021-2032)
Figure 9. Mexico Frying Shortening Revenue (USD Million) By Country (2021-2032)
Figure 10. Europe Frying Shortening Revenue (USD Million) By Country (2021-2032)
Figure 11. Germany Frying Shortening Revenue (USD Million) By Country (2021-2032)
Figure 12. France Frying Shortening Revenue (USD Million) By Country (2021-2032)
Figure 13. United Kingdom Frying Shortening Revenue (USD Million) By Country (2021-2032)
Figure 14. Spain Frying Shortening Revenue (USD Million) By Country (2021-2032)
Figure 15. Italy Frying Shortening Revenue (USD Million) By Country (2021-2032)
Figure 16. Russia Frying Shortening Revenue (USD Million) By Country (2021-2032)
Figure 17. Rest of Europe Frying Shortening Revenue (USD Million) By Country (2021-2032)
Figure 11. Asia Pacific Frying Shortening Revenue (USD Million) By Country (2021-2032)
Figure 12. China Frying Shortening Revenue (USD Million) By Country (2021-2032)
Figure 13. Japan Frying Shortening Revenue (USD Million) By Country (2021-2032)
Figure 14. India Frying Shortening Revenue (USD Million) By Country (2021-2032)
Figure 15. South Korea Frying Shortening Revenue (USD Million) By Country (2021-2032)
Figure 16. Australia Frying Shortening Revenue (USD Million) By Country (2021-2032)
Figure 17. South East Asia Frying Shortening Revenue (USD Million) By Country (2021-2032)
Figure 18. South America Frying Shortening Revenue (USD Million) By Country (2021-2032)
Figure 19. Brazil Frying Shortening Revenue (USD Million) By Country (2021-2032)
Figure 20. Argentina Frying Shortening Revenue (USD Million) By Country (2021-2032)
Figure 21. Rest of Asia Pacific Frying Shortening Revenue (USD Million) By Country (2021-2032)
Figure 22. Middle East and Africa Frying Shortening Revenue (USD Million) By Region (2021-2032)
Figure 23. Saudi Arabia Frying Shortening Revenue (USD Million) By Region (2021-2032)
Figure 24. The UAE Frying Shortening Revenue (USD Million) By Region (2021-2032)
Figure 25. Rest of Middle East Frying Shortening Revenue (USD Million) By Region (2021-2032)
Figure 26. South Africa Frying Shortening Revenue (USD Million) By Region (2021-2032)
Figure 27. Africa Frying Shortening Revenue (USD Million) By Region (2021-2032)
Figure 28. North America Frying Shortening Revenue (USD Million) By Type (2021-2032)
Figure 29. North America Frying Shortening Revenue (USD Million) By Application (2021-2032)
Figure 30. North America Frying Shortening Revenue (USD Million) By Product (2021-2032)
Figure 31. Europe Frying Shortening Revenue (USD Million) By Type (2021-2032)
Figure 32. Europe Frying Shortening Revenue (USD Million) By Application (2021-2032)
Figure 33. Europe Frying Shortening Revenue (USD Million) By Product (2021-2032)
Figure 34. Asia Pacific Frying Shortening Revenue (USD Million) By Type (2021-2032)
Figure 35. Asia Pacific Frying Shortening Revenue (USD Million) By Application (2021-2032)
Figure 36. Asia Pacific Frying Shortening Revenue (USD Million) By Product (2021-2032)
Figure 37. South America Frying Shortening Revenue (USD Million) By Type (2021-2032)
Figure 38. South America Frying Shortening Revenue (USD Million) By Application (2021-2032)
Figure 39. South America Frying Shortening Revenue (USD Million) By Product (2021-2032)
Figure 40. Middle East and Africa Frying Shortening Revenue (USD Million) By Type (2021-2032)
Figure 41. Middle East and Africa Frying Shortening Revenue (USD Million) By Application (2021-2032)
Figure 42. Middle East and Africa Frying Shortening Revenue (USD Million) By Product (2021-2032)
By Type
Organic
Conventional
By Form
Powder
Block
By Source
Palm
Soybean
Sunflower seeds
Maize
Castor
Groundnut
Coconut
Others
By End-User
Confectionary Industry
Bakery Products
Dairy Products
Processed Food
Dietary supplements
Others
Countries Analyzed
North America (US, Canada, Mexico)
Europe (Germany, UK, France, Spain, Italy, Russia, Rest of Europe)
Asia Pacific (China, India, Japan, South Korea, Australia, South East Asia, Rest of Asia)
South America (Brazil, Argentina, Rest of South America)
Middle East and Africa (Saudi Arabia, UAE, Rest of Middle East, South Africa, Egypt, Rest of Africa)
