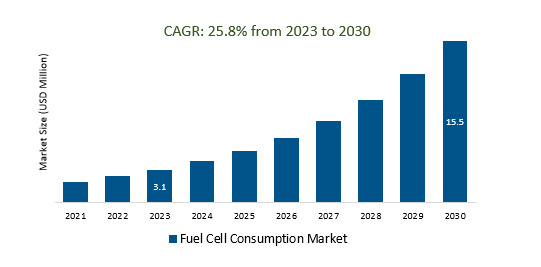
The Global Fuel Cell Consumption Market Size is estimated to be US 3.1 Billion in 2023 and is poised to register 25.8% growth over the forecast period from 2023 to 2030 to reach US $ 15.5 billion in 2030.
The market growth is driven by the Increasing emphasis on reducing greenhouse gas emissions and transitioning to cleaner energy sources is driving the adoption of fuel cells, as they produce electricity with minimal or zero emissions. Leading companies that are focused on Green Energy Transition, Transportation, Industrial Applications, Decentralized Energy, Hydrogen Infrastructure, Government Policies and Incentives, Emerging Markets, and others to boost market shares in the industry.
Market Overview
The Fuel Cell Consumption Market encompasses the global demand for fuel cell technology, which converts chemical energy into electricity and heat. Key segments include transportation, stationary power generation, and portable electronics, with various types of fuel cells. Market growth is driven by clean energy initiatives, transportation electrification, stationary power generation, and the emerging hydrogen economy, although challenges include high costs and the need for a robust hydrogen infrastructure.
Market Dynamics
Market Trends - Advancements in Fuel Cell Technology: Driving the Fuel Cell Consumption Market
Advancements in fuel cell technology are driving the Fuel Cell Consumption Market by enhancing efficiency, durability, and cost-effectiveness. Innovations in materials and designs, like advanced catalysts and solid oxide fuel cells, are improving performance, leading to longer-lasting and more reliable fuel cells. This progress positions fuel cells as crucial contributors to the clean energy transition across sectors, including transportation, stationary power generation, and portable electronics.
Market Driver- Increasing Hydrogen Infrastructure Demand Fuel Cell Consumption Market
The rising demand for hydrogen infrastructure is a key driver of growth in the Fuel Cell Consumption Market, supporting the adoption of fuel cell technology across various applications. Investments in hydrogen production, storage, and distribution networks are expanding, enabling easier access to hydrogen fuel for fuel cells in transportation, stationary power generation, and industrial applications, thus enhancing the market's potential for growth and deployment.
Market Opportunity-Introduction of Technological Innovation
Technological innovation is propelling the Fuel Cell Consumption Market by advancing materials, designs, and manufacturing processes, leading to increased efficiency, cost reduction, and broader applications for fuel cells. These innovations are pivotal in fuel cells' competitiveness and reliability, positioning them as crucial contributors to the clean energy transition in sectors like transportation, stationary power generation, and portable electronics.
Market Share Analysis- Solid Oxide Fuel Cell (SOFC) Fuel Cell Consumption Market will register the fastest growth
The Global Fuel Cell Consumption Market is analyzed across Phosphoric Acid Fuel Cells (PAFC), Proton Exchange Membrane Fuel Cells (PEMFC), Solid Oxide Fuel Cells (SOFC), Molten Carbonate Fuel Cells (MCFC), Alkaline Fuel Cells (AFC), and others. Solid Oxide Fuel Cells (SOFC) are poised to register the fastest growth. Solid Oxide Fuel Cells (SOFCs) are gaining traction in the Fuel Cell Consumption Market due to their high efficiency and ability to operate at high temperatures. They are particularly well-suited for stationary power generation and combined heat and power systems, making them a promising technology for converting natural gas or hydrogen into electricity efficiently while capturing waste heat for heating or cooling applications. SOFCs contribute significantly to the fuel cell market's growth and development.
Market Share Analysis- Cogeneration held a significant market share in 2023
The Global Fuel Cell Consumption Market is analyzed across various Applications including Power Generation, Cogeneration, and others. Of these, Cogeneration held a significant market share in 2023. Cogeneration, or combined heat and power (CHP), is a crucial application within the Fuel Cell Consumption Market, employing fuel cells to simultaneously produce electricity and capture waste heat for heating and cooling purposes. This approach enhances overall energy efficiency and is widely adopted in industrial, commercial, and residential settings to optimize energy use and reduce emissions.
Fuel Cell Consumption Market Segmentation
By Type
- Phosphoric Acid Fuel Cell (PAFC)
- Proton Exchange Membrane Fuel Cell (PEMFC)
- Solid Oxide Fuel Cell (SOFC)
- Molten Carbonate Fuel Cell (MCFC)
- Alkaline Fuel Cell (AFC)
By Application
- Power Generation
- Cogeneration
- Fuel Cell Electric Vehicles
- Portable Power Systems
- Others
By Region
- North America (United States, Canada, Mexico)
- Europe (Germany, France, United Kingdom, Spain, Italy, Others)
- Asia Pacific (China, India, Japan, South Korea, Australia, Others)
- Latin America (Brazil, Argentina, Others)
- Middle East and Africa (Saudi Arabia, UAE, Kuwait, Other Middle East, South Africa, Nigeria, Other Africa)
Fuel Cell Consumption Market Companies
- POSCO Energy Co. Ltd.
- Ceramic Fuel Cells Ltd
- Fuel Cell Energy Inc
- Hydrogenics Corporation
- Ballard Power System Inc
- AFC Energy PLC
- Bloom Energy
- Ceres Power Holdings PLC
- Panasonic Corporation
- Doosan Corporation
- Plug Power Inc
- Toshiba Fuel Cell Power Systems Corporation
- Horizon Fuel Cell Technologies Pte. Ltd.
- Quantum Fuel Systems Technologies Worldwide Inc
*List not exhaustive
Fuel Cell Consumption Market Outlook 2023
1 Market Overview
1.1 Introduction to the Fuel Cell Consumption Market
1.2 Scope of the Study
1.3 Research Objective
1.3.1 Key Market Scope and Segments
1.3.2 Players Covered
1.3.3 Years Considered
2 Executive Summary
2.1 2023 Fuel Cell Consumption - Market Statistics
3 Market Dynamics
3.1 Market Drivers
3.2 Market Challenges
3.3 Market Opportunities
3.4 Market Trends
4 Market Factor Analysis
4.1 Porter’s Five Forces
4.2 Market Entropy
4.2.1 Global Fuel Cell Consumption Market Companies with Area Served
4.2.2 Products Offerings Global Fuel Cell Consumption Market
5 COVID-19 Impact Analysis and Outlook Scenarios
5.1.1 Covid-19 Impact Analysis
5.1.2 post-COVID-19 Scenario- Low Growth Case
5.1.3 post-COVID-19 Scenario- Reference Growth Case
5.1.4 post-COVID-19 Scenario- Low Growth Case
6 Global Fuel Cell Consumption Market Trends
6.1 Global Fuel Cell Consumption Revenue (USD Million) and CAGR (%) by Type (2018-2030)
6.2 Global Fuel Cell Consumption Revenue (USD Million) and CAGR (%) by Applications (2018-2030)
6.3 Global Fuel Cell Consumption Revenue (USD Million) and CAGR (%) by regions (2018-2030)
7 Global Fuel Cell Consumption Market Revenue (USD Million) by Type, and Applications (2018-2022)
7.1 Global Fuel Cell Consumption Revenue (USD Million) by Type (2018-2022)
7.1.1 Global Fuel Cell Consumption Revenue (USD Million), Market Share (%) by Type (2018-2022)
7.2 Global Fuel Cell Consumption Revenue (USD Million) by Applications (2018-2022)
7.2.1 Global Fuel Cell Consumption Revenue (USD Million), Market Share (%) by Applications (2018-2022)
8 Global Fuel Cell Consumption Development Regional Status and Outlook
8.1 Global Fuel Cell Consumption Revenue (USD Million) By Regions (2018-2022)
8.2 North America Fuel Cell Consumption Revenue (USD Million) by Type, and Application (2018-2022)
8.2.1 North America Fuel Cell Consumption Revenue (USD Million) by Country (2018-2022)
8.2.2 North America Fuel Cell Consumption Revenue (USD Million) by Type (2018-2022)
8.2.3 North America Fuel Cell Consumption Revenue (USD Million) by Applications (2018-2022)
8.3 Europe Fuel Cell Consumption Revenue (USD Million), by Type, and Applications (USD Million) (2018-2022)
8.3.1 Europe Fuel Cell Consumption Revenue (USD Million), by Country (2018-2022)
8.3.2 Europe Fuel Cell Consumption Revenue (USD Million) by Type (2018-2022)
8.3.3 Europe Fuel Cell Consumption Revenue (USD Million) by Applications (2018-2022)
8.4 Asia Pacific Fuel Cell Consumption Revenue (USD Million), and Revenue (USD Million) by Type, and Applications (2018-2022)
8.4.1 Asia Pacific Fuel Cell Consumption Revenue (USD Million) by Country (2018-2022)
8.4.2 Asia Pacific Fuel Cell Consumption Revenue (USD Million) by Type (2018-2022)
8.4.3 Asia Pacific Fuel Cell Consumption Revenue (USD Million) by Applications (2018-2022)
8.5 South America Fuel Cell Consumption Revenue (USD Million), by Type, and Applications (2018-2022)
8.5.1 South America Fuel Cell Consumption Revenue (USD Million), by Country (2018-2022)
8.5.2 South America Fuel Cell Consumption Revenue (USD Million) by Type (2018-2022)
8.5.3 South America Fuel Cell Consumption Revenue (USD Million) by Applications (2018-2022)
8.6 Middle East and Africa Fuel Cell Consumption Revenue (USD Million), by Type, Technology, Application, Thickness (2018-2022)
8.6.1 Middle East and Africa Fuel Cell Consumption Revenue (USD Million) by Country (2018-2022)
8.6.2 Middle East and Africa Fuel Cell Consumption Revenue (USD Million) by Type (2018-2022)
8.6.3 Middle East and Africa Fuel Cell Consumption Revenue (USD Million) by Applications (2018-2022)
9 Company Profiles
10 Global Fuel Cell Consumption Market Revenue (USD Million), by Type, and Applications (2023-2030)
10.1 Global Fuel Cell Consumption Revenue (USD Million) and Market Share (%) by Type (2023-2030)
10.1.1 Global Fuel Cell Consumption Revenue (USD Million), and Market Share (%) by Type (2023-2030)
10.2 Global Fuel Cell Consumption Revenue (USD Million) and Market Share (%) by Applications (2023-2030)
10.2.1 Global Fuel Cell Consumption Revenue (USD Million), and Market Share (%) by Applications (2023-2030)
11 Global Fuel Cell Consumption Development Regional Status and Outlook Forecast
11.1 Global Fuel Cell Consumption Revenue (USD Million) By Regions (2023-2030)
11.2 North America Fuel Cell Consumption Revenue (USD Million) by Type, and Applications (2023-2030)
11.2.1 North America Fuel Cell Consumption Revenue (USD) Million by Country (2023-2030)
11.2.2 North America Fuel Cell Consumption Revenue (USD Million), by Type (2023-2030)
11.2.3 North America Fuel Cell Consumption Revenue (USD Million), Market Share (%) by Applications (2023-2030)
11.3 Europe Fuel Cell Consumption Revenue (USD Million), by Type, and Applications (2023-2030)
11.3.1 Europe Fuel Cell Consumption Revenue (USD Million), by Country (2023-2030)
11.3.2 Europe Fuel Cell Consumption Revenue (USD Million), by Type (2023-2030)
11.3.3 Europe Fuel Cell Consumption Revenue (USD Million), by Applications (2023-2030)
11.4 Asia Pacific Fuel Cell Consumption Revenue (USD Million) by Type, and Applications (2023-2030)
11.4.1 Asia Pacific Fuel Cell Consumption Revenue (USD Million), by Country (2023-2030)
11.4.2 Asia Pacific Fuel Cell Consumption Revenue (USD Million), by Type (2023-2030)
11.4.3 Asia Pacific Fuel Cell Consumption Revenue (USD Million), by Applications (2023-2030)
11.5 South America Fuel Cell Consumption Revenue (USD Million), by Type, and Applications (2023-2030)
11.5.1 South America Fuel Cell Consumption Revenue (USD Million), by Country (2023-2030)
11.5.2 South America Fuel Cell Consumption Revenue (USD Million), by Type (2023-2030)
11.5.3 South America Fuel Cell Consumption Revenue (USD Million), by Applications (2023-2030)
11.6 Middle East and Africa Fuel Cell Consumption Revenue (USD Million), by Type, and Applications (2023-2030)
11.6.1 Middle East and Africa Fuel Cell Consumption Revenue (USD Million), by region (2023-2030)
11.6.2 Middle East and Africa Fuel Cell Consumption Revenue (USD Million), by Type (2023-2030)
11.6.3 Middle East and Africa Fuel Cell Consumption Revenue (USD Million), by Applications (2023-2030)
12 Methodology and Data Sources
12.1 Methodology/Research Approach
12.1.1 Research Programs/Design
12.1.2 Market Size Estimation
12.1.3 Market Breakdown and Data Triangulation
12.2 Data Sources
12.2.1 Secondary Sources
12.2.2 Primary Sources
12.3 Disclaimer
List of Tables
Table 1 Market Segmentation Analysis
Table 2 Global Fuel Cell Consumption Market Companies with Areas Served
Table 3 Products Offerings Global Fuel Cell Consumption Market
Table 4 Low Growth Scenario Forecasts
Table 5 Reference Case Growth Scenario
Table 6 High Growth Case Scenario
Table 7 Global Fuel Cell Consumption Revenue (USD Million) And CAGR (%) By Type (2018-2030)
Table 8 Global Fuel Cell Consumption Revenue (USD Million) And CAGR (%) By Applications (2018-2030)
Table 9 Global Fuel Cell Consumption Revenue (USD Million) And CAGR (%) By Regions (2018-2030)
Table 10 Global Fuel Cell Consumption Revenue (USD Million) By Type (2018-2022)
Table 11 Global Fuel Cell Consumption Revenue Market Share (%) By Type (2018-2022)
Table 12 Global Fuel Cell Consumption Revenue (USD Million) By Applications (2018-2022)
Table 13 Global Fuel Cell Consumption Revenue Market Share (%) By Applications (2018-2022)
Table 14 Global Fuel Cell Consumption Market Revenue (USD Million) By Regions (2018-2022)
Table 15 Global Fuel Cell Consumption Market Share (%) By Regions (2018-2022)
Table 16 North America Fuel Cell Consumption Revenue (USD Million) By Country (2018-2022)
Table 17 North America Fuel Cell Consumption Revenue (USD Million) By Type (2018-2022)
Table 18 North America Fuel Cell Consumption Revenue (USD Million) By Applications (2018-2022)
Table 19 Europe Fuel Cell Consumption Revenue (USD Million) By Country (2018-2022)
Table 20 Europe Fuel Cell Consumption Revenue (USD Million) By Type (2018-2022)
Table 21 Europe Fuel Cell Consumption Revenue (USD Million) By Applications (2018-2022)
Table 22 Asia Pacific Fuel Cell Consumption Revenue (USD Million) By Country (2018-2022)
Table 23 Asia Pacific Fuel Cell Consumption Revenue (USD Million) By Type (2018-2022)
Table 24 Asia Pacific Fuel Cell Consumption Revenue (USD Million) By Applications (2018-2022)
Table 25 South America Fuel Cell Consumption Revenue (USD Million) By Country (2018-2022)
Table 26 South America Fuel Cell Consumption Revenue (USD Million) By Type (2018-2022)
Table 27 South America Fuel Cell Consumption Revenue (USD Million) By Applications (2018-2022)
Table 28 Middle East and Africa Fuel Cell Consumption Revenue (USD Million) By Region (2018-2022)
Table 29 Middle East and Africa Fuel Cell Consumption Revenue (USD Million) By Type (2018-2022)
Table 30 Middle East and Africa Fuel Cell Consumption Revenue (USD Million) By Applications (2018-2022)
Table 31 Financial Analysis
Table 32 Global Fuel Cell Consumption Revenue (USD Million) By Type (2023-2030)
Table 33 Global Fuel Cell Consumption Revenue Market Share (%) By Type (2023-2030)
Table 34 Global Fuel Cell Consumption Revenue (USD Million) By Applications (2023-2030)
Table 35 Global Fuel Cell Consumption Revenue Market Share (%) By Applications (2023-2030)
Table 36 Global Fuel Cell Consumption Market Revenue (USD Million), And Revenue (USD Million) By Regions (2023-2030)
Table 37 North America Fuel Cell Consumption Revenue (USD)By Country (2023-2030)
Table 38 North America Fuel Cell Consumption Revenue (USD Million) By Type (2023-2030)
Table 39 North America Fuel Cell Consumption Revenue (USD Million) By Applications (2023-2030)
Table 40 Europe Fuel Cell Consumption Revenue (USD Million) By Country (2023-2030)
Table 41 Europe Fuel Cell Consumption Revenue (USD Million) By Type (2023-2030)
Table 42 Europe Fuel Cell Consumption Revenue (USD Million) By Applications (2023-2030)
Table 43 Asia Pacific Fuel Cell Consumption Revenue (USD Million) By Country (2023-2030)
Table 44 Asia Pacific Fuel Cell Consumption Revenue (USD Million) By Type (2023-2030)
Table 45 Asia Pacific Fuel Cell Consumption Revenue (USD Million) By Applications (2023-2030)
Table 46 South America Fuel Cell Consumption Revenue (USD Million) By Country (2023-2030)
Table 47 South America Fuel Cell Consumption Revenue (USD Million) By Type (2023-2030)
Table 48 South America Fuel Cell Consumption Revenue (USD Million) By Applications (2023-2030)
Table 49 Middle East and Africa Fuel Cell Consumption Revenue (USD Million) By Region (2023-2030)
Table 50 Middle East and Africa Fuel Cell Consumption Revenue (USD Million) By Region (2023-2030)
Table 51 Middle East and Africa Fuel Cell Consumption Revenue (USD Million) By Type (2023-2030)
Table 52 Middle East and Africa Fuel Cell Consumption Revenue (USD Million) By Applications (2023-2030)
Table 53 Research Programs/Design for This Report
Table 54 Key Data Information from Secondary Sources
Table 55 Key Data Information from Primary Sources
List of Figures
Figure 1 Market Scope
Figure 2 Porter’s Five Forces
Figure 3 Global Fuel Cell Consumption Revenue (USD Million) By Type (2018-2022)
Figure 4 Global Fuel Cell Consumption Revenue Market Share (%) By Type (2022)
Figure 5 Global Fuel Cell Consumption Revenue (USD Million) By Applications (2018-2022)
Figure 6 Global Fuel Cell Consumption Revenue Market Share (%) By Applications (2022)
Figure 7 Global Fuel Cell Consumption Market Revenue (USD Million) By Regions (2018-2022)
Figure 8 Global Fuel Cell Consumption Market Share (%) By Regions (2022)
Figure 9 North America Fuel Cell Consumption Revenue (USD Million) By Country (2018-2022)
Figure 10 North America Fuel Cell Consumption Revenue (USD Million) By Type (2018-2022)
Figure 11 North America Fuel Cell Consumption Revenue (USD Million) By Applications (2018-2022)
Figure 12 Europe Fuel Cell Consumption Revenue (USD Million) By Country (2018-2022)
Figure 13 Europe Fuel Cell Consumption Revenue (USD Million) By Type (2018-2022)
Figure 14 Europe Fuel Cell Consumption Revenue (USD Million) By Applications (2018-2022)
Figure 15 Asia Pacific Fuel Cell Consumption Revenue (USD Million) By Country (2018-2022)
Figure 16 Asia Pacific Fuel Cell Consumption Revenue (USD Million) By Type (2018-2022)
Figure 17 Asia Pacific Fuel Cell Consumption Revenue (USD Million) By Applications (2018-2022)
Figure 18 South America Fuel Cell Consumption Revenue (USD Million) By Country (2018-2022)
Figure 19 South America Fuel Cell Consumption Revenue (USD Million) By Type (2018-2022)
Figure 20 South America Fuel Cell Consumption Revenue (USD Million) By Applications (2018-2022)
Figure 21 Middle East and Africa Fuel Cell Consumption Revenue (USD Million) By Region (2018-2022)
Figure 22 Middle East and Africa Fuel Cell Consumption Revenue (USD Million) By Type (2018-2022)
Figure 23 Middle East and Africa Fuel Cell Consumption Revenue (USD Million) By Applications (2018-2022)
Figure 24 Global Fuel Cell Consumption Revenue (USD Million) By Type (2023-2030)
Figure 25 Global Fuel Cell Consumption Revenue Market Share (%) By Type (2030)
Figure 26 Global Fuel Cell Consumption Revenue (USD Million) By Applications (2023-2030)
Figure 27 Global Fuel Cell Consumption Revenue Market Share (%) By Applications (2030)
Figure 28 Global Fuel Cell Consumption Market Revenue (USD Million) By Regions (2023-2030)
Figure 29 North America Fuel Cell Consumption Revenue (USD Million) By Country (2023-2030)
Figure 30 North America Fuel Cell Consumption Revenue (USD Million) By Type (2023-2030)
Figure 31 North America Fuel Cell Consumption Revenue (USD Million) By Applications (2023-2030)
Figure 32 Europe Fuel Cell Consumption Revenue (USD Million) By Country (2023-2030)
Figure 33 Europe Fuel Cell Consumption Revenue (USD Million) By Type (2023-2030)
Figure 34 Europe Fuel Cell Consumption Revenue (USD Million) By Applications (2023-2030)
Figure 35 Asia Pacific Fuel Cell Consumption Revenue (USD Million) By Country (2023-2030)
Figure 36 Asia Pacific Fuel Cell Consumption Revenue (USD Million) By Type (2023-2030)
Figure 37 Asia Pacific Fuel Cell Consumption Revenue (USD Million) By Applications (2023-2030)
Figure 38 South America Fuel Cell Consumption Revenue (USD Million) By Country (2023-2030)
Figure 39 South America Fuel Cell Consumption Revenue (USD Million) By Type (2023-2030)
Figure 40 South America Fuel Cell Consumption Revenue (USD Million) By Applications (2023-2030)
Figure 41 Middle East and Africa Fuel Cell Consumption Revenue (USD Million) By Region (2023-2030)
Figure 42 Middle East and Africa Fuel Cell Consumption Revenue (USD Million) By Region (2023-2030)
Figure 43 Middle East and Africa Fuel Cell Consumption Revenue (USD Million) By Type (2023-2030)
Figure 44 Middle East and Africa Fuel Cell Consumption Revenue (USD Million) By Applications (2023-2030)
Figure 45 Bottom-Up and Top-Down Approaches for This Report
Figure 46 Data Triangulation
