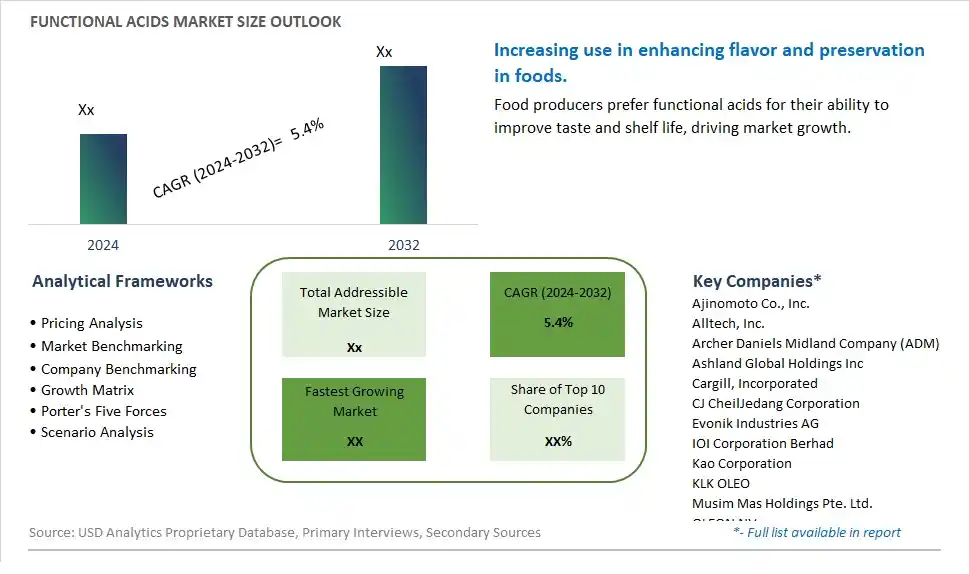
Global Functional Acids Market Size is valued at $XX Million in 2024 and is forecast to register a growth rate (CAGR) of 5.4% to reach $XX Million by 2032.
The global Functional Acids Market Comprehensive Study analyzes and forecasts the market size across 6 regions and 24 countries for diverse segments -By Type (Amino Acids, Fatty Acids, Others), By Application (Food & Beverage, Pharmaceutical, Cosmetic & Personal Care, Dietary Supplements, Others)
An Introduction to Functional Acids Market
The Functional Acids market in 2024 is thriving, fueled by the rising demand for natural and multifunctional ingredients in food and beverage products. Functional acids, such as citric, lactic, and malic acids, are used for their preservative, flavor-enhancing, and pH-regulating properties. The market benefits from advancements in acid extraction and formulation technologies, the growing trend of clean label and health-conscious products, and the expansion of the functional food sector. Additionally, the increasing awareness of the health benefits and versatile applications of functional acids is driving market growth.
Functional Acids Competitive Landscape
The market report analyses the leading companies in the industry including Ajinomoto Co., Inc., Alltech, Inc., Archer Daniels Midland Company (ADM), Ashland Global Holdings Inc, Cargill, Incorporated, CJ CheilJedang Corporation, Evonik Industries AG, IOI Corporation Berhad, Kao Corporation, KLK OLEO, Musim Mas Holdings Pte. Ltd., OLEON NV, Permata Hijau Group, Sumitomo Chemical Co. Ltd, Teck Guan Holdings Sdn. Bhd., Wilmar International Limited, and Others.
Functional Acids Market Dynamics
Functional Acids Market Trend: Increasing Use of Functional Acids in Food and Beverage Applications
The most prominent trend in the Functional Acids Market is the increasing use of functional acids in food and beverage applications. As consumers seek healthier and more functional food products, acids that offer preservative, flavoring, and nutritional benefits are gaining popularity. This trend is driven by the growing demand for clean-label products that enhance product quality and shelf life without synthetic additives.
Functional Acids Market Driver: Growth in Health and Wellness Products
The key driver of the Functional Acids Market is the growth in health and wellness products. As more consumers focus on maintaining a healthy lifestyle, there is a higher demand for products that incorporate functional acids to enhance nutritional value and product stability. This driver is supported by the trend towards functional foods and beverages that provide specific health benefits, driving market growth for functional acids.
Functional Acids Market Opportunity: Innovation in Functional Acid Applications
A significant opportunity in the Functional Acids Market lies in innovation in functional acid applications. By exploring new ways to incorporate functional acids into various food and beverage products, such as supplements, snacks, and ready-to-eat meals, companies can enhance product quality and functionality. Offering innovative functional acid solutions that cater to specific health needs and dietary preferences can help expand market reach and drive growth in the food and beverage sector.
Functional Acids Market Share Analysis: Dietary Supplements is the fastest growing segment over the forecast period to 2032
The Dietary Supplements segment is the fastest-growing within the Functional Acids Market by application, projected to experience significant growth up to 2032. This rapid expansion is driven by the increasing consumer awareness of health and wellness, leading to a higher demand for supplements that enhance overall health and well-being. Functional acids such as amino acids and fatty acids are essential components in dietary supplements, providing benefits like improved muscle growth, better metabolic function, and enhanced cognitive health. The rise of fitness and wellness trends, along with the aging population seeking preventive health measures, has significantly boosted the demand for dietary supplements. Additionally, innovations in supplement formulations and the growing popularity of personalized nutrition have further propelled this market segment. The convenience of consuming essential nutrients in the form of supplements, along with the proliferation of e-commerce platforms, makes dietary supplements more accessible to a broader audience. As consumers continue to prioritize health and preventive care, the dietary supplements segment is expected to maintain its rapid growth, solidifying its position as the fastest-growing application in the functional acids market.
Functional Acids Market Share Analysis: Amino Acids segment generated the highest revenue share in the industry
Amino Acids are the largest segment within the Functional Acids Market by type. This segment's dominance is due to the critical role amino acids play in numerous biological processes, including protein synthesis, metabolic pathways, and overall cellular function. Amino acids are widely utilized across various industries, including food and beverage, pharmaceuticals, and dietary supplements, owing to their versatile health benefits. In the food and beverage industry, they are used to enhance nutritional profiles and improve taste and texture. In the pharmaceutical industry, amino acids are essential for the development of various medications and therapeutic treatments. The growing interest in sports nutrition and muscle recovery products has further increased the demand for amino acids. The extensive application range, combined with ongoing research and development to discover new benefits and uses, ensures that amino acids remain the largest segment in the functional acids market.
Functional Acids Market Segmentation
By Type
Amino Acids
Fatty Acids
Others
By Application
Food & Beverage
Pharmaceutical
Cosmetic & Personal Care
Dietary Supplements
Others
Countries Analyzed
North America (US, Canada, Mexico)
Europe (Germany, UK, France, Spain, Italy, Russia, Rest of Europe)
Asia Pacific (China, India, Japan, South Korea, Australia, South East Asia, Rest of Asia)
South America (Brazil, Argentina, Rest of South America)
Middle East and Africa (Saudi Arabia, UAE, Rest of Middle East, South Africa, Egypt, Rest of Africa)
Functional Acids Companies Profiled in the Study
Ajinomoto Co., Inc.
Alltech, Inc.
Archer Daniels Midland Company (ADM)
Ashland Global Holdings Inc
Cargill, Incorporated
CJ CheilJedang Corporation
Evonik Industries AG
IOI Corporation Berhad
Kao Corporation
KLK OLEO
Musim Mas Holdings Pte. Ltd.
OLEON NV
Permata Hijau Group
Sumitomo Chemical Co. Ltd
Teck Guan Holdings Sdn. Bhd.
Wilmar International Limited
*- List Not Exhaustive
Chapter 1. TABLE OF CONTENTS
Chapter 2. Introduction to Functional Acids Market
2.1. Market Overview
2.2. Key Statistics and Report Highlights
2.3. Scope of the Comprehensive Study
2.3.1. Market Definition
2.3.2 Countries and Regions Covered
2.3.3 Research Objective
2.3.4 Units, Currency, and Conversions
2.3.5 Industry Value Chain
2.4. Key Market Segments
2.5. Key Companies
2.6. Study Period
Chapter 3. Strategic Analysis Review
3.1. Functional Acids Pricing Analysis and Forecast
3.2. Porter’s Five Forces
3.3. Market Ecosystem
3.4. SWOT Analysis
3.5. Regulatory Scenario
3.3. Effects of Inflation, Russia-Ukraine War, moderating economic growth, and other macroeconomic factors
Chapter 4. Competitive Landscape
4.1. Market Share Analysis
4.1.1. Global Functional Acids Market Share by Company, 2023
4.1.2. Product Offerings of Leading Functional Acids Companies
4.2. Market Entropy
4.2.1. New Product Launches in the Industry
4.2.2. Mergers, Acquisitions, Joint ventures, and Partnerships
4.3. Key Strategies and Best Practices
Chapter 5. Global Market Projections: Best, Reference, and Low Case Scenarios
5.1. Growth Analysis- Case Scenario Definitions
5.2. Low Growth Case Scenario Forecasts
5.3. Reference Growth Case Scenario Forecasts
5.4. High Growth Case Scenario Forecasts
Chapter 6. Market Dynamics
6.1. Functional Acids Market Drivers
6.2. Functional Acids Market Challenges
6.6. Functional Acids Market Opportunities
6.4. Functional Acids Market Trends
Chapter 7. Global Functional Acids Market Outlook Trends
7.1. Global Functional Acids Revenue (USD Million) and CAGR (%) by Type (2021-2032)
7.2. Global Functional Acids Revenue (USD Million) and CAGR (%) by Application (2021-2032)
7.3. Global Functional Acids Revenue (USD Million) and CAGR (%) by Product (2021-2032)
By Type
Amino Acids
Fatty Acids
Others
By Application
Food & Beverage
Pharmaceutical
Cosmetic & Personal Care
Dietary Supplements
Others
Chapter 8. Global Functional Acids Regional Analysis and Outlook
8.1. Global Functional Acids Revenue (USD Million) By Regions (2021- 2032)
8.2. North America Functional Acids Revenue (USD Million) by Country (2021-2032)
8.2.1. United States Functional Acids Regional Analysis and Outlook
8.2.2. Canada Functional Acids Regional Analysis and Outlook
8.2.3. Mexico Functional Acids Regional Analysis and Outlook
8.3. Europe Functional Acids Revenue (USD Million), by Country (2021-2032)
8.3.1. Germany Functional Acids Regional Analysis and Outlook
8.3.2. France Functional Acids Regional Analysis and Outlook
8.3.3. United Kingdom Functional Acids Regional Analysis and Outlook
8.3.4. Spain Functional Acids Regional Analysis and Outlook
8.3.5. Italy Functional Acids Regional Analysis and Outlook
8.3.6. Russia Functional Acids Regional Analysis and Outlook
8.3.7. Rest of Europe Functional Acids Regional Analysis and Outlook
8.4. Asia Pacific Functional Acids Revenue (USD Million) by Country (2021-2032)
8.4.1. China Functional Acids Regional Analysis and Outlook
8.4.2. Japan Functional Acids Regional Analysis and Outlook
8.4.3. India Functional Acids Regional Analysis and Outlook
8.4.4. South Korea Functional Acids Regional Analysis and Outlook
8.4.5. Australia Functional Acids Regional Analysis and Outlook
8.4.6. South East Asia Functional Acids Regional Analysis and Outlook
8.4.7. Rest of Asia Pacific Functional Acids Regional Analysis and Outlook
8.5. South America Functional Acids Revenue (USD Million), by Country (2021-2032)
8.5.1. Brazil Functional Acids Regional Analysis and Outlook
8.5.2. Argentina Functional Acids Regional Analysis and Outlook
8.5.3. Rest of South America Functional Acids Regional Analysis and Outlook
8.6. Middle East and Africa Functional Acids Revenue (USD Million) by Country (2021-2032)
8.6.1. Middle East Functional Acids Regional Analysis and Outlook
8.6.2. Africa Functional Acids Regional Analysis and Outlook
Chapter 9. North America Functional Acids Analysis and Outlook
9.1. North America Functional Acids Revenue (USD Million) by Segments (2021-2032)
9.1.1. North America Functional Acids Revenue (USD Million) by Type (2021-2032)
9.1.2. North America Functional Acids Revenue (USD Million) by Application (2021-2032)
9.1.3. North America Functional Acids Revenue (USD Million) by Product (2021-2032)
By Type
Amino Acids
Fatty Acids
Others
By Application
Food & Beverage
Pharmaceutical
Cosmetic & Personal Care
Dietary Supplements
Others
Chapter 10. Europe Functional Acids Analysis and Outlook
10.1. Europe Functional Acids Revenue (USD Million), by Segments (USD Million) (2021-2032)
10.1.1. Europe Functional Acids Revenue (USD Million) by Type (2021-2032)
10.1.2. Europe Functional Acids Revenue (USD Million) by Application (2021-2032)
10.1.3. Europe Functional Acids Revenue (USD Million) by Product (2021-2032)
By Type
Amino Acids
Fatty Acids
Others
By Application
Food & Beverage
Pharmaceutical
Cosmetic & Personal Care
Dietary Supplements
Others
Chapter 11. Asia Pacific Functional Acids Analysis and Outlook
11.1. Asia Pacific Functional Acids Revenue (USD Million), and Revenue (USD Million) by Segments (2021-2032)
11.1.1. Asia Pacific Functional Acids Revenue (USD Million) by Type (2021-2032)
11.1.2. Asia Pacific Functional Acids Revenue (USD Million) by Application (2021-2032)
11.1.3. Asia Pacific Functional Acids Revenue (USD Million) by Product (2021-2032)
By Type
Amino Acids
Fatty Acids
Others
By Application
Food & Beverage
Pharmaceutical
Cosmetic & Personal Care
Dietary Supplements
Others
Chapter 12. South America Functional Acids Analysis and Outlook
12.1. South America Functional Acids Revenue (USD Million), by Segments (2021-2032)
12.1.1. South America Functional Acids Revenue (USD Million) by Type (2021-2032)
12.1.2. South America Functional Acids Revenue (USD Million) by Application (2021-2032)
12.1.3. South America Functional Acids Revenue (USD Million) by Product (2021-2032)
By Type
Amino Acids
Fatty Acids
Others
By Application
Food & Beverage
Pharmaceutical
Cosmetic & Personal Care
Dietary Supplements
Others
Chapter 13. Middle East and Africa Functional Acids Analysis and Outlook
13.1. Middle East and Africa Functional Acids Revenue (USD Million), by Segments (2021-2032)
13.1.1. Middle East and Africa Functional Acids Revenue (USD Million) by Type (2021-2032)
13.1.2. Middle East and Africa Functional Acids Revenue (USD Million) by Application (2021-2032)
13.1.3. Middle East and Africa Functional Acids Revenue (USD Million) by Product (2021-2032)
By Type
Amino Acids
Fatty Acids
Others
By Application
Food & Beverage
Pharmaceutical
Cosmetic & Personal Care
Dietary Supplements
Others
Chapter 14. Functional Acids Company Profiles
14.1 Business Overview
14.2 Product Profiles
14.3 SWOT Profiles
14.5 Recent Developments
14.6 Financial Profile
List of Companies
Ajinomoto Co., Inc.
Alltech, Inc.
Archer Daniels Midland Company (ADM)
Ashland Global Holdings Inc
Cargill, Incorporated
CJ CheilJedang Corporation
Evonik Industries AG
IOI Corporation Berhad
Kao Corporation
KLK OLEO
Musim Mas Holdings Pte. Ltd.
OLEON NV
Permata Hijau Group
Sumitomo Chemical Co. Ltd
Teck Guan Holdings Sdn. Bhd.
Wilmar International Limited
15. Methodology and Data Sources
15.1 Customization Offerings
15.2 Subscription Services
15.3 Related Reports
15.4 Publisher Expertise
LIST OF TABLES
Table 1 Market Segmentation Analysis
Table 2 Global Functional Acids Market Share of Leading Companies, 2023
Table 3 Product Offerings of Leading Companies
Table 4 Low Growth Scenario Forecasts
Table 5 Reference Case Growth Scenario
Table 6 High Growth Case Scenario
Table 7 Global Functional Acids Revenue (USD Million) And CAGR (%) By Type (2021-2032)
Table 8 Global Functional Acids Revenue (USD Million) And CAGR (%) By Application (2021-2032)
Table 9 Global Functional Acids Revenue (USD Million) And CAGR (%) By Product (2021-2032)
Table 10 Global Functional Acids Market Revenue (USD Million) By Regions (2021-2032)
Table 11 Global Functional Acids Market Share (%) By Regions (2021-2032)
Table 12 North America Functional Acids Revenue (USD Million) By Country (2021-2032)
Table 13 Europe Functional Acids Revenue (USD Million) By Country (2021-2032)
Table 14 Asia Pacific Functional Acids Revenue (USD Million) By Country (2021-2032)
Table 15 South America Functional Acids Revenue (USD Million) By Country (2021-2032)
Table 16 Middle East and Africa Functional Acids Revenue (USD Million) By Region (2021-2032)
Table 17 North America Functional Acids Revenue (USD Million) By Type (2021-2032)
Table 18 North America Functional Acids Revenue (USD Million) By Application (2021-2032)
Table 19 North America Functional Acids Revenue (USD Million) By Product (2021-2032)
Table 20 Europe Functional Acids Revenue (USD Million) By Type (2021-2032)
Table 21 Europe Functional Acids Revenue (USD Million) By Application (2021-2032)
Table 22 Europe Functional Acids Revenue (USD Million) By Product (2021-2032)
Table 23 Asia Pacific Functional Acids Revenue (USD Million) By Type (2021-2032)
Table 24 Asia Pacific Functional Acids Revenue (USD Million) By Application (2021-2032)
Table 25 Asia Pacific Functional Acids Revenue (USD Million) By Product (2021-2032)
Table 26 South America Functional Acids Revenue (USD Million) By Type (2021-2032)
Table 27 South America Functional Acids Revenue (USD Million) By Application (2021-2032)
Table 28 South America Functional Acids Revenue (USD Million) By Product (2021-2032)
Table 29 Middle East and Africa Functional Acids Revenue (USD Million) By Type (2021-2032)
Table 30 Middle East and Africa Functional Acids Revenue (USD Million) By Application (2021-2032)
Table 31 Middle East and Africa Functional Acids Revenue (USD Million) By Product (2021-2032)
LIST OF FIGURES
Figure 1. Market Scope
Figure 2. Pricing Forecasts Per Unit, 2023- 2032
Figure 3. Porter’s Five Forces
Figure 4. Global Functional Acids Market Revenue (USD Million) By Regions (2021-2032)
Figure 5. Global Functional Acids Market Share (%) By Regions (2023)
Figure 6. North America Functional Acids Revenue (USD Million) By Country (2021-2032)
Figure 7. United States Functional Acids Revenue (USD Million) By Country (2021-2032)
Figure 8. Canada Functional Acids Revenue (USD Million) By Country (2021-2032)
Figure 9. Mexico Functional Acids Revenue (USD Million) By Country (2021-2032)
Figure 10. Europe Functional Acids Revenue (USD Million) By Country (2021-2032)
Figure 11. Germany Functional Acids Revenue (USD Million) By Country (2021-2032)
Figure 12. France Functional Acids Revenue (USD Million) By Country (2021-2032)
Figure 13. United Kingdom Functional Acids Revenue (USD Million) By Country (2021-2032)
Figure 14. Spain Functional Acids Revenue (USD Million) By Country (2021-2032)
Figure 15. Italy Functional Acids Revenue (USD Million) By Country (2021-2032)
Figure 16. Russia Functional Acids Revenue (USD Million) By Country (2021-2032)
Figure 17. Rest of Europe Functional Acids Revenue (USD Million) By Country (2021-2032)
Figure 11. Asia Pacific Functional Acids Revenue (USD Million) By Country (2021-2032)
Figure 12. China Functional Acids Revenue (USD Million) By Country (2021-2032)
Figure 13. Japan Functional Acids Revenue (USD Million) By Country (2021-2032)
Figure 14. India Functional Acids Revenue (USD Million) By Country (2021-2032)
Figure 15. South Korea Functional Acids Revenue (USD Million) By Country (2021-2032)
Figure 16. Australia Functional Acids Revenue (USD Million) By Country (2021-2032)
Figure 17. South East Asia Functional Acids Revenue (USD Million) By Country (2021-2032)
Figure 18. South America Functional Acids Revenue (USD Million) By Country (2021-2032)
Figure 19. Brazil Functional Acids Revenue (USD Million) By Country (2021-2032)
Figure 20. Argentina Functional Acids Revenue (USD Million) By Country (2021-2032)
Figure 21. Rest of Asia Pacific Functional Acids Revenue (USD Million) By Country (2021-2032)
Figure 22. Middle East and Africa Functional Acids Revenue (USD Million) By Region (2021-2032)
Figure 23. Saudi Arabia Functional Acids Revenue (USD Million) By Region (2021-2032)
Figure 24. The UAE Functional Acids Revenue (USD Million) By Region (2021-2032)
Figure 25. Rest of Middle East Functional Acids Revenue (USD Million) By Region (2021-2032)
Figure 26. South Africa Functional Acids Revenue (USD Million) By Region (2021-2032)
Figure 27. Africa Functional Acids Revenue (USD Million) By Region (2021-2032)
Figure 28. North America Functional Acids Revenue (USD Million) By Type (2021-2032)
Figure 29. North America Functional Acids Revenue (USD Million) By Application (2021-2032)
Figure 30. North America Functional Acids Revenue (USD Million) By Product (2021-2032)
Figure 31. Europe Functional Acids Revenue (USD Million) By Type (2021-2032)
Figure 32. Europe Functional Acids Revenue (USD Million) By Application (2021-2032)
Figure 33. Europe Functional Acids Revenue (USD Million) By Product (2021-2032)
Figure 34. Asia Pacific Functional Acids Revenue (USD Million) By Type (2021-2032)
Figure 35. Asia Pacific Functional Acids Revenue (USD Million) By Application (2021-2032)
Figure 36. Asia Pacific Functional Acids Revenue (USD Million) By Product (2021-2032)
Figure 37. South America Functional Acids Revenue (USD Million) By Type (2021-2032)
Figure 38. South America Functional Acids Revenue (USD Million) By Application (2021-2032)
Figure 39. South America Functional Acids Revenue (USD Million) By Product (2021-2032)
Figure 40. Middle East and Africa Functional Acids Revenue (USD Million) By Type (2021-2032)
Figure 41. Middle East and Africa Functional Acids Revenue (USD Million) By Application (2021-2032)
Figure 42. Middle East and Africa Functional Acids Revenue (USD Million) By Product (2021-2032)
By Type
Amino Acids
Fatty Acids
Others
By Application
Food & Beverage
Pharmaceutical
Cosmetic & Personal Care
Dietary Supplements
Others
Countries Analyzed
North America (US, Canada, Mexico)
Europe (Germany, UK, France, Spain, Italy, Russia, Rest of Europe)
Asia Pacific (China, India, Japan, South Korea, Australia, South East Asia, Rest of Asia)
South America (Brazil, Argentina, Rest of South America)
Middle East and Africa (Saudi Arabia, UAE, Rest of Middle East, South Africa, Egypt, Rest of Africa)
