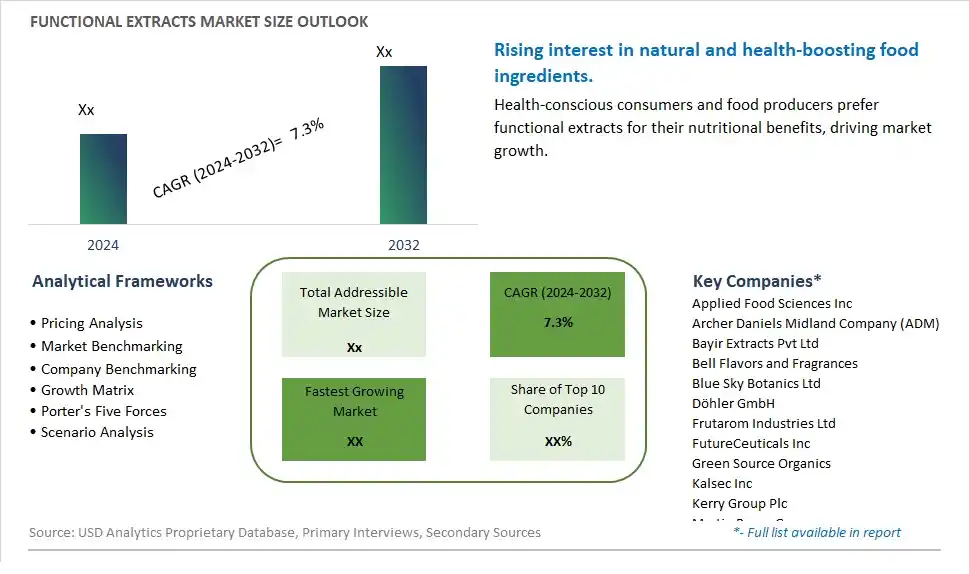
Global Functional Extracts Market Size is valued at $XX Million in 2024 and is forecast to register a growth rate (CAGR) of 7.3% to reach $XX Million by 2032.
The global Functional Extracts Market Comprehensive Study analyzes and forecasts the market size across 6 regions and 24 countries for diverse segments -By Source (Plants, Vegetables, Fruits, Seeds, Flowers), By Application (Food, Beverages, Pharmaceuticals, Dietary Supplements, Animal Nutrition, Cosmetics, Personal Care), By Type (Organic, Conventional)
An Introduction to Functional Extracts Market
The Functional Extracts market in 2024 is witnessing robust growth, driven by the rising demand for natural and potent ingredients in food, beverages, and dietary supplements. Functional extracts, derived from plants, fruits, and herbs, are used for their health benefits, flavor, and functional properties. The market benefits from advancements in extraction and concentration technologies, the growing trend of clean label and natural products, and the expansion of the functional food and nutraceutical sectors. Additionally, the increasing awareness of the health benefits and versatile applications of functional extracts is driving market growth.
Functional Extracts Competitive Landscape
The market report analyses the leading companies in the industry including Applied Food Sciences Inc, Archer Daniels Midland Company (ADM), Bayir Extracts Pvt Ltd, Bell Flavors and Fragrances, Blue Sky Botanics Ltd, Döhler GmbH, Frutarom Industries Ltd, FutureCeuticals Inc, Green Source Organics, Kalsec Inc, Kerry Group Plc, Martin Bauer Group, MB-Holding GmbH & Co. KG, Morre-Tec Industries Inc, Naturex S.A., NOF America Corp, Synergy Flavors, The Green Labs LLC, Tianjiang Pharmaceutical Co. Ltd, VF Bioscience SAS, and Others.
Functional Extracts Market Dynamics
Functional Extracts Market Trend: Rising Demand for Natural and Functional Food Ingredients
The most prominent trend in the Functional Extracts Market is the rising demand for natural and functional food ingredients. As consumers seek to enhance their diets with nutrient-dense products, functional extracts are becoming popular for their versatility and health benefits. This trend is driven by the increasing demand for clean-label products that offer health benefits without synthetic additives.
Functional Extracts Market Driver: Increase in Health and Wellness Products
The key driver of the Functional Extracts Market is the increase in health and wellness products. As more consumers focus on maintaining a healthy lifestyle, there is a higher demand for products that incorporate functional extracts to enhance nutritional value and flavor. This driver is supported by the trend towards functional foods and beverages that provide specific health benefits, driving market growth for functional extracts.
Functional Extracts Market Opportunity: Expansion into Specialty Diets and Culinary Applications
A significant opportunity in the Functional Extracts Market lies in the expansion into specialty diets and culinary applications. By developing products tailored to specific dietary needs, such as vegan, gluten-free, or keto-friendly options, companies can cater to niche markets. Additionally, promoting the use of functional extracts in gourmet cooking and baking can attract chefs and food enthusiasts looking for high-quality, nutrient-rich ingredients, thereby broadening the market base.
Functional Extracts Market Share Analysis: Plants segment generated the highest revenue share in the industry
Plants are the largest segment within the Functional Extracts Market by source. This segment's dominance is attributed to the extensive use of plant extracts in a wide range of applications, including food and beverages, pharmaceuticals, cosmetics, and personal care products. Plant extracts, such as those derived from herbs, leaves, roots, and bark, are highly valued for their bioactive compounds that offer numerous health benefits, including antioxidant, anti-inflammatory, and antimicrobial properties. The growing consumer demand for natural and organic products has significantly boosted the use of plant-based extracts, as they are perceived as safer and more sustainable compared to synthetic alternatives. Additionally, the diverse range of plants available for extraction allows for a broad spectrum of functional ingredients that can be tailored to specific health and wellness needs. The increasing popularity of traditional and herbal medicine further supports the market growth of plant extracts. As the trend towards natural and holistic health solutions continues to rise, the plant segment is expected to maintain its leading position in the functional extracts market.
Functional Extracts Market Share Analysis: Fruits is the fastest growing segment over the forecast period to 2032
The Fruits segment is the fastest-growing within the Functional Extracts Market by source, projected to experience significant growth up to 2032. This rapid expansion is driven by the increasing awareness of the health benefits associated with fruit extracts, which are rich in vitamins, antioxidants, and other essential nutrients. Fruit extracts are widely used in the food and beverage industry to enhance flavor, color, and nutritional value, making them highly appealing to health-conscious consumers. The growing demand for natural and clean-label products has further propelled the use of fruit extracts, as they are perceived as pure and wholesome ingredients. Additionally, innovations in extraction technologies have improved the efficiency and quality of fruit extracts, making them more accessible and cost-effective for manufacturers. The popularity of functional foods and beverages, such as smoothies, energy drinks, and fortified snacks, has also contributed to the growth of the fruit extracts segment. As consumers continue to seek out products that support their health and wellness goals, the demand for fruit-based functional extracts is expected to soar, solidifying the fruits segment as the fastest-growing source in the functional extracts market.
Functional Extracts Market Share Analysis: Dietary Supplements is the fastest growing segment over the forecast period to 2032
The Dietary Supplements segment is the fastest-growing within the Functional Extracts Market by application, projected to experience significant growth up to 2032. This rapid expansion is driven by the increasing consumer focus on health and wellness, leading to a higher demand for supplements that enhance overall health, boost immunity, and prevent diseases. Functional extracts, such as those derived from plants, fruits, and vegetables, are essential components in dietary supplements due to their rich content of bioactive compounds, vitamins, minerals, and antioxidants. The rise of fitness and wellness trends, along with the aging population seeking preventive health measures, has significantly boosted the demand for dietary supplements. Innovations in supplement formulations and the growing popularity of personalized nutrition have further propelled this market segment. The convenience of consuming essential nutrients in the form of supplements, coupled with the proliferation of e-commerce platforms, makes dietary supplements more accessible to a broader audience. As consumers continue to prioritize health and preventive care, the dietary supplements segment is expected to maintain its rapid growth, solidifying its position as the fastest-growing application in the functional extracts market.
Functional Extracts Market Share Analysis: Conventional segment generated the highest revenue share in the industry
Conventional is the largest segment within the Functional Extracts Market by type. This segment's dominance is attributed to the widespread availability and cost-effectiveness of conventionally produced extracts compared to their organic counterparts. Conventional extracts are produced using standard agricultural practices and are widely utilized across various industries, including food and beverages, pharmaceuticals, cosmetics, and personal care. These extracts are often favored for their consistency in quality and supply, making them a reliable choice for manufacturers aiming to meet large-scale production demands. Additionally, the extensive research and development invested in optimizing conventional extraction methods have led to high yields and efficient production processes, further reducing costs. The broad application range and affordability of conventional extracts ensure their sustained demand, solidifying their position as the largest segment in the functional extracts market.
Functional Extracts Market Share Analysis: Organic is the fastest growing segment over the forecast period to 2032
The Organic segment is the fastest-growing within the Functional Extracts Market by type, projected to experience significant growth up to 2032. This rapid expansion is driven by the increasing consumer preference for natural and sustainably sourced products. Organic extracts, derived from plants, fruits, and other sources grown without synthetic pesticides or fertilizers, are perceived as healthier and more environmentally friendly. The rising trend towards clean-label products and the growing awareness of the health benefits associated with organic consumption have significantly boosted the demand for organic extracts. Further, stringent regulations and certifications for organic products assure consumers of their quality and authenticity. The premium pricing of organic extracts, supported by their health and environmental benefits, has also contributed to their market growth. As consumers continue to seek out natural and eco-friendly options, the demand for organic functional extracts is expected to soar, solidifying the organic segment as the fastest-growing type in the functional extracts market.
Functional Extracts Market Segmentation
By Source
Plants
Vegetables
Fruits
Seeds
Flowers
By Application
Food
Beverages
Pharmaceuticals
Dietary Supplements
Animal Nutrition
Cosmetics
Personal Care
By Type
Organic
Conventional
Countries Analyzed
North America (US, Canada, Mexico)
Europe (Germany, UK, France, Spain, Italy, Russia, Rest of Europe)
Asia Pacific (China, India, Japan, South Korea, Australia, South East Asia, Rest of Asia)
South America (Brazil, Argentina, Rest of South America)
Middle East and Africa (Saudi Arabia, UAE, Rest of Middle East, South Africa, Egypt, Rest of Africa)
Functional Extracts Companies Profiled in the Study
Applied Food Sciences Inc
Archer Daniels Midland Company (ADM)
Bayir Extracts Pvt Ltd
Bell Flavors and Fragrances
Blue Sky Botanics Ltd
Döhler GmbH
Frutarom Industries Ltd
FutureCeuticals Inc
Green Source Organics
Kalsec Inc
Kerry Group Plc
Martin Bauer Group
MB-Holding GmbH & Co. KG
Morre-Tec Industries Inc
Naturex S.A.
NOF America Corp
Synergy Flavors
The Green Labs LLC
Tianjiang Pharmaceutical Co. Ltd
VF Bioscience SAS
*- List Not Exhaustive
Chapter 1. TABLE OF CONTENTS
Chapter 2. Introduction to Functional Extracts Market
2.1. Market Overview
2.2. Key Statistics and Report Highlights
2.3. Scope of the Comprehensive Study
2.3.1. Market Definition
2.3.2 Countries and Regions Covered
2.3.3 Research Objective
2.3.4 Units, Currency, and Conversions
2.3.5 Industry Value Chain
2.4. Key Market Segments
2.5. Key Companies
2.6. Study Period
Chapter 3. Strategic Analysis Review
3.1. Functional Extracts Pricing Analysis and Forecast
3.2. Porter’s Five Forces
3.3. Market Ecosystem
3.4. SWOT Analysis
3.5. Regulatory Scenario
3.3. Effects of Inflation, Russia-Ukraine War, moderating economic growth, and other macroeconomic factors
Chapter 4. Competitive Landscape
4.1. Market Share Analysis
4.1.1. Global Functional Extracts Market Share by Company, 2023
4.1.2. Product Offerings of Leading Functional Extracts Companies
4.2. Market Entropy
4.2.1. New Product Launches in the Industry
4.2.2. Mergers, Acquisitions, Joint ventures, and Partnerships
4.3. Key Strategies and Best Practices
Chapter 5. Global Market Projections: Best, Reference, and Low Case Scenarios
5.1. Growth Analysis- Case Scenario Definitions
5.2. Low Growth Case Scenario Forecasts
5.3. Reference Growth Case Scenario Forecasts
5.4. High Growth Case Scenario Forecasts
Chapter 6. Market Dynamics
6.1. Functional Extracts Market Drivers
6.2. Functional Extracts Market Challenges
6.6. Functional Extracts Market Opportunities
6.4. Functional Extracts Market Trends
Chapter 7. Global Functional Extracts Market Outlook Trends
7.1. Global Functional Extracts Revenue (USD Million) and CAGR (%) by Type (2021-2032)
7.2. Global Functional Extracts Revenue (USD Million) and CAGR (%) by Application (2021-2032)
7.3. Global Functional Extracts Revenue (USD Million) and CAGR (%) by Product (2021-2032)
By Source
Plants
Vegetables
Fruits
Seeds
Flowers
By Application
Food
Beverages
Pharmaceuticals
Dietary Supplements
Animal Nutrition
Cosmetics
Personal Care
By Type
Organic
Conventional
Chapter 8. Global Functional Extracts Regional Analysis and Outlook
8.1. Global Functional Extracts Revenue (USD Million) By Regions (2021- 2032)
8.2. North America Functional Extracts Revenue (USD Million) by Country (2021-2032)
8.2.1. United States Functional Extracts Regional Analysis and Outlook
8.2.2. Canada Functional Extracts Regional Analysis and Outlook
8.2.3. Mexico Functional Extracts Regional Analysis and Outlook
8.3. Europe Functional Extracts Revenue (USD Million), by Country (2021-2032)
8.3.1. Germany Functional Extracts Regional Analysis and Outlook
8.3.2. France Functional Extracts Regional Analysis and Outlook
8.3.3. United Kingdom Functional Extracts Regional Analysis and Outlook
8.3.4. Spain Functional Extracts Regional Analysis and Outlook
8.3.5. Italy Functional Extracts Regional Analysis and Outlook
8.3.6. Russia Functional Extracts Regional Analysis and Outlook
8.3.7. Rest of Europe Functional Extracts Regional Analysis and Outlook
8.4. Asia Pacific Functional Extracts Revenue (USD Million) by Country (2021-2032)
8.4.1. China Functional Extracts Regional Analysis and Outlook
8.4.2. Japan Functional Extracts Regional Analysis and Outlook
8.4.3. India Functional Extracts Regional Analysis and Outlook
8.4.4. South Korea Functional Extracts Regional Analysis and Outlook
8.4.5. Australia Functional Extracts Regional Analysis and Outlook
8.4.6. South East Asia Functional Extracts Regional Analysis and Outlook
8.4.7. Rest of Asia Pacific Functional Extracts Regional Analysis and Outlook
8.5. South America Functional Extracts Revenue (USD Million), by Country (2021-2032)
8.5.1. Brazil Functional Extracts Regional Analysis and Outlook
8.5.2. Argentina Functional Extracts Regional Analysis and Outlook
8.5.3. Rest of South America Functional Extracts Regional Analysis and Outlook
8.6. Middle East and Africa Functional Extracts Revenue (USD Million) by Country (2021-2032)
8.6.1. Middle East Functional Extracts Regional Analysis and Outlook
8.6.2. Africa Functional Extracts Regional Analysis and Outlook
Chapter 9. North America Functional Extracts Analysis and Outlook
9.1. North America Functional Extracts Revenue (USD Million) by Segments (2021-2032)
9.1.1. North America Functional Extracts Revenue (USD Million) by Type (2021-2032)
9.1.2. North America Functional Extracts Revenue (USD Million) by Application (2021-2032)
9.1.3. North America Functional Extracts Revenue (USD Million) by Product (2021-2032)
By Source
Plants
Vegetables
Fruits
Seeds
Flowers
By Application
Food
Beverages
Pharmaceuticals
Dietary Supplements
Animal Nutrition
Cosmetics
Personal Care
By Type
Organic
Conventional
Chapter 10. Europe Functional Extracts Analysis and Outlook
10.1. Europe Functional Extracts Revenue (USD Million), by Segments (USD Million) (2021-2032)
10.1.1. Europe Functional Extracts Revenue (USD Million) by Type (2021-2032)
10.1.2. Europe Functional Extracts Revenue (USD Million) by Application (2021-2032)
10.1.3. Europe Functional Extracts Revenue (USD Million) by Product (2021-2032)
By Source
Plants
Vegetables
Fruits
Seeds
Flowers
By Application
Food
Beverages
Pharmaceuticals
Dietary Supplements
Animal Nutrition
Cosmetics
Personal Care
By Type
Organic
Conventional
Chapter 11. Asia Pacific Functional Extracts Analysis and Outlook
11.1. Asia Pacific Functional Extracts Revenue (USD Million), and Revenue (USD Million) by Segments (2021-2032)
11.1.1. Asia Pacific Functional Extracts Revenue (USD Million) by Type (2021-2032)
11.1.2. Asia Pacific Functional Extracts Revenue (USD Million) by Application (2021-2032)
11.1.3. Asia Pacific Functional Extracts Revenue (USD Million) by Product (2021-2032)
By Source
Plants
Vegetables
Fruits
Seeds
Flowers
By Application
Food
Beverages
Pharmaceuticals
Dietary Supplements
Animal Nutrition
Cosmetics
Personal Care
By Type
Organic
Conventional
Chapter 12. South America Functional Extracts Analysis and Outlook
12.1. South America Functional Extracts Revenue (USD Million), by Segments (2021-2032)
12.1.1. South America Functional Extracts Revenue (USD Million) by Type (2021-2032)
12.1.2. South America Functional Extracts Revenue (USD Million) by Application (2021-2032)
12.1.3. South America Functional Extracts Revenue (USD Million) by Product (2021-2032)
By Source
Plants
Vegetables
Fruits
Seeds
Flowers
By Application
Food
Beverages
Pharmaceuticals
Dietary Supplements
Animal Nutrition
Cosmetics
Personal Care
By Type
Organic
Conventional
Chapter 13. Middle East and Africa Functional Extracts Analysis and Outlook
13.1. Middle East and Africa Functional Extracts Revenue (USD Million), by Segments (2021-2032)
13.1.1. Middle East and Africa Functional Extracts Revenue (USD Million) by Type (2021-2032)
13.1.2. Middle East and Africa Functional Extracts Revenue (USD Million) by Application (2021-2032)
13.1.3. Middle East and Africa Functional Extracts Revenue (USD Million) by Product (2021-2032)
By Source
Plants
Vegetables
Fruits
Seeds
Flowers
By Application
Food
Beverages
Pharmaceuticals
Dietary Supplements
Animal Nutrition
Cosmetics
Personal Care
By Type
Organic
Conventional
Chapter 14. Functional Extracts Company Profiles
14.1 Business Overview
14.2 Product Profiles
14.3 SWOT Profiles
14.5 Recent Developments
14.6 Financial Profile
List of Companies
Applied Food Sciences Inc
Archer Daniels Midland Company (ADM)
Bayir Extracts Pvt Ltd
Bell Flavors and Fragrances
Blue Sky Botanics Ltd
Döhler GmbH
Frutarom Industries Ltd
FutureCeuticals Inc
Green Source Organics
Kalsec Inc
Kerry Group Plc
Martin Bauer Group
MB-Holding GmbH & Co. KG
Morre-Tec Industries Inc
Naturex S.A.
NOF America Corp
Synergy Flavors
The Green Labs LLC
Tianjiang Pharmaceutical Co. Ltd
VF Bioscience SAS
15. Methodology and Data Sources
15.1 Customization Offerings
15.2 Subscription Services
15.3 Related Reports
15.4 Publisher Expertise
LIST OF TABLES
Table 1 Market Segmentation Analysis
Table 2 Global Functional Extracts Market Share of Leading Companies, 2023
Table 3 Product Offerings of Leading Companies
Table 4 Low Growth Scenario Forecasts
Table 5 Reference Case Growth Scenario
Table 6 High Growth Case Scenario
Table 7 Global Functional Extracts Revenue (USD Million) And CAGR (%) By Type (2021-2032)
Table 8 Global Functional Extracts Revenue (USD Million) And CAGR (%) By Application (2021-2032)
Table 9 Global Functional Extracts Revenue (USD Million) And CAGR (%) By Product (2021-2032)
Table 10 Global Functional Extracts Market Revenue (USD Million) By Regions (2021-2032)
Table 11 Global Functional Extracts Market Share (%) By Regions (2021-2032)
Table 12 North America Functional Extracts Revenue (USD Million) By Country (2021-2032)
Table 13 Europe Functional Extracts Revenue (USD Million) By Country (2021-2032)
Table 14 Asia Pacific Functional Extracts Revenue (USD Million) By Country (2021-2032)
Table 15 South America Functional Extracts Revenue (USD Million) By Country (2021-2032)
Table 16 Middle East and Africa Functional Extracts Revenue (USD Million) By Region (2021-2032)
Table 17 North America Functional Extracts Revenue (USD Million) By Type (2021-2032)
Table 18 North America Functional Extracts Revenue (USD Million) By Application (2021-2032)
Table 19 North America Functional Extracts Revenue (USD Million) By Product (2021-2032)
Table 20 Europe Functional Extracts Revenue (USD Million) By Type (2021-2032)
Table 21 Europe Functional Extracts Revenue (USD Million) By Application (2021-2032)
Table 22 Europe Functional Extracts Revenue (USD Million) By Product (2021-2032)
Table 23 Asia Pacific Functional Extracts Revenue (USD Million) By Type (2021-2032)
Table 24 Asia Pacific Functional Extracts Revenue (USD Million) By Application (2021-2032)
Table 25 Asia Pacific Functional Extracts Revenue (USD Million) By Product (2021-2032)
Table 26 South America Functional Extracts Revenue (USD Million) By Type (2021-2032)
Table 27 South America Functional Extracts Revenue (USD Million) By Application (2021-2032)
Table 28 South America Functional Extracts Revenue (USD Million) By Product (2021-2032)
Table 29 Middle East and Africa Functional Extracts Revenue (USD Million) By Type (2021-2032)
Table 30 Middle East and Africa Functional Extracts Revenue (USD Million) By Application (2021-2032)
Table 31 Middle East and Africa Functional Extracts Revenue (USD Million) By Product (2021-2032)
LIST OF FIGURES
Figure 1. Market Scope
Figure 2. Pricing Forecasts Per Unit, 2023- 2032
Figure 3. Porter’s Five Forces
Figure 4. Global Functional Extracts Market Revenue (USD Million) By Regions (2021-2032)
Figure 5. Global Functional Extracts Market Share (%) By Regions (2023)
Figure 6. North America Functional Extracts Revenue (USD Million) By Country (2021-2032)
Figure 7. United States Functional Extracts Revenue (USD Million) By Country (2021-2032)
Figure 8. Canada Functional Extracts Revenue (USD Million) By Country (2021-2032)
Figure 9. Mexico Functional Extracts Revenue (USD Million) By Country (2021-2032)
Figure 10. Europe Functional Extracts Revenue (USD Million) By Country (2021-2032)
Figure 11. Germany Functional Extracts Revenue (USD Million) By Country (2021-2032)
Figure 12. France Functional Extracts Revenue (USD Million) By Country (2021-2032)
Figure 13. United Kingdom Functional Extracts Revenue (USD Million) By Country (2021-2032)
Figure 14. Spain Functional Extracts Revenue (USD Million) By Country (2021-2032)
Figure 15. Italy Functional Extracts Revenue (USD Million) By Country (2021-2032)
Figure 16. Russia Functional Extracts Revenue (USD Million) By Country (2021-2032)
Figure 17. Rest of Europe Functional Extracts Revenue (USD Million) By Country (2021-2032)
Figure 11. Asia Pacific Functional Extracts Revenue (USD Million) By Country (2021-2032)
Figure 12. China Functional Extracts Revenue (USD Million) By Country (2021-2032)
Figure 13. Japan Functional Extracts Revenue (USD Million) By Country (2021-2032)
Figure 14. India Functional Extracts Revenue (USD Million) By Country (2021-2032)
Figure 15. South Korea Functional Extracts Revenue (USD Million) By Country (2021-2032)
Figure 16. Australia Functional Extracts Revenue (USD Million) By Country (2021-2032)
Figure 17. South East Asia Functional Extracts Revenue (USD Million) By Country (2021-2032)
Figure 18. South America Functional Extracts Revenue (USD Million) By Country (2021-2032)
Figure 19. Brazil Functional Extracts Revenue (USD Million) By Country (2021-2032)
Figure 20. Argentina Functional Extracts Revenue (USD Million) By Country (2021-2032)
Figure 21. Rest of Asia Pacific Functional Extracts Revenue (USD Million) By Country (2021-2032)
Figure 22. Middle East and Africa Functional Extracts Revenue (USD Million) By Region (2021-2032)
Figure 23. Saudi Arabia Functional Extracts Revenue (USD Million) By Region (2021-2032)
Figure 24. The UAE Functional Extracts Revenue (USD Million) By Region (2021-2032)
Figure 25. Rest of Middle East Functional Extracts Revenue (USD Million) By Region (2021-2032)
Figure 26. South Africa Functional Extracts Revenue (USD Million) By Region (2021-2032)
Figure 27. Africa Functional Extracts Revenue (USD Million) By Region (2021-2032)
Figure 28. North America Functional Extracts Revenue (USD Million) By Type (2021-2032)
Figure 29. North America Functional Extracts Revenue (USD Million) By Application (2021-2032)
Figure 30. North America Functional Extracts Revenue (USD Million) By Product (2021-2032)
Figure 31. Europe Functional Extracts Revenue (USD Million) By Type (2021-2032)
Figure 32. Europe Functional Extracts Revenue (USD Million) By Application (2021-2032)
Figure 33. Europe Functional Extracts Revenue (USD Million) By Product (2021-2032)
Figure 34. Asia Pacific Functional Extracts Revenue (USD Million) By Type (2021-2032)
Figure 35. Asia Pacific Functional Extracts Revenue (USD Million) By Application (2021-2032)
Figure 36. Asia Pacific Functional Extracts Revenue (USD Million) By Product (2021-2032)
Figure 37. South America Functional Extracts Revenue (USD Million) By Type (2021-2032)
Figure 38. South America Functional Extracts Revenue (USD Million) By Application (2021-2032)
Figure 39. South America Functional Extracts Revenue (USD Million) By Product (2021-2032)
Figure 40. Middle East and Africa Functional Extracts Revenue (USD Million) By Type (2021-2032)
Figure 41. Middle East and Africa Functional Extracts Revenue (USD Million) By Application (2021-2032)
Figure 42. Middle East and Africa Functional Extracts Revenue (USD Million) By Product (2021-2032)
By Source
Plants
Vegetables
Fruits
Seeds
Flowers
By Application
Food
Beverages
Pharmaceuticals
Dietary Supplements
Animal Nutrition
Cosmetics
Personal Care
By Type
Organic
Conventional
Countries Analyzed
North America (US, Canada, Mexico)
Europe (Germany, UK, France, Spain, Italy, Russia, Rest of Europe)
Asia Pacific (China, India, Japan, South Korea, Australia, South East Asia, Rest of Asia)
South America (Brazil, Argentina, Rest of South America)
Middle East and Africa (Saudi Arabia, UAE, Rest of Middle East, South Africa, Egypt, Rest of Africa)
