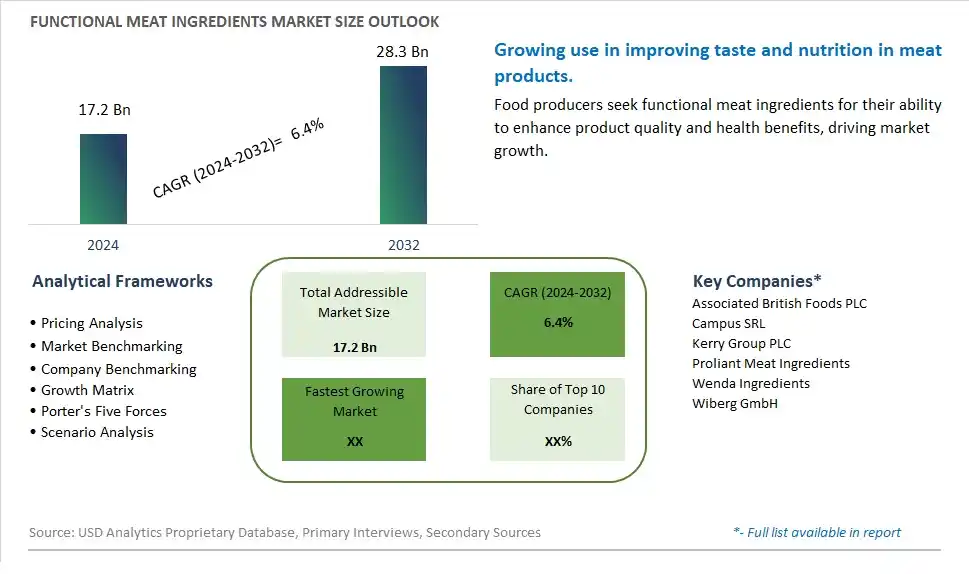
Global Functional Meat Ingredients Market Size is valued at $17.2 Billion in 2024 and is forecast to register a growth rate (CAGR) of 6.4% to reach $28.3 Billion by 2032.
The global Functional Meat Ingredients Market Comprehensive Study analyzes and forecasts the market size across 6 regions and 24 countries for diverse segments -By Product (Hydrocolloids, Cereal Flours, Vegetable Fibers, Others), By Meat (Beef, Pork, Mutton, Poultry)
An Introduction to Functional Meat Ingredients Market
In 2024, the Functional Meat Ingredients market is experiencing significant growth, driven by the rising demand for high-quality and value-added meat products. Functional meat ingredients, such as proteins, fibers, and natural extracts, enhance the nutritional profile, texture, and shelf life of meat products. The market benefits from advancements in meat processing and fortification technologies, the growing trend of health-conscious and premium meat products, and the expansion of the global meat industry. Additionally, the increasing focus on clean label and natural meat ingredients is contributing to market growth.
Functional Meat Ingredients Competitive Landscape
The market report analyses the leading companies in the industry including Associated British Foods PLC, Campus SRL, Kerry Group PLC, Proliant Meat Ingredients, Wenda Ingredients, Wiberg GmbH, and Others.
Functional Meat Ingredients Market Dynamics
Functional Meat Ingredients Market Trend: Increasing Demand for Natural and Functional Meat Ingredients
The most prominent trend in the Functional Meat Ingredients Market is the increasing demand for natural and functional meat ingredients. As consumers seek healthier and more natural meat products, functional ingredients that enhance the nutritional profile and flavor of meat are gaining popularity. This trend is driven by the growing demand for clean-label products that offer health benefits without synthetic additives.
Functional Meat Ingredients Market Driver: Growth in Meat Consumption
The key driver of the Functional Meat Ingredients Market is the growth in meat consumption. As more consumers incorporate meat into their diets, there is a higher demand for meat ingredients that provide added health benefits, such as improved texture, flavor, and nutritional value. This driver is supported by the trend towards functional foods and the increasing importance of high-quality ingredients in meat products, driving market growth for functional meat ingredients.
Functional Meat Ingredients Market Opportunity: Innovation in Meat Ingredient Formulations and Applications
A significant opportunity in the Functional Meat Ingredients Market lies in innovation in meat ingredient formulations and applications. By developing new and unique meat ingredient blends that cater to specific dietary preferences, such as organic, low-sodium, or high-protein options, companies can attract a broader audience. Offering innovative and nutritious meat ingredients that enhance the quality and functionality of meat products can help expand market reach and drive growth in the meat industry.
Functional Meat Ingredients Market Share Analysis: Poultry is the fastest growing segment over the forecast period to 2032
The Poultry segment is the fastest-growing within the Functional Meat Ingredients Market by meat type, projected to experience significant growth up to 2032. This rapid expansion is driven by the increasing global demand for poultry products, which are perceived as a healthier and more affordable source of protein compared to red meats. Poultry, including chicken and turkey, is widely used in various culinary applications, from processed meats to ready-to-eat meals. The versatility of poultry meat allows it to pair well with various functional meat ingredients such as hydrocolloids, cereal flours, and vegetable fibers, enhancing texture, moisture retention, and nutritional content. The rise of health-conscious consumers seeking leaner meat options has further boosted the demand for poultry products enriched with functional ingredients. Additionally, the growing trend towards convenience foods and the expansion of fast-food chains globally contribute to the segment's robust growth. As the demand for nutritious, affordable, and versatile meat products continues to rise, the poultry segment is expected to maintain its rapid growth trajectory, solidifying its position as the fastest-growing segment in the functional meat ingredients market.
Functional Meat Ingredients Market Share Analysis: Hydrocolloids segment generated the highest revenue share in the industry
Hydrocolloids are the largest segment within the Functional Meat Ingredients Market by product. This segment's dominance is attributed to the wide range of functional properties that hydrocolloids offer, including thickening, gelling, stabilizing, and water retention. These properties are crucial in meat processing, as they improve the texture, juiciness, and shelf life of meat products. Hydrocolloids such as carrageenan, xanthan gum, and guar gum are extensively used in various meat applications, including sausages, patties, and deli meats, to enhance their quality and consumer appeal. The demand for processed and convenience meat products has significantly boosted the use of hydrocolloids in the meat industry. Additionally, the ability of hydrocolloids to maintain the desired sensory attributes of meat products while improving their nutritional profile aligns with the growing consumer preference for healthier and high-quality meat products. The extensive application range and functional benefits of hydrocolloids ensure their prominent position as the largest segment in the functional meat ingredients market.
Functional Meat Ingredients Market Segmentation
By Product
Hydrocolloids
Cereal Flours
Vegetable Fibers
Others
By Meat
Beef
Pork
Mutton
Poultry
Countries Analyzed
North America (US, Canada, Mexico)
Europe (Germany, UK, France, Spain, Italy, Russia, Rest of Europe)
Asia Pacific (China, India, Japan, South Korea, Australia, South East Asia, Rest of Asia)
South America (Brazil, Argentina, Rest of South America)
Middle East and Africa (Saudi Arabia, UAE, Rest of Middle East, South Africa, Egypt, Rest of Africa)
Functional Meat Ingredients Companies Profiled in the Study
Associated British Foods PLC
Campus SRL
Kerry Group PLC
Proliant Meat Ingredients
Wenda Ingredients
Wiberg GmbH
*- List Not Exhaustive
Chapter 1. TABLE OF CONTENTS
Chapter 2. Introduction to Functional Meat Ingredients Market
2.1. Market Overview
2.2. Key Statistics and Report Highlights
2.3. Scope of the Comprehensive Study
2.3.1. Market Definition
2.3.2 Countries and Regions Covered
2.3.3 Research Objective
2.3.4 Units, Currency, and Conversions
2.3.5 Industry Value Chain
2.4. Key Market Segments
2.5. Key Companies
2.6. Study Period
Chapter 3. Strategic Analysis Review
3.1. Functional Meat Ingredients Pricing Analysis and Forecast
3.2. Porter’s Five Forces
3.3. Market Ecosystem
3.4. SWOT Analysis
3.5. Regulatory Scenario
3.3. Effects of Inflation, Russia-Ukraine War, moderating economic growth, and other macroeconomic factors
Chapter 4. Competitive Landscape
4.1. Market Share Analysis
4.1.1. Global Functional Meat Ingredients Market Share by Company, 2023
4.1.2. Product Offerings of Leading Functional Meat Ingredients Companies
4.2. Market Entropy
4.2.1. New Product Launches in the Industry
4.2.2. Mergers, Acquisitions, Joint ventures, and Partnerships
4.3. Key Strategies and Best Practices
Chapter 5. Global Market Projections: Best, Reference, and Low Case Scenarios
5.1. Growth Analysis- Case Scenario Definitions
5.2. Low Growth Case Scenario Forecasts
5.3. Reference Growth Case Scenario Forecasts
5.4. High Growth Case Scenario Forecasts
Chapter 6. Market Dynamics
6.1. Functional Meat Ingredients Market Drivers
6.2. Functional Meat Ingredients Market Challenges
6.6. Functional Meat Ingredients Market Opportunities
6.4. Functional Meat Ingredients Market Trends
Chapter 7. Global Functional Meat Ingredients Market Outlook Trends
7.1. Global Functional Meat Ingredients Revenue (USD Million) and CAGR (%) by Type (2021-2032)
7.2. Global Functional Meat Ingredients Revenue (USD Million) and CAGR (%) by Application (2021-2032)
7.3. Global Functional Meat Ingredients Revenue (USD Million) and CAGR (%) by Product (2021-2032)
By Product
Hydrocolloids
Cereal Flours
Vegetable Fibers
Others
By Meat
Beef
Pork
Mutton
Poultry
Chapter 8. Global Functional Meat Ingredients Regional Analysis and Outlook
8.1. Global Functional Meat Ingredients Revenue (USD Million) By Regions (2021- 2032)
8.2. North America Functional Meat Ingredients Revenue (USD Million) by Country (2021-2032)
8.2.1. United States Functional Meat Ingredients Regional Analysis and Outlook
8.2.2. Canada Functional Meat Ingredients Regional Analysis and Outlook
8.2.3. Mexico Functional Meat Ingredients Regional Analysis and Outlook
8.3. Europe Functional Meat Ingredients Revenue (USD Million), by Country (2021-2032)
8.3.1. Germany Functional Meat Ingredients Regional Analysis and Outlook
8.3.2. France Functional Meat Ingredients Regional Analysis and Outlook
8.3.3. United Kingdom Functional Meat Ingredients Regional Analysis and Outlook
8.3.4. Spain Functional Meat Ingredients Regional Analysis and Outlook
8.3.5. Italy Functional Meat Ingredients Regional Analysis and Outlook
8.3.6. Russia Functional Meat Ingredients Regional Analysis and Outlook
8.3.7. Rest of Europe Functional Meat Ingredients Regional Analysis and Outlook
8.4. Asia Pacific Functional Meat Ingredients Revenue (USD Million) by Country (2021-2032)
8.4.1. China Functional Meat Ingredients Regional Analysis and Outlook
8.4.2. Japan Functional Meat Ingredients Regional Analysis and Outlook
8.4.3. India Functional Meat Ingredients Regional Analysis and Outlook
8.4.4. South Korea Functional Meat Ingredients Regional Analysis and Outlook
8.4.5. Australia Functional Meat Ingredients Regional Analysis and Outlook
8.4.6. South East Asia Functional Meat Ingredients Regional Analysis and Outlook
8.4.7. Rest of Asia Pacific Functional Meat Ingredients Regional Analysis and Outlook
8.5. South America Functional Meat Ingredients Revenue (USD Million), by Country (2021-2032)
8.5.1. Brazil Functional Meat Ingredients Regional Analysis and Outlook
8.5.2. Argentina Functional Meat Ingredients Regional Analysis and Outlook
8.5.3. Rest of South America Functional Meat Ingredients Regional Analysis and Outlook
8.6. Middle East and Africa Functional Meat Ingredients Revenue (USD Million) by Country (2021-2032)
8.6.1. Middle East Functional Meat Ingredients Regional Analysis and Outlook
8.6.2. Africa Functional Meat Ingredients Regional Analysis and Outlook
Chapter 9. North America Functional Meat Ingredients Analysis and Outlook
9.1. North America Functional Meat Ingredients Revenue (USD Million) by Segments (2021-2032)
9.1.1. North America Functional Meat Ingredients Revenue (USD Million) by Type (2021-2032)
9.1.2. North America Functional Meat Ingredients Revenue (USD Million) by Application (2021-2032)
9.1.3. North America Functional Meat Ingredients Revenue (USD Million) by Product (2021-2032)
By Product
Hydrocolloids
Cereal Flours
Vegetable Fibers
Others
By Meat
Beef
Pork
Mutton
Poultry
Chapter 10. Europe Functional Meat Ingredients Analysis and Outlook
10.1. Europe Functional Meat Ingredients Revenue (USD Million), by Segments (USD Million) (2021-2032)
10.1.1. Europe Functional Meat Ingredients Revenue (USD Million) by Type (2021-2032)
10.1.2. Europe Functional Meat Ingredients Revenue (USD Million) by Application (2021-2032)
10.1.3. Europe Functional Meat Ingredients Revenue (USD Million) by Product (2021-2032)
By Product
Hydrocolloids
Cereal Flours
Vegetable Fibers
Others
By Meat
Beef
Pork
Mutton
Poultry
Chapter 11. Asia Pacific Functional Meat Ingredients Analysis and Outlook
11.1. Asia Pacific Functional Meat Ingredients Revenue (USD Million), and Revenue (USD Million) by Segments (2021-2032)
11.1.1. Asia Pacific Functional Meat Ingredients Revenue (USD Million) by Type (2021-2032)
11.1.2. Asia Pacific Functional Meat Ingredients Revenue (USD Million) by Application (2021-2032)
11.1.3. Asia Pacific Functional Meat Ingredients Revenue (USD Million) by Product (2021-2032)
By Product
Hydrocolloids
Cereal Flours
Vegetable Fibers
Others
By Meat
Beef
Pork
Mutton
Poultry
Chapter 12. South America Functional Meat Ingredients Analysis and Outlook
12.1. South America Functional Meat Ingredients Revenue (USD Million), by Segments (2021-2032)
12.1.1. South America Functional Meat Ingredients Revenue (USD Million) by Type (2021-2032)
12.1.2. South America Functional Meat Ingredients Revenue (USD Million) by Application (2021-2032)
12.1.3. South America Functional Meat Ingredients Revenue (USD Million) by Product (2021-2032)
By Product
Hydrocolloids
Cereal Flours
Vegetable Fibers
Others
By Meat
Beef
Pork
Mutton
Poultry
Chapter 13. Middle East and Africa Functional Meat Ingredients Analysis and Outlook
13.1. Middle East and Africa Functional Meat Ingredients Revenue (USD Million), by Segments (2021-2032)
13.1.1. Middle East and Africa Functional Meat Ingredients Revenue (USD Million) by Type (2021-2032)
13.1.2. Middle East and Africa Functional Meat Ingredients Revenue (USD Million) by Application (2021-2032)
13.1.3. Middle East and Africa Functional Meat Ingredients Revenue (USD Million) by Product (2021-2032)
By Product
Hydrocolloids
Cereal Flours
Vegetable Fibers
Others
By Meat
Beef
Pork
Mutton
Poultry
Chapter 14. Functional Meat Ingredients Company Profiles
14.1 Business Overview
14.2 Product Profiles
14.3 SWOT Profiles
14.5 Recent Developments
14.6 Financial Profile
List of Companies
Associated British Foods PLC
Campus SRL
Kerry Group PLC
Proliant Meat Ingredients
Wenda Ingredients
Wiberg GmbH
15. Methodology and Data Sources
15.1 Customization Offerings
15.2 Subscription Services
15.3 Related Reports
15.4 Publisher Expertise
LIST OF TABLES
Table 1 Market Segmentation Analysis
Table 2 Global Functional Meat Ingredients Market Share of Leading Companies, 2023
Table 3 Product Offerings of Leading Companies
Table 4 Low Growth Scenario Forecasts
Table 5 Reference Case Growth Scenario
Table 6 High Growth Case Scenario
Table 7 Global Functional Meat Ingredients Revenue (USD Million) And CAGR (%) By Type (2021-2032)
Table 8 Global Functional Meat Ingredients Revenue (USD Million) And CAGR (%) By Application (2021-2032)
Table 9 Global Functional Meat Ingredients Revenue (USD Million) And CAGR (%) By Product (2021-2032)
Table 10 Global Functional Meat Ingredients Market Revenue (USD Million) By Regions (2021-2032)
Table 11 Global Functional Meat Ingredients Market Share (%) By Regions (2021-2032)
Table 12 North America Functional Meat Ingredients Revenue (USD Million) By Country (2021-2032)
Table 13 Europe Functional Meat Ingredients Revenue (USD Million) By Country (2021-2032)
Table 14 Asia Pacific Functional Meat Ingredients Revenue (USD Million) By Country (2021-2032)
Table 15 South America Functional Meat Ingredients Revenue (USD Million) By Country (2021-2032)
Table 16 Middle East and Africa Functional Meat Ingredients Revenue (USD Million) By Region (2021-2032)
Table 17 North America Functional Meat Ingredients Revenue (USD Million) By Type (2021-2032)
Table 18 North America Functional Meat Ingredients Revenue (USD Million) By Application (2021-2032)
Table 19 North America Functional Meat Ingredients Revenue (USD Million) By Product (2021-2032)
Table 20 Europe Functional Meat Ingredients Revenue (USD Million) By Type (2021-2032)
Table 21 Europe Functional Meat Ingredients Revenue (USD Million) By Application (2021-2032)
Table 22 Europe Functional Meat Ingredients Revenue (USD Million) By Product (2021-2032)
Table 23 Asia Pacific Functional Meat Ingredients Revenue (USD Million) By Type (2021-2032)
Table 24 Asia Pacific Functional Meat Ingredients Revenue (USD Million) By Application (2021-2032)
Table 25 Asia Pacific Functional Meat Ingredients Revenue (USD Million) By Product (2021-2032)
Table 26 South America Functional Meat Ingredients Revenue (USD Million) By Type (2021-2032)
Table 27 South America Functional Meat Ingredients Revenue (USD Million) By Application (2021-2032)
Table 28 South America Functional Meat Ingredients Revenue (USD Million) By Product (2021-2032)
Table 29 Middle East and Africa Functional Meat Ingredients Revenue (USD Million) By Type (2021-2032)
Table 30 Middle East and Africa Functional Meat Ingredients Revenue (USD Million) By Application (2021-2032)
Table 31 Middle East and Africa Functional Meat Ingredients Revenue (USD Million) By Product (2021-2032)
LIST OF FIGURES
Figure 1. Market Scope
Figure 2. Pricing Forecasts Per Unit, 2023- 2032
Figure 3. Porter’s Five Forces
Figure 4. Global Functional Meat Ingredients Market Revenue (USD Million) By Regions (2021-2032)
Figure 5. Global Functional Meat Ingredients Market Share (%) By Regions (2023)
Figure 6. North America Functional Meat Ingredients Revenue (USD Million) By Country (2021-2032)
Figure 7. United States Functional Meat Ingredients Revenue (USD Million) By Country (2021-2032)
Figure 8. Canada Functional Meat Ingredients Revenue (USD Million) By Country (2021-2032)
Figure 9. Mexico Functional Meat Ingredients Revenue (USD Million) By Country (2021-2032)
Figure 10. Europe Functional Meat Ingredients Revenue (USD Million) By Country (2021-2032)
Figure 11. Germany Functional Meat Ingredients Revenue (USD Million) By Country (2021-2032)
Figure 12. France Functional Meat Ingredients Revenue (USD Million) By Country (2021-2032)
Figure 13. United Kingdom Functional Meat Ingredients Revenue (USD Million) By Country (2021-2032)
Figure 14. Spain Functional Meat Ingredients Revenue (USD Million) By Country (2021-2032)
Figure 15. Italy Functional Meat Ingredients Revenue (USD Million) By Country (2021-2032)
Figure 16. Russia Functional Meat Ingredients Revenue (USD Million) By Country (2021-2032)
Figure 17. Rest of Europe Functional Meat Ingredients Revenue (USD Million) By Country (2021-2032)
Figure 11. Asia Pacific Functional Meat Ingredients Revenue (USD Million) By Country (2021-2032)
Figure 12. China Functional Meat Ingredients Revenue (USD Million) By Country (2021-2032)
Figure 13. Japan Functional Meat Ingredients Revenue (USD Million) By Country (2021-2032)
Figure 14. India Functional Meat Ingredients Revenue (USD Million) By Country (2021-2032)
Figure 15. South Korea Functional Meat Ingredients Revenue (USD Million) By Country (2021-2032)
Figure 16. Australia Functional Meat Ingredients Revenue (USD Million) By Country (2021-2032)
Figure 17. South East Asia Functional Meat Ingredients Revenue (USD Million) By Country (2021-2032)
Figure 18. South America Functional Meat Ingredients Revenue (USD Million) By Country (2021-2032)
Figure 19. Brazil Functional Meat Ingredients Revenue (USD Million) By Country (2021-2032)
Figure 20. Argentina Functional Meat Ingredients Revenue (USD Million) By Country (2021-2032)
Figure 21. Rest of Asia Pacific Functional Meat Ingredients Revenue (USD Million) By Country (2021-2032)
Figure 22. Middle East and Africa Functional Meat Ingredients Revenue (USD Million) By Region (2021-2032)
Figure 23. Saudi Arabia Functional Meat Ingredients Revenue (USD Million) By Region (2021-2032)
Figure 24. The UAE Functional Meat Ingredients Revenue (USD Million) By Region (2021-2032)
Figure 25. Rest of Middle East Functional Meat Ingredients Revenue (USD Million) By Region (2021-2032)
Figure 26. South Africa Functional Meat Ingredients Revenue (USD Million) By Region (2021-2032)
Figure 27. Africa Functional Meat Ingredients Revenue (USD Million) By Region (2021-2032)
Figure 28. North America Functional Meat Ingredients Revenue (USD Million) By Type (2021-2032)
Figure 29. North America Functional Meat Ingredients Revenue (USD Million) By Application (2021-2032)
Figure 30. North America Functional Meat Ingredients Revenue (USD Million) By Product (2021-2032)
Figure 31. Europe Functional Meat Ingredients Revenue (USD Million) By Type (2021-2032)
Figure 32. Europe Functional Meat Ingredients Revenue (USD Million) By Application (2021-2032)
Figure 33. Europe Functional Meat Ingredients Revenue (USD Million) By Product (2021-2032)
Figure 34. Asia Pacific Functional Meat Ingredients Revenue (USD Million) By Type (2021-2032)
Figure 35. Asia Pacific Functional Meat Ingredients Revenue (USD Million) By Application (2021-2032)
Figure 36. Asia Pacific Functional Meat Ingredients Revenue (USD Million) By Product (2021-2032)
Figure 37. South America Functional Meat Ingredients Revenue (USD Million) By Type (2021-2032)
Figure 38. South America Functional Meat Ingredients Revenue (USD Million) By Application (2021-2032)
Figure 39. South America Functional Meat Ingredients Revenue (USD Million) By Product (2021-2032)
Figure 40. Middle East and Africa Functional Meat Ingredients Revenue (USD Million) By Type (2021-2032)
Figure 41. Middle East and Africa Functional Meat Ingredients Revenue (USD Million) By Application (2021-2032)
Figure 42. Middle East and Africa Functional Meat Ingredients Revenue (USD Million) By Product (2021-2032)
By Product
Hydrocolloids
Cereal Flours
Vegetable Fibers
Others
By Meat
Beef
Pork
Mutton
Poultry
Countries Analyzed
North America (US, Canada, Mexico)
Europe (Germany, UK, France, Spain, Italy, Russia, Rest of Europe)
Asia Pacific (China, India, Japan, South Korea, Australia, South East Asia, Rest of Asia)
South America (Brazil, Argentina, Rest of South America)
Middle East and Africa (Saudi Arabia, UAE, Rest of Middle East, South Africa, Egypt, Rest of Africa)
