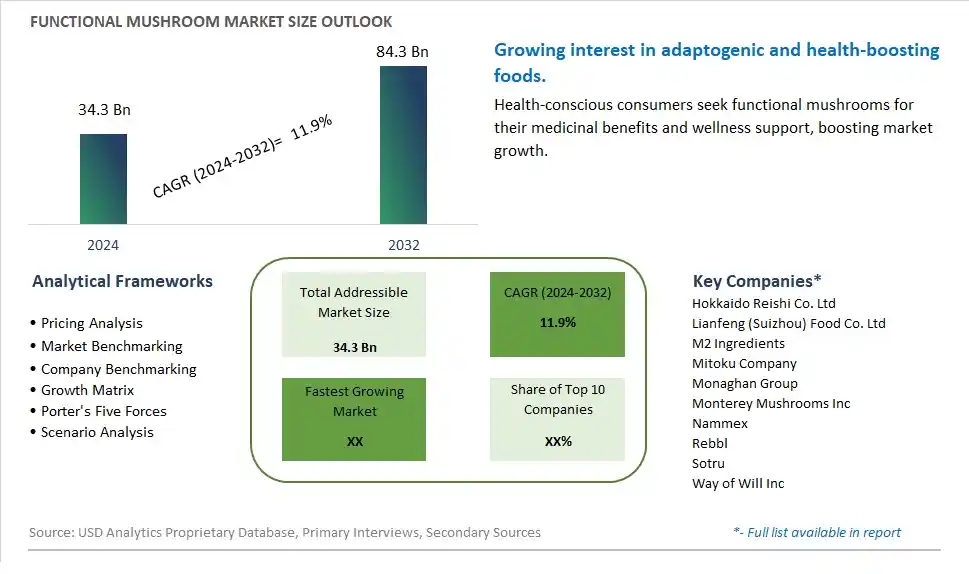
Global Functional Mushroom Market Size is valued at $34.3 Billion in 2024 and is forecast to register a growth rate (CAGR) of 11.9% to reach $84.3 Billion by 2032.
The global Functional Mushroom Market Comprehensive Study analyzes and forecasts the market size across 6 regions and 24 countries for diverse segments -By Product (Reishi, Cordyceps, Lions Mane, Turkey Tail, Shiitake, Chaga, Others), By Application (Food & Beverage, Dietary Supplements, Pharmaceutical, Others)
An Introduction to Functional Mushroom Market
The functional mushroom market is thriving in 2024, driven by growing consumer interest in natural health and wellness products. Functional mushrooms, such as reishi, chaga, and lion's mane, have gained popularity for their potential health benefits, including immune support, cognitive enhancement, and stress reduction. With increasing awareness of the therapeutic properties of mushrooms, consumers are incorporating them into their diets through supplements, powders, teas, and functional foods. Moreover, scientific research continues to uncover new bioactive compounds and health-promoting properties of mushrooms, fueling innovation in product development and formulation. As the demand for natural and plant-based remedies grows, the functional mushroom market is poised for continued expansion and diversification in the coming years.
Functional Mushroom Competitive Landscape
The market report analyses the leading companies in the industry including Hokkaido Reishi Co. Ltd, Lianfeng (Suizhou) Food Co. Ltd, M2 Ingredients, Mitoku Company, Monaghan Group, Monterey Mushrooms Inc, Nammex, Rebbl, Sotru, Way of Will Inc, and Others.
Functional Mushroom Market Dynamics
Functional Mushroom Market Trend: Surging Interest in Functional Foods and Natural Health Solutions
The market trend for functional mushrooms reflects a surging interest in functional foods and natural health solutions among consumers worldwide. Functional mushrooms, such as reishi, chaga, lion's mane, and cordyceps, have gained popularity for their potential health benefits, including immune support, cognitive enhancement, stress reduction, and energy boost. As consumers increasingly prioritize holistic approaches to health and wellness, there is growing demand for products that offer nutritional and functional benefits beyond basic sustenance. This trend is driven by factors such as rising health consciousness, aging populations seeking preventive healthcare solutions, and a growing body of scientific research supporting the efficacy of functional mushrooms in promoting overall well-being.
Market Driver: Consumer Demand for Natural and Plant-Based Supplements
The market for functional mushrooms is primarily driven by consumer demand for natural and plant-based supplements as part of a healthy lifestyle. With a growing emphasis on clean label products and transparency in ingredient sourcing, consumers are turning to natural remedies and botanicals to support their health goals. Functional mushrooms, revered for their long history of use in traditional medicine systems such as Traditional Chinese Medicine (TCM) and Ayurveda, align with the clean label movement's principles and resonate with consumers seeking alternative remedies to synthetic pharmaceuticals. Additionally, the rise of plant-based diets and the desire for sustainable dietary choices contribute to the appeal of functional mushrooms as versatile and nutrient-rich ingredients in supplements, beverages, teas, and functional foods.
Market Opportunity: Innovation in Product Formulations and Delivery Formats
An opportunity for the functional mushroom market lies in innovation in product formulations and delivery formats to cater to evolving consumer preferences and market trends. Manufacturers can capitalize on the growing demand for functional mushrooms by developing innovative and convenient products that offer superior efficacy, taste, and user experience. This includes exploring novel extraction techniques to maximize the bioavailability of bioactive compounds in mushrooms, formulating synergistic blends with other botanicals and functional ingredients for targeted health benefits, and creating diverse delivery formats such as capsules, powders, tinctures, beverages, and ready-to-eat snacks. By leveraging advancements in food science, technology, and product development, companies can differentiate their offerings, expand market reach, and capitalize on the burgeoning demand for functional mushroom products in the health and wellness sector.
Functional Mushroom Market Share Analysis: Cordyceps is the Fastest Growing Segment to 2032
Cordyceps is expected to be the fastest-growing segment in the Functional Mushroom Market by product to 2032. The demand for cordyceps is driven by its potential health benefits, including enhanced energy, improved respiratory function, and immune support. Cordyceps is increasingly used in dietary supplements, functional foods, and beverages, appealing to consumers seeking natural and health-promoting ingredients. Additionally, advancements in mushroom cultivation and processing technology contribute to the segment's rapid growth. The expansion of product offerings and the increasing availability of cordyceps-based products in various retail channels support the growth of this segment.
Functional Mushroom Market by Application: Dietary Supplements is the Fastest Growing Segment to 2032
Dietary supplements are anticipated to be the fastest-growing segment in the Functional Mushroom Market by application to 2032. The demand for functional mushrooms in dietary supplements is driven by the increasing awareness of their health benefits, including immune support, cognitive function, and stress relief. Consumers are seeking natural and effective supplements to enhance their overall well-being. Additionally, advancements in supplement formulations and the development of high-quality, standardized mushroom extracts contribute to the segment's rapid growth. The expansion of the dietary supplements market and the increasing incorporation of functional mushrooms in various formulations support the growth of this segment.
Functional Mushroom Market Segmentation
By Product
Reishi
Cordyceps
Lions Mane
Turkey Tail
Shiitake
Chaga
Others
By Application
Food & Beverage
Dietary Supplements
Pharmaceutical
Others
Countries Analyzed
North America (US, Canada, Mexico)
Europe (Germany, UK, France, Spain, Italy, Russia, Rest of Europe)
Asia Pacific (China, India, Japan, South Korea, Australia, South East Asia, Rest of Asia)
South America (Brazil, Argentina, Rest of South America)
Middle East and Africa (Saudi Arabia, UAE, Rest of Middle East, South Africa, Egypt, Rest of Africa)
Functional Mushroom Companies Profiled in the Study
Hokkaido Reishi Co. Ltd
Lianfeng (Suizhou) Food Co. Ltd
M2 Ingredients
Mitoku Company
Monaghan Group
Monterey Mushrooms Inc
Nammex
Rebbl
Sotru
Way of Will Inc
*- List Not Exhaustive
Chapter 1. TABLE OF CONTENTS
Chapter 2. Introduction to Functional Mushroom Market
2.1. Market Overview
2.2. Key Statistics and Report Highlights
2.3. Scope of the Comprehensive Study
2.3.1. Market Definition
2.3.2 Countries and Regions Covered
2.3.3 Research Objective
2.3.4 Units, Currency, and Conversions
2.3.5 Industry Value Chain
2.4. Key Market Segments
2.5. Key Companies
2.6. Study Period
Chapter 3. Strategic Analysis Review
3.1. Functional Mushroom Pricing Analysis and Forecast
3.2. Porter’s Five Forces
3.3. Market Ecosystem
3.4. SWOT Analysis
3.5. Regulatory Scenario
3.3. Effects of Inflation, Russia-Ukraine War, moderating economic growth, and other macroeconomic factors
Chapter 4. Competitive Landscape
4.1. Market Share Analysis
4.1.1. Global Functional Mushroom Market Share by Company, 2023
4.1.2. Product Offerings of Leading Functional Mushroom Companies
4.2. Market Entropy
4.2.1. New Product Launches in the Industry
4.2.2. Mergers, Acquisitions, Joint ventures, and Partnerships
4.3. Key Strategies and Best Practices
Chapter 5. Global Market Projections: Best, Reference, and Low Case Scenarios
5.1. Growth Analysis- Case Scenario Definitions
5.2. Low Growth Case Scenario Forecasts
5.3. Reference Growth Case Scenario Forecasts
5.4. High Growth Case Scenario Forecasts
Chapter 6. Market Dynamics
6.1. Functional Mushroom Market Drivers
6.2. Functional Mushroom Market Challenges
6.6. Functional Mushroom Market Opportunities
6.4. Functional Mushroom Market Trends
Chapter 7. Global Functional Mushroom Market Outlook Trends
7.1. Global Functional Mushroom Revenue (USD Million) and CAGR (%) by Type (2021-2032)
7.2. Global Functional Mushroom Revenue (USD Million) and CAGR (%) by Application (2021-2032)
7.3. Global Functional Mushroom Revenue (USD Million) and CAGR (%) by Product (2021-2032)
By Product
Reishi
Cordyceps
Lions Mane
Turkey Tail
Shiitake
Chaga
Others
By Application
Food & Beverage
Dietary Supplements
Pharmaceutical
Others
Chapter 8. Global Functional Mushroom Regional Analysis and Outlook
8.1. Global Functional Mushroom Revenue (USD Million) By Regions (2021- 2032)
8.2. North America Functional Mushroom Revenue (USD Million) by Country (2021-2032)
8.2.1. United States Functional Mushroom Regional Analysis and Outlook
8.2.2. Canada Functional Mushroom Regional Analysis and Outlook
8.2.3. Mexico Functional Mushroom Regional Analysis and Outlook
8.3. Europe Functional Mushroom Revenue (USD Million), by Country (2021-2032)
8.3.1. Germany Functional Mushroom Regional Analysis and Outlook
8.3.2. France Functional Mushroom Regional Analysis and Outlook
8.3.3. United Kingdom Functional Mushroom Regional Analysis and Outlook
8.3.4. Spain Functional Mushroom Regional Analysis and Outlook
8.3.5. Italy Functional Mushroom Regional Analysis and Outlook
8.3.6. Russia Functional Mushroom Regional Analysis and Outlook
8.3.7. Rest of Europe Functional Mushroom Regional Analysis and Outlook
8.4. Asia Pacific Functional Mushroom Revenue (USD Million) by Country (2021-2032)
8.4.1. China Functional Mushroom Regional Analysis and Outlook
8.4.2. Japan Functional Mushroom Regional Analysis and Outlook
8.4.3. India Functional Mushroom Regional Analysis and Outlook
8.4.4. South Korea Functional Mushroom Regional Analysis and Outlook
8.4.5. Australia Functional Mushroom Regional Analysis and Outlook
8.4.6. South East Asia Functional Mushroom Regional Analysis and Outlook
8.4.7. Rest of Asia Pacific Functional Mushroom Regional Analysis and Outlook
8.5. South America Functional Mushroom Revenue (USD Million), by Country (2021-2032)
8.5.1. Brazil Functional Mushroom Regional Analysis and Outlook
8.5.2. Argentina Functional Mushroom Regional Analysis and Outlook
8.5.3. Rest of South America Functional Mushroom Regional Analysis and Outlook
8.6. Middle East and Africa Functional Mushroom Revenue (USD Million) by Country (2021-2032)
8.6.1. Middle East Functional Mushroom Regional Analysis and Outlook
8.6.2. Africa Functional Mushroom Regional Analysis and Outlook
Chapter 9. North America Functional Mushroom Analysis and Outlook
9.1. North America Functional Mushroom Revenue (USD Million) by Segments (2021-2032)
9.1.1. North America Functional Mushroom Revenue (USD Million) by Type (2021-2032)
9.1.2. North America Functional Mushroom Revenue (USD Million) by Application (2021-2032)
9.1.3. North America Functional Mushroom Revenue (USD Million) by Product (2021-2032)
By Product
Reishi
Cordyceps
Lions Mane
Turkey Tail
Shiitake
Chaga
Others
By Application
Food & Beverage
Dietary Supplements
Pharmaceutical
Others
Chapter 10. Europe Functional Mushroom Analysis and Outlook
10.1. Europe Functional Mushroom Revenue (USD Million), by Segments (USD Million) (2021-2032)
10.1.1. Europe Functional Mushroom Revenue (USD Million) by Type (2021-2032)
10.1.2. Europe Functional Mushroom Revenue (USD Million) by Application (2021-2032)
10.1.3. Europe Functional Mushroom Revenue (USD Million) by Product (2021-2032)
By Product
Reishi
Cordyceps
Lions Mane
Turkey Tail
Shiitake
Chaga
Others
By Application
Food & Beverage
Dietary Supplements
Pharmaceutical
Others
Chapter 11. Asia Pacific Functional Mushroom Analysis and Outlook
11.1. Asia Pacific Functional Mushroom Revenue (USD Million), and Revenue (USD Million) by Segments (2021-2032)
11.1.1. Asia Pacific Functional Mushroom Revenue (USD Million) by Type (2021-2032)
11.1.2. Asia Pacific Functional Mushroom Revenue (USD Million) by Application (2021-2032)
11.1.3. Asia Pacific Functional Mushroom Revenue (USD Million) by Product (2021-2032)
By Product
Reishi
Cordyceps
Lions Mane
Turkey Tail
Shiitake
Chaga
Others
By Application
Food & Beverage
Dietary Supplements
Pharmaceutical
Others
Chapter 12. South America Functional Mushroom Analysis and Outlook
12.1. South America Functional Mushroom Revenue (USD Million), by Segments (2021-2032)
12.1.1. South America Functional Mushroom Revenue (USD Million) by Type (2021-2032)
12.1.2. South America Functional Mushroom Revenue (USD Million) by Application (2021-2032)
12.1.3. South America Functional Mushroom Revenue (USD Million) by Product (2021-2032)
By Product
Reishi
Cordyceps
Lions Mane
Turkey Tail
Shiitake
Chaga
Others
By Application
Food & Beverage
Dietary Supplements
Pharmaceutical
Others
Chapter 13. Middle East and Africa Functional Mushroom Analysis and Outlook
13.1. Middle East and Africa Functional Mushroom Revenue (USD Million), by Segments (2021-2032)
13.1.1. Middle East and Africa Functional Mushroom Revenue (USD Million) by Type (2021-2032)
13.1.2. Middle East and Africa Functional Mushroom Revenue (USD Million) by Application (2021-2032)
13.1.3. Middle East and Africa Functional Mushroom Revenue (USD Million) by Product (2021-2032)
By Product
Reishi
Cordyceps
Lions Mane
Turkey Tail
Shiitake
Chaga
Others
By Application
Food & Beverage
Dietary Supplements
Pharmaceutical
Others
Chapter 14. Functional Mushroom Company Profiles
14.1 Business Overview
14.2 Product Profiles
14.3 SWOT Profiles
14.5 Recent Developments
14.6 Financial Profile
List of Companies
Hokkaido Reishi Co. Ltd
Lianfeng (Suizhou) Food Co. Ltd
M2 Ingredients
Mitoku Company
Monaghan Group
Monterey Mushrooms Inc
Nammex
Rebbl
Sotru
Way of Will Inc
15. Methodology and Data Sources
15.1 Customization Offerings
15.2 Subscription Services
15.3 Related Reports
15.4 Publisher Expertise
LIST OF TABLES
Table 1 Market Segmentation Analysis
Table 2 Global Functional Mushroom Market Share of Leading Companies, 2023
Table 3 Product Offerings of Leading Companies
Table 4 Low Growth Scenario Forecasts
Table 5 Reference Case Growth Scenario
Table 6 High Growth Case Scenario
Table 7 Global Functional Mushroom Revenue (USD Million) And CAGR (%) By Type (2021-2032)
Table 8 Global Functional Mushroom Revenue (USD Million) And CAGR (%) By Application (2021-2032)
Table 9 Global Functional Mushroom Revenue (USD Million) And CAGR (%) By Product (2021-2032)
Table 10 Global Functional Mushroom Market Revenue (USD Million) By Regions (2021-2032)
Table 11 Global Functional Mushroom Market Share (%) By Regions (2021-2032)
Table 12 North America Functional Mushroom Revenue (USD Million) By Country (2021-2032)
Table 13 Europe Functional Mushroom Revenue (USD Million) By Country (2021-2032)
Table 14 Asia Pacific Functional Mushroom Revenue (USD Million) By Country (2021-2032)
Table 15 South America Functional Mushroom Revenue (USD Million) By Country (2021-2032)
Table 16 Middle East and Africa Functional Mushroom Revenue (USD Million) By Region (2021-2032)
Table 17 North America Functional Mushroom Revenue (USD Million) By Type (2021-2032)
Table 18 North America Functional Mushroom Revenue (USD Million) By Application (2021-2032)
Table 19 North America Functional Mushroom Revenue (USD Million) By Product (2021-2032)
Table 20 Europe Functional Mushroom Revenue (USD Million) By Type (2021-2032)
Table 21 Europe Functional Mushroom Revenue (USD Million) By Application (2021-2032)
Table 22 Europe Functional Mushroom Revenue (USD Million) By Product (2021-2032)
Table 23 Asia Pacific Functional Mushroom Revenue (USD Million) By Type (2021-2032)
Table 24 Asia Pacific Functional Mushroom Revenue (USD Million) By Application (2021-2032)
Table 25 Asia Pacific Functional Mushroom Revenue (USD Million) By Product (2021-2032)
Table 26 South America Functional Mushroom Revenue (USD Million) By Type (2021-2032)
Table 27 South America Functional Mushroom Revenue (USD Million) By Application (2021-2032)
Table 28 South America Functional Mushroom Revenue (USD Million) By Product (2021-2032)
Table 29 Middle East and Africa Functional Mushroom Revenue (USD Million) By Type (2021-2032)
Table 30 Middle East and Africa Functional Mushroom Revenue (USD Million) By Application (2021-2032)
Table 31 Middle East and Africa Functional Mushroom Revenue (USD Million) By Product (2021-2032)
LIST OF FIGURES
Figure 1. Market Scope
Figure 2. Pricing Forecasts Per Unit, 2023- 2032
Figure 3. Porter’s Five Forces
Figure 4. Global Functional Mushroom Market Revenue (USD Million) By Regions (2021-2032)
Figure 5. Global Functional Mushroom Market Share (%) By Regions (2023)
Figure 6. North America Functional Mushroom Revenue (USD Million) By Country (2021-2032)
Figure 7. United States Functional Mushroom Revenue (USD Million) By Country (2021-2032)
Figure 8. Canada Functional Mushroom Revenue (USD Million) By Country (2021-2032)
Figure 9. Mexico Functional Mushroom Revenue (USD Million) By Country (2021-2032)
Figure 10. Europe Functional Mushroom Revenue (USD Million) By Country (2021-2032)
Figure 11. Germany Functional Mushroom Revenue (USD Million) By Country (2021-2032)
Figure 12. France Functional Mushroom Revenue (USD Million) By Country (2021-2032)
Figure 13. United Kingdom Functional Mushroom Revenue (USD Million) By Country (2021-2032)
Figure 14. Spain Functional Mushroom Revenue (USD Million) By Country (2021-2032)
Figure 15. Italy Functional Mushroom Revenue (USD Million) By Country (2021-2032)
Figure 16. Russia Functional Mushroom Revenue (USD Million) By Country (2021-2032)
Figure 17. Rest of Europe Functional Mushroom Revenue (USD Million) By Country (2021-2032)
Figure 11. Asia Pacific Functional Mushroom Revenue (USD Million) By Country (2021-2032)
Figure 12. China Functional Mushroom Revenue (USD Million) By Country (2021-2032)
Figure 13. Japan Functional Mushroom Revenue (USD Million) By Country (2021-2032)
Figure 14. India Functional Mushroom Revenue (USD Million) By Country (2021-2032)
Figure 15. South Korea Functional Mushroom Revenue (USD Million) By Country (2021-2032)
Figure 16. Australia Functional Mushroom Revenue (USD Million) By Country (2021-2032)
Figure 17. South East Asia Functional Mushroom Revenue (USD Million) By Country (2021-2032)
Figure 18. South America Functional Mushroom Revenue (USD Million) By Country (2021-2032)
Figure 19. Brazil Functional Mushroom Revenue (USD Million) By Country (2021-2032)
Figure 20. Argentina Functional Mushroom Revenue (USD Million) By Country (2021-2032)
Figure 21. Rest of Asia Pacific Functional Mushroom Revenue (USD Million) By Country (2021-2032)
Figure 22. Middle East and Africa Functional Mushroom Revenue (USD Million) By Region (2021-2032)
Figure 23. Saudi Arabia Functional Mushroom Revenue (USD Million) By Region (2021-2032)
Figure 24. The UAE Functional Mushroom Revenue (USD Million) By Region (2021-2032)
Figure 25. Rest of Middle East Functional Mushroom Revenue (USD Million) By Region (2021-2032)
Figure 26. South Africa Functional Mushroom Revenue (USD Million) By Region (2021-2032)
Figure 27. Africa Functional Mushroom Revenue (USD Million) By Region (2021-2032)
Figure 28. North America Functional Mushroom Revenue (USD Million) By Type (2021-2032)
Figure 29. North America Functional Mushroom Revenue (USD Million) By Application (2021-2032)
Figure 30. North America Functional Mushroom Revenue (USD Million) By Product (2021-2032)
Figure 31. Europe Functional Mushroom Revenue (USD Million) By Type (2021-2032)
Figure 32. Europe Functional Mushroom Revenue (USD Million) By Application (2021-2032)
Figure 33. Europe Functional Mushroom Revenue (USD Million) By Product (2021-2032)
Figure 34. Asia Pacific Functional Mushroom Revenue (USD Million) By Type (2021-2032)
Figure 35. Asia Pacific Functional Mushroom Revenue (USD Million) By Application (2021-2032)
Figure 36. Asia Pacific Functional Mushroom Revenue (USD Million) By Product (2021-2032)
Figure 37. South America Functional Mushroom Revenue (USD Million) By Type (2021-2032)
Figure 38. South America Functional Mushroom Revenue (USD Million) By Application (2021-2032)
Figure 39. South America Functional Mushroom Revenue (USD Million) By Product (2021-2032)
Figure 40. Middle East and Africa Functional Mushroom Revenue (USD Million) By Type (2021-2032)
Figure 41. Middle East and Africa Functional Mushroom Revenue (USD Million) By Application (2021-2032)
Figure 42. Middle East and Africa Functional Mushroom Revenue (USD Million) By Product (2021-2032)
By Product
Reishi
Cordyceps
Lions Mane
Turkey Tail
Shiitake
Chaga
Others
By Application
Food & Beverage
Dietary Supplements
Pharmaceutical
Others
Countries Analyzed
North America (US, Canada, Mexico)
Europe (Germany, UK, France, Spain, Italy, Russia, Rest of Europe)
Asia Pacific (China, India, Japan, South Korea, Australia, South East Asia, Rest of Asia)
South America (Brazil, Argentina, Rest of South America)
Middle East and Africa (Saudi Arabia, UAE, Rest of Middle East, South Africa, Egypt, Rest of Africa)
