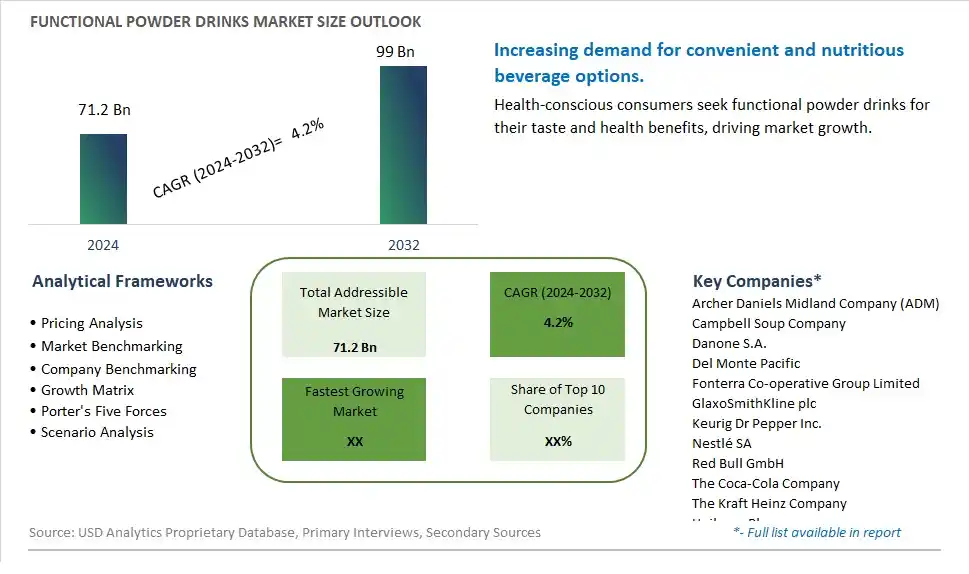
Global Functional Powder Drinks Market Size is valued at $71.2 Billion in 2024 and is forecast to register a growth rate (CAGR) of 4.2% to reach $99 Billion by 2032.
The global Functional Powder Drinks Market Comprehensive Study analyzes and forecasts the market size across 6 regions and 24 countries for diverse segments -By Type (Refreshment Beverages, Carbonated Soft Drinks, Fruit Beverages, Others), By Application (Commercial, Household)
An Introduction to Functional Powder Drinks Market
In 2024, the Functional Powder Drinks market is witnessing robust growth, driven by the rising demand for convenient and health-enhancing beverage options. Functional powder drinks, enriched with proteins, vitamins, minerals, and other beneficial compounds, cater to health-conscious consumers and those with active lifestyles. The market benefits from advancements in powder formulation and packaging technologies, the growing trend of functional and fortified beverages, and the expansion of the global health and wellness sector. Additionally, the increasing focus on personalized nutrition and clean label ingredients in functional powder drinks is contributing to market growth.
Functional Powder Drinks Competitive Landscape
The market report analyses the leading companies in the industry including Archer Daniels Midland Company (ADM), Campbell Soup Company, Danone S.A., Del Monte Pacific, Fonterra Co-operative Group Limited, GlaxoSmithKline plc, Keurig Dr Pepper Inc., Nestlé SA, Red Bull GmbH, The Coca-Cola Company, The Kraft Heinz Company, Unilever Plc, Yakult Honsha Co., Ltd., and Others.
Functional Powder Drinks Market Dynamics
Functional Powder Drinks Market Trend: Increasing Popularity of Nutritional Convenience
The most prominent trend in the Functional Powder Drinks Market is the increasing popularity of nutritional convenience. As consumers lead busier lives, there is a growing demand for quick and easy solutions to meet their dietary needs. Functional powder drinks, which can be easily mixed with water or other liquids, provide a convenient way to consume essential nutrients, vitamins, and minerals on the go. This trend is driven by the desire for products that support health and wellness without requiring significant time or effort.
Functional Powder Drinks Market Driver: Growth in Health and Wellness Consciousness
The key driver of the Functional Powder Drinks Market is the growth in health and wellness consciousness among consumers. As people become more aware of the importance of maintaining a balanced diet and overall health, they are increasingly turning to functional powder drinks that offer targeted health benefits, such as energy boosting, weight management, and immune support. This driver is supported by the rising interest in preventative healthcare and the use of functional foods to address specific health concerns.
Functional Powder Drinks Market Opportunity: Expansion into Customized Nutrition Solutions
A significant opportunity in the Functional Powder Drinks Market lies in the expansion into customized nutrition solutions. By offering products that cater to individual dietary needs and preferences, such as vegan, gluten-free, or tailored to specific health goals, companies can attract a broader consumer base. Personalized nutrition solutions that allow consumers to choose ingredients based on their unique health requirements can enhance customer loyalty and drive market growth.
Functional Powder Drinks Market Share Analysis: Household is the fastest growing segment over the forecast period to 2032
The Household segment is the fastest-growing within the Functional Powder Drinks Market by application, projected to experience significant growth up to 2032. This rapid expansion is driven by the increasing consumer preference for convenient, health-oriented beverage options that can be easily prepared at home. Functional powder drinks offer a practical solution for individuals seeking to enhance their nutritional intake without the need for elaborate preparation. These powders are designed to be mixed with water, milk, or other liquids, providing a quick and effective way to consume essential nutrients, vitamins, and minerals. The rise of health-consciousness among consumers, coupled with the growing trend of at-home wellness routines, has significantly boosted the demand for functional powder drinks in the household segment. Additionally, the Past few yearshas accelerated the shift towards home-based health and fitness regimes, further driving the popularity of these products. Innovations in flavor, packaging, and formulation to cater to diverse dietary needs and preferences also contribute to the segment's robust growth. As consumers continue to prioritize convenience and health, the household segment is expected to maintain its rapid growth, solidifying its position as the fastest-growing application in the functional powder drinks market.
Functional Powder Drinks Market Share Analysis: Fruit Beverages segment generated the highest revenue share in the industry
Fruit Beverages are the largest segment within the Functional Powder Drinks Market by type. This segment's dominance is attributed to the widespread popularity and consumer preference for fruit-flavored drinks that combine refreshing taste with health benefits. Functional fruit powder drinks are enriched with vitamins, minerals, and antioxidants derived from various fruits, making them an appealing choice for health-conscious consumers. The versatility of fruit beverages allows for a wide range of flavor combinations and nutritional profiles, catering to different consumer tastes and dietary needs. The convenience of fruit powder drinks, which can be easily mixed with water or other liquids, enhances their appeal for on-the-go consumption and quick, nutritious hydration. Additionally, the increasing demand for natural and clean-label products has further boosted the popularity of fruit-based functional powder drinks. The combination of taste, health benefits, and convenience ensures that fruit beverages remain the largest segment in the functional powder drinks market.
Functional Powder Drinks Market Segmentation
By Type
Refreshment Beverages
Carbonated Soft Drinks
Fruit Beverages
Others
By Application
Commercial
Household
Countries Analyzed
North America (US, Canada, Mexico)
Europe (Germany, UK, France, Spain, Italy, Russia, Rest of Europe)
Asia Pacific (China, India, Japan, South Korea, Australia, South East Asia, Rest of Asia)
South America (Brazil, Argentina, Rest of South America)
Middle East and Africa (Saudi Arabia, UAE, Rest of Middle East, South Africa, Egypt, Rest of Africa)
Functional Powder Drinks Companies Profiled in the Study
Archer Daniels Midland Company (ADM)
Campbell Soup Company
Danone S.A.
Del Monte Pacific
Fonterra Co-operative Group Limited
GlaxoSmithKline plc
Keurig Dr Pepper Inc.
Nestlé SA
Red Bull GmbH
The Coca-Cola Company
The Kraft Heinz Company
Unilever Plc
Yakult Honsha Co., Ltd.
*- List Not Exhaustive
Chapter 1. TABLE OF CONTENTS
Chapter 2. Introduction to Functional Powder Drinks Market
2.1. Market Overview
2.2. Key Statistics and Report Highlights
2.3. Scope of the Comprehensive Study
2.3.1. Market Definition
2.3.2 Countries and Regions Covered
2.3.3 Research Objective
2.3.4 Units, Currency, and Conversions
2.3.5 Industry Value Chain
2.4. Key Market Segments
2.5. Key Companies
2.6. Study Period
Chapter 3. Strategic Analysis Review
3.1. Functional Powder Drinks Pricing Analysis and Forecast
3.2. Porter’s Five Forces
3.3. Market Ecosystem
3.4. SWOT Analysis
3.5. Regulatory Scenario
3.3. Effects of Inflation, Russia-Ukraine War, moderating economic growth, and other macroeconomic factors
Chapter 4. Competitive Landscape
4.1. Market Share Analysis
4.1.1. Global Functional Powder Drinks Market Share by Company, 2023
4.1.2. Product Offerings of Leading Functional Powder Drinks Companies
4.2. Market Entropy
4.2.1. New Product Launches in the Industry
4.2.2. Mergers, Acquisitions, Joint ventures, and Partnerships
4.3. Key Strategies and Best Practices
Chapter 5. Global Market Projections: Best, Reference, and Low Case Scenarios
5.1. Growth Analysis- Case Scenario Definitions
5.2. Low Growth Case Scenario Forecasts
5.3. Reference Growth Case Scenario Forecasts
5.4. High Growth Case Scenario Forecasts
Chapter 6. Market Dynamics
6.1. Functional Powder Drinks Market Drivers
6.2. Functional Powder Drinks Market Challenges
6.6. Functional Powder Drinks Market Opportunities
6.4. Functional Powder Drinks Market Trends
Chapter 7. Global Functional Powder Drinks Market Outlook Trends
7.1. Global Functional Powder Drinks Revenue (USD Million) and CAGR (%) by Type (2021-2032)
7.2. Global Functional Powder Drinks Revenue (USD Million) and CAGR (%) by Application (2021-2032)
7.3. Global Functional Powder Drinks Revenue (USD Million) and CAGR (%) by Product (2021-2032)
By Type
Refreshment Beverages
Carbonated Soft Drinks
Fruit Beverages
Others
By Application
Commercial
Household
Chapter 8. Global Functional Powder Drinks Regional Analysis and Outlook
8.1. Global Functional Powder Drinks Revenue (USD Million) By Regions (2021- 2032)
8.2. North America Functional Powder Drinks Revenue (USD Million) by Country (2021-2032)
8.2.1. United States Functional Powder Drinks Regional Analysis and Outlook
8.2.2. Canada Functional Powder Drinks Regional Analysis and Outlook
8.2.3. Mexico Functional Powder Drinks Regional Analysis and Outlook
8.3. Europe Functional Powder Drinks Revenue (USD Million), by Country (2021-2032)
8.3.1. Germany Functional Powder Drinks Regional Analysis and Outlook
8.3.2. France Functional Powder Drinks Regional Analysis and Outlook
8.3.3. United Kingdom Functional Powder Drinks Regional Analysis and Outlook
8.3.4. Spain Functional Powder Drinks Regional Analysis and Outlook
8.3.5. Italy Functional Powder Drinks Regional Analysis and Outlook
8.3.6. Russia Functional Powder Drinks Regional Analysis and Outlook
8.3.7. Rest of Europe Functional Powder Drinks Regional Analysis and Outlook
8.4. Asia Pacific Functional Powder Drinks Revenue (USD Million) by Country (2021-2032)
8.4.1. China Functional Powder Drinks Regional Analysis and Outlook
8.4.2. Japan Functional Powder Drinks Regional Analysis and Outlook
8.4.3. India Functional Powder Drinks Regional Analysis and Outlook
8.4.4. South Korea Functional Powder Drinks Regional Analysis and Outlook
8.4.5. Australia Functional Powder Drinks Regional Analysis and Outlook
8.4.6. South East Asia Functional Powder Drinks Regional Analysis and Outlook
8.4.7. Rest of Asia Pacific Functional Powder Drinks Regional Analysis and Outlook
8.5. South America Functional Powder Drinks Revenue (USD Million), by Country (2021-2032)
8.5.1. Brazil Functional Powder Drinks Regional Analysis and Outlook
8.5.2. Argentina Functional Powder Drinks Regional Analysis and Outlook
8.5.3. Rest of South America Functional Powder Drinks Regional Analysis and Outlook
8.6. Middle East and Africa Functional Powder Drinks Revenue (USD Million) by Country (2021-2032)
8.6.1. Middle East Functional Powder Drinks Regional Analysis and Outlook
8.6.2. Africa Functional Powder Drinks Regional Analysis and Outlook
Chapter 9. North America Functional Powder Drinks Analysis and Outlook
9.1. North America Functional Powder Drinks Revenue (USD Million) by Segments (2021-2032)
9.1.1. North America Functional Powder Drinks Revenue (USD Million) by Type (2021-2032)
9.1.2. North America Functional Powder Drinks Revenue (USD Million) by Application (2021-2032)
9.1.3. North America Functional Powder Drinks Revenue (USD Million) by Product (2021-2032)
By Type
Refreshment Beverages
Carbonated Soft Drinks
Fruit Beverages
Others
By Application
Commercial
Household
Chapter 10. Europe Functional Powder Drinks Analysis and Outlook
10.1. Europe Functional Powder Drinks Revenue (USD Million), by Segments (USD Million) (2021-2032)
10.1.1. Europe Functional Powder Drinks Revenue (USD Million) by Type (2021-2032)
10.1.2. Europe Functional Powder Drinks Revenue (USD Million) by Application (2021-2032)
10.1.3. Europe Functional Powder Drinks Revenue (USD Million) by Product (2021-2032)
By Type
Refreshment Beverages
Carbonated Soft Drinks
Fruit Beverages
Others
By Application
Commercial
Household
Chapter 11. Asia Pacific Functional Powder Drinks Analysis and Outlook
11.1. Asia Pacific Functional Powder Drinks Revenue (USD Million), and Revenue (USD Million) by Segments (2021-2032)
11.1.1. Asia Pacific Functional Powder Drinks Revenue (USD Million) by Type (2021-2032)
11.1.2. Asia Pacific Functional Powder Drinks Revenue (USD Million) by Application (2021-2032)
11.1.3. Asia Pacific Functional Powder Drinks Revenue (USD Million) by Product (2021-2032)
By Type
Refreshment Beverages
Carbonated Soft Drinks
Fruit Beverages
Others
By Application
Commercial
Household
Chapter 12. South America Functional Powder Drinks Analysis and Outlook
12.1. South America Functional Powder Drinks Revenue (USD Million), by Segments (2021-2032)
12.1.1. South America Functional Powder Drinks Revenue (USD Million) by Type (2021-2032)
12.1.2. South America Functional Powder Drinks Revenue (USD Million) by Application (2021-2032)
12.1.3. South America Functional Powder Drinks Revenue (USD Million) by Product (2021-2032)
By Type
Refreshment Beverages
Carbonated Soft Drinks
Fruit Beverages
Others
By Application
Commercial
Household
Chapter 13. Middle East and Africa Functional Powder Drinks Analysis and Outlook
13.1. Middle East and Africa Functional Powder Drinks Revenue (USD Million), by Segments (2021-2032)
13.1.1. Middle East and Africa Functional Powder Drinks Revenue (USD Million) by Type (2021-2032)
13.1.2. Middle East and Africa Functional Powder Drinks Revenue (USD Million) by Application (2021-2032)
13.1.3. Middle East and Africa Functional Powder Drinks Revenue (USD Million) by Product (2021-2032)
By Type
Refreshment Beverages
Carbonated Soft Drinks
Fruit Beverages
Others
By Application
Commercial
Household
Chapter 14. Functional Powder Drinks Company Profiles
14.1 Business Overview
14.2 Product Profiles
14.3 SWOT Profiles
14.5 Recent Developments
14.6 Financial Profile
List of Companies
Archer Daniels Midland Company (ADM)
Campbell Soup Company
Danone S.A.
Del Monte Pacific
Fonterra Co-operative Group Limited
GlaxoSmithKline plc
Keurig Dr Pepper Inc.
Nestlé SA
Red Bull GmbH
The Coca-Cola Company
The Kraft Heinz Company
Unilever Plc
Yakult Honsha Co., Ltd.
15. Methodology and Data Sources
15.1 Customization Offerings
15.2 Subscription Services
15.3 Related Reports
15.4 Publisher Expertise
LIST OF TABLES
Table 1 Market Segmentation Analysis
Table 2 Global Functional Powder Drinks Market Share of Leading Companies, 2023
Table 3 Product Offerings of Leading Companies
Table 4 Low Growth Scenario Forecasts
Table 5 Reference Case Growth Scenario
Table 6 High Growth Case Scenario
Table 7 Global Functional Powder Drinks Revenue (USD Million) And CAGR (%) By Type (2021-2032)
Table 8 Global Functional Powder Drinks Revenue (USD Million) And CAGR (%) By Application (2021-2032)
Table 9 Global Functional Powder Drinks Revenue (USD Million) And CAGR (%) By Product (2021-2032)
Table 10 Global Functional Powder Drinks Market Revenue (USD Million) By Regions (2021-2032)
Table 11 Global Functional Powder Drinks Market Share (%) By Regions (2021-2032)
Table 12 North America Functional Powder Drinks Revenue (USD Million) By Country (2021-2032)
Table 13 Europe Functional Powder Drinks Revenue (USD Million) By Country (2021-2032)
Table 14 Asia Pacific Functional Powder Drinks Revenue (USD Million) By Country (2021-2032)
Table 15 South America Functional Powder Drinks Revenue (USD Million) By Country (2021-2032)
Table 16 Middle East and Africa Functional Powder Drinks Revenue (USD Million) By Region (2021-2032)
Table 17 North America Functional Powder Drinks Revenue (USD Million) By Type (2021-2032)
Table 18 North America Functional Powder Drinks Revenue (USD Million) By Application (2021-2032)
Table 19 North America Functional Powder Drinks Revenue (USD Million) By Product (2021-2032)
Table 20 Europe Functional Powder Drinks Revenue (USD Million) By Type (2021-2032)
Table 21 Europe Functional Powder Drinks Revenue (USD Million) By Application (2021-2032)
Table 22 Europe Functional Powder Drinks Revenue (USD Million) By Product (2021-2032)
Table 23 Asia Pacific Functional Powder Drinks Revenue (USD Million) By Type (2021-2032)
Table 24 Asia Pacific Functional Powder Drinks Revenue (USD Million) By Application (2021-2032)
Table 25 Asia Pacific Functional Powder Drinks Revenue (USD Million) By Product (2021-2032)
Table 26 South America Functional Powder Drinks Revenue (USD Million) By Type (2021-2032)
Table 27 South America Functional Powder Drinks Revenue (USD Million) By Application (2021-2032)
Table 28 South America Functional Powder Drinks Revenue (USD Million) By Product (2021-2032)
Table 29 Middle East and Africa Functional Powder Drinks Revenue (USD Million) By Type (2021-2032)
Table 30 Middle East and Africa Functional Powder Drinks Revenue (USD Million) By Application (2021-2032)
Table 31 Middle East and Africa Functional Powder Drinks Revenue (USD Million) By Product (2021-2032)
LIST OF FIGURES
Figure 1. Market Scope
Figure 2. Pricing Forecasts Per Unit, 2023- 2032
Figure 3. Porter’s Five Forces
Figure 4. Global Functional Powder Drinks Market Revenue (USD Million) By Regions (2021-2032)
Figure 5. Global Functional Powder Drinks Market Share (%) By Regions (2023)
Figure 6. North America Functional Powder Drinks Revenue (USD Million) By Country (2021-2032)
Figure 7. United States Functional Powder Drinks Revenue (USD Million) By Country (2021-2032)
Figure 8. Canada Functional Powder Drinks Revenue (USD Million) By Country (2021-2032)
Figure 9. Mexico Functional Powder Drinks Revenue (USD Million) By Country (2021-2032)
Figure 10. Europe Functional Powder Drinks Revenue (USD Million) By Country (2021-2032)
Figure 11. Germany Functional Powder Drinks Revenue (USD Million) By Country (2021-2032)
Figure 12. France Functional Powder Drinks Revenue (USD Million) By Country (2021-2032)
Figure 13. United Kingdom Functional Powder Drinks Revenue (USD Million) By Country (2021-2032)
Figure 14. Spain Functional Powder Drinks Revenue (USD Million) By Country (2021-2032)
Figure 15. Italy Functional Powder Drinks Revenue (USD Million) By Country (2021-2032)
Figure 16. Russia Functional Powder Drinks Revenue (USD Million) By Country (2021-2032)
Figure 17. Rest of Europe Functional Powder Drinks Revenue (USD Million) By Country (2021-2032)
Figure 11. Asia Pacific Functional Powder Drinks Revenue (USD Million) By Country (2021-2032)
Figure 12. China Functional Powder Drinks Revenue (USD Million) By Country (2021-2032)
Figure 13. Japan Functional Powder Drinks Revenue (USD Million) By Country (2021-2032)
Figure 14. India Functional Powder Drinks Revenue (USD Million) By Country (2021-2032)
Figure 15. South Korea Functional Powder Drinks Revenue (USD Million) By Country (2021-2032)
Figure 16. Australia Functional Powder Drinks Revenue (USD Million) By Country (2021-2032)
Figure 17. South East Asia Functional Powder Drinks Revenue (USD Million) By Country (2021-2032)
Figure 18. South America Functional Powder Drinks Revenue (USD Million) By Country (2021-2032)
Figure 19. Brazil Functional Powder Drinks Revenue (USD Million) By Country (2021-2032)
Figure 20. Argentina Functional Powder Drinks Revenue (USD Million) By Country (2021-2032)
Figure 21. Rest of Asia Pacific Functional Powder Drinks Revenue (USD Million) By Country (2021-2032)
Figure 22. Middle East and Africa Functional Powder Drinks Revenue (USD Million) By Region (2021-2032)
Figure 23. Saudi Arabia Functional Powder Drinks Revenue (USD Million) By Region (2021-2032)
Figure 24. The UAE Functional Powder Drinks Revenue (USD Million) By Region (2021-2032)
Figure 25. Rest of Middle East Functional Powder Drinks Revenue (USD Million) By Region (2021-2032)
Figure 26. South Africa Functional Powder Drinks Revenue (USD Million) By Region (2021-2032)
Figure 27. Africa Functional Powder Drinks Revenue (USD Million) By Region (2021-2032)
Figure 28. North America Functional Powder Drinks Revenue (USD Million) By Type (2021-2032)
Figure 29. North America Functional Powder Drinks Revenue (USD Million) By Application (2021-2032)
Figure 30. North America Functional Powder Drinks Revenue (USD Million) By Product (2021-2032)
Figure 31. Europe Functional Powder Drinks Revenue (USD Million) By Type (2021-2032)
Figure 32. Europe Functional Powder Drinks Revenue (USD Million) By Application (2021-2032)
Figure 33. Europe Functional Powder Drinks Revenue (USD Million) By Product (2021-2032)
Figure 34. Asia Pacific Functional Powder Drinks Revenue (USD Million) By Type (2021-2032)
Figure 35. Asia Pacific Functional Powder Drinks Revenue (USD Million) By Application (2021-2032)
Figure 36. Asia Pacific Functional Powder Drinks Revenue (USD Million) By Product (2021-2032)
Figure 37. South America Functional Powder Drinks Revenue (USD Million) By Type (2021-2032)
Figure 38. South America Functional Powder Drinks Revenue (USD Million) By Application (2021-2032)
Figure 39. South America Functional Powder Drinks Revenue (USD Million) By Product (2021-2032)
Figure 40. Middle East and Africa Functional Powder Drinks Revenue (USD Million) By Type (2021-2032)
Figure 41. Middle East and Africa Functional Powder Drinks Revenue (USD Million) By Application (2021-2032)
Figure 42. Middle East and Africa Functional Powder Drinks Revenue (USD Million) By Product (2021-2032)
By Type
Refreshment Beverages
Carbonated Soft Drinks
Fruit Beverages
Others
By Application
Commercial
Household
Countries Analyzed
North America (US, Canada, Mexico)
Europe (Germany, UK, France, Spain, Italy, Russia, Rest of Europe)
Asia Pacific (China, India, Japan, South Korea, Australia, South East Asia, Rest of Asia)
South America (Brazil, Argentina, Rest of South America)
Middle East and Africa (Saudi Arabia, UAE, Rest of Middle East, South Africa, Egypt, Rest of Africa)
