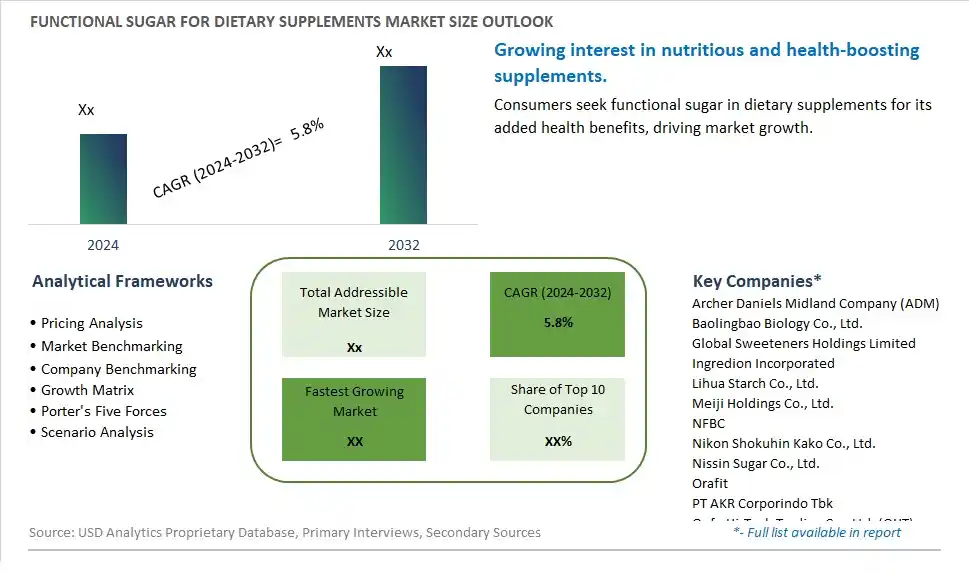
Global Functional Sugar for Dietary Supplements Market Size is valued at $XX Million in 2024 and is forecast to register a growth rate (CAGR) of 5.8% to reach $XX Million by 2032.
The global Functional Sugar for Dietary Supplements Market Comprehensive Study analyzes and forecasts the market size across 6 regions and 24 countries for diverse segments -By Type (Oligosaccharide, Inulin, Sugar Alcohols), By Sales Channel (Online, Offline)
An Introduction to Functional Sugar for Dietary Supplements Market
In 2024, the Functional Sugar for Dietary Supplements market is thriving, fueled by the rising demand for nutritionally enhanced and health-promoting sugar alternatives. Functional sugars, used in dietary supplements, offer benefits such as low glycemic impact and prebiotic properties. The market benefits from advancements in sugar extraction and fortification technologies, the growing trend of health and wellness, and the expansion of the global dietary supplement sector. Additionally, the increasing focus on clean label and natural ingredients in dietary supplements is contributing to market growth.
Functional Sugar for Dietary Supplements Competitive Landscape
The market report analyses the leading companies in the industry including Archer Daniels Midland Company (ADM), Baolingbao Biology Co., Ltd., Global Sweeteners Holdings Limited, Ingredion Incorporated, Lihua Starch Co., Ltd., Meiji Holdings Co., Ltd., NFBC, Nikon Shokuhin Kako Co., Ltd., Nissin Sugar Co., Ltd., Orafit, PT AKR Corporindo Tbk, Qufu Hi-Tech Trading Co., Ltd. (QHT), Roquette Frères, Royal FrieslandCampina N.V., Shandong Tianli Pharmaceutical Co., Ltd., Taiwan Fructose Co., Ltd., Xylem Inc., Yakult Honsha Co., Ltd., Yantai Longlive Bio-Technology Co., Ltd., Yibin Yatai Biological Engineering Co., Ltd., and Others.
Functional Sugar for Dietary Supplements Market Dynamics
Functional Sugar for Dietary Supplements Market Trend: Growing Integration of Functional Sugars in Nutraceuticals
The most prominent trend in the Functional Sugar for Dietary Supplements Market is the growing integration of functional sugars in nutraceuticals. As consumers seek out dietary supplements that offer both efficacy and palatability, functional sugars are increasingly used to enhance the taste and nutritional profile of these products. This trend is driven by the need to create supplements that are not only beneficial for health but also enjoyable to consume.
Functional Sugar for Dietary Supplements Market Driver: Rising Demand for Enhanced Dietary Supplements
The key driver of the Functional Sugar for Dietary Supplements Market is the rising demand for enhanced dietary supplements. As more consumers focus on holistic health and wellness, there is a higher demand for supplements that offer additional benefits, such as improved digestion, increased energy, or enhanced immune function. Functional sugars, with their ability to provide both sweetness and nutritional value, are becoming a preferred ingredient in the formulation of advanced dietary supplements.
Functional Sugar for Dietary Supplements Market Opportunity: Development of Multifunctional Supplement Products
A significant opportunity in the Functional Sugar for Dietary Supplements Market lies in the development of multifunctional supplement products. By creating supplements that combine multiple health benefits with great taste, companies can attract a wider audience. Innovative formulations that incorporate functional sugars to mask the unpleasant taste of certain active ingredients while adding health benefits can help drive consumer acceptance and market growth.
Functional Sugar for Dietary Supplements Market Share Analysis: Online is the fastest growing segment over the forecast period to 2032
The Online segment is the fastest-growing within the Functional Sugar for Dietary Supplements Market by sales channel, projected to experience significant growth up to 2032. This rapid expansion is driven by the increasing consumer preference for the convenience and accessibility of online shopping platforms. The rise of e-commerce has revolutionized the way consumers purchase dietary supplements, allowing them to easily browse, compare, and order products from the comfort of their homes. Online platforms offer a wide range of functional sugars, such as oligosaccharides, inulin, and sugar alcohols, catering to the diverse needs of health-conscious consumers. The Past few yearshas further accelerated the shift towards online shopping, as consumers sought safe and contactless purchasing options. Additionally, e-commerce platforms provide detailed product descriptions, customer reviews, and competitive pricing, enhancing the overall shopping experience. Subscription services and targeted marketing strategies by online retailers also contribute to the growth of this segment. As digital shopping continues to expand and evolve, the online segment is expected to maintain its rapid growth, solidifying its position as the fastest-growing sales channel in the functional sugar for dietary supplements market.
Functional Sugar for Dietary Supplements Market Share Analysis: Oligosaccharide segment generated the highest revenue share in the industry
Oligosaccharide is the largest segment within the Functional Sugar for Dietary Supplements Market by type. This segment's dominance is attributed to the extensive use of oligosaccharides as prebiotics, which support gut health by promoting the growth of beneficial bacteria. Oligosaccharides are widely recognized for their health benefits, including improved digestive health, enhanced immune function, and better mineral absorption. They are commonly used in dietary supplements aimed at supporting overall health and wellness. The growing consumer awareness of the importance of gut health and the rise of functional foods and supplements have significantly boosted the demand for oligosaccharides. Additionally, the versatility of oligosaccharides in various supplement forms, such as powders, capsules, and gummies, further enhances their appeal. The combination of health benefits, versatility, and growing consumer interest in gut health solidifies oligosaccharides as the largest segment in the functional sugar for dietary supplements market.
Functional Sugar for Dietary Supplements Market Segmentation
By Type
Oligosaccharide
Inulin
Sugar Alcohols
By Sales Channel
Online
Offline
Countries Analyzed
North America (US, Canada, Mexico)
Europe (Germany, UK, France, Spain, Italy, Russia, Rest of Europe)
Asia Pacific (China, India, Japan, South Korea, Australia, South East Asia, Rest of Asia)
South America (Brazil, Argentina, Rest of South America)
Middle East and Africa (Saudi Arabia, UAE, Rest of Middle East, South Africa, Egypt, Rest of Africa)
Functional Sugar for Dietary Supplements Companies Profiled in the Study
Archer Daniels Midland Company (ADM)
Baolingbao Biology Co., Ltd.
Global Sweeteners Holdings Limited
Ingredion Incorporated
Lihua Starch Co., Ltd.
Meiji Holdings Co., Ltd.
NFBC
Nikon Shokuhin Kako Co., Ltd.
Nissin Sugar Co., Ltd.
Orafit
PT AKR Corporindo Tbk
Qufu Hi-Tech Trading Co., Ltd. (QHT)
Roquette Frères
Royal FrieslandCampina N.V.
Shandong Tianli Pharmaceutical Co., Ltd.
Taiwan Fructose Co., Ltd.
Xylem Inc.
Yakult Honsha Co., Ltd.
Yantai Longlive Bio-Technology Co., Ltd.
Yibin Yatai Biological Engineering Co., Ltd.
*- List Not Exhaustive
Chapter 1. TABLE OF CONTENTS
Chapter 2. Introduction to Functional Sugar for Dietary Supplements Market
2.1. Market Overview
2.2. Key Statistics and Report Highlights
2.3. Scope of the Comprehensive Study
2.3.1. Market Definition
2.3.2 Countries and Regions Covered
2.3.3 Research Objective
2.3.4 Units, Currency, and Conversions
2.3.5 Industry Value Chain
2.4. Key Market Segments
2.5. Key Companies
2.6. Study Period
Chapter 3. Strategic Analysis Review
3.1. Functional Sugar for Dietary Supplements Pricing Analysis and Forecast
3.2. Porter’s Five Forces
3.3. Market Ecosystem
3.4. SWOT Analysis
3.5. Regulatory Scenario
3.3. Effects of Inflation, Russia-Ukraine War, moderating economic growth, and other macroeconomic factors
Chapter 4. Competitive Landscape
4.1. Market Share Analysis
4.1.1. Global Functional Sugar for Dietary Supplements Market Share by Company, 2023
4.1.2. Product Offerings of Leading Functional Sugar for Dietary Supplements Companies
4.2. Market Entropy
4.2.1. New Product Launches in the Industry
4.2.2. Mergers, Acquisitions, Joint ventures, and Partnerships
4.3. Key Strategies and Best Practices
Chapter 5. Global Market Projections: Best, Reference, and Low Case Scenarios
5.1. Growth Analysis- Case Scenario Definitions
5.2. Low Growth Case Scenario Forecasts
5.3. Reference Growth Case Scenario Forecasts
5.4. High Growth Case Scenario Forecasts
Chapter 6. Market Dynamics
6.1. Functional Sugar for Dietary Supplements Market Drivers
6.2. Functional Sugar for Dietary Supplements Market Challenges
6.6. Functional Sugar for Dietary Supplements Market Opportunities
6.4. Functional Sugar for Dietary Supplements Market Trends
Chapter 7. Global Functional Sugar for Dietary Supplements Market Outlook Trends
7.1. Global Functional Sugar for Dietary Supplements Revenue (USD Million) and CAGR (%) by Type (2021-2032)
7.2. Global Functional Sugar for Dietary Supplements Revenue (USD Million) and CAGR (%) by Application (2021-2032)
7.3. Global Functional Sugar for Dietary Supplements Revenue (USD Million) and CAGR (%) by Product (2021-2032)
By Type
Oligosaccharide
Inulin
Sugar Alcohols
By Sales Channel
Online
Offline
Chapter 8. Global Functional Sugar for Dietary Supplements Regional Analysis and Outlook
8.1. Global Functional Sugar for Dietary Supplements Revenue (USD Million) By Regions (2021- 2032)
8.2. North America Functional Sugar for Dietary Supplements Revenue (USD Million) by Country (2021-2032)
8.2.1. United States Functional Sugar for Dietary Supplements Regional Analysis and Outlook
8.2.2. Canada Functional Sugar for Dietary Supplements Regional Analysis and Outlook
8.2.3. Mexico Functional Sugar for Dietary Supplements Regional Analysis and Outlook
8.3. Europe Functional Sugar for Dietary Supplements Revenue (USD Million), by Country (2021-2032)
8.3.1. Germany Functional Sugar for Dietary Supplements Regional Analysis and Outlook
8.3.2. France Functional Sugar for Dietary Supplements Regional Analysis and Outlook
8.3.3. United Kingdom Functional Sugar for Dietary Supplements Regional Analysis and Outlook
8.3.4. Spain Functional Sugar for Dietary Supplements Regional Analysis and Outlook
8.3.5. Italy Functional Sugar for Dietary Supplements Regional Analysis and Outlook
8.3.6. Russia Functional Sugar for Dietary Supplements Regional Analysis and Outlook
8.3.7. Rest of Europe Functional Sugar for Dietary Supplements Regional Analysis and Outlook
8.4. Asia Pacific Functional Sugar for Dietary Supplements Revenue (USD Million) by Country (2021-2032)
8.4.1. China Functional Sugar for Dietary Supplements Regional Analysis and Outlook
8.4.2. Japan Functional Sugar for Dietary Supplements Regional Analysis and Outlook
8.4.3. India Functional Sugar for Dietary Supplements Regional Analysis and Outlook
8.4.4. South Korea Functional Sugar for Dietary Supplements Regional Analysis and Outlook
8.4.5. Australia Functional Sugar for Dietary Supplements Regional Analysis and Outlook
8.4.6. South East Asia Functional Sugar for Dietary Supplements Regional Analysis and Outlook
8.4.7. Rest of Asia Pacific Functional Sugar for Dietary Supplements Regional Analysis and Outlook
8.5. South America Functional Sugar for Dietary Supplements Revenue (USD Million), by Country (2021-2032)
8.5.1. Brazil Functional Sugar for Dietary Supplements Regional Analysis and Outlook
8.5.2. Argentina Functional Sugar for Dietary Supplements Regional Analysis and Outlook
8.5.3. Rest of South America Functional Sugar for Dietary Supplements Regional Analysis and Outlook
8.6. Middle East and Africa Functional Sugar for Dietary Supplements Revenue (USD Million) by Country (2021-2032)
8.6.1. Middle East Functional Sugar for Dietary Supplements Regional Analysis and Outlook
8.6.2. Africa Functional Sugar for Dietary Supplements Regional Analysis and Outlook
Chapter 9. North America Functional Sugar for Dietary Supplements Analysis and Outlook
9.1. North America Functional Sugar for Dietary Supplements Revenue (USD Million) by Segments (2021-2032)
9.1.1. North America Functional Sugar for Dietary Supplements Revenue (USD Million) by Type (2021-2032)
9.1.2. North America Functional Sugar for Dietary Supplements Revenue (USD Million) by Application (2021-2032)
9.1.3. North America Functional Sugar for Dietary Supplements Revenue (USD Million) by Product (2021-2032)
By Type
Oligosaccharide
Inulin
Sugar Alcohols
By Sales Channel
Online
Offline
Chapter 10. Europe Functional Sugar for Dietary Supplements Analysis and Outlook
10.1. Europe Functional Sugar for Dietary Supplements Revenue (USD Million), by Segments (USD Million) (2021-2032)
10.1.1. Europe Functional Sugar for Dietary Supplements Revenue (USD Million) by Type (2021-2032)
10.1.2. Europe Functional Sugar for Dietary Supplements Revenue (USD Million) by Application (2021-2032)
10.1.3. Europe Functional Sugar for Dietary Supplements Revenue (USD Million) by Product (2021-2032)
By Type
Oligosaccharide
Inulin
Sugar Alcohols
By Sales Channel
Online
Offline
Chapter 11. Asia Pacific Functional Sugar for Dietary Supplements Analysis and Outlook
11.1. Asia Pacific Functional Sugar for Dietary Supplements Revenue (USD Million), and Revenue (USD Million) by Segments (2021-2032)
11.1.1. Asia Pacific Functional Sugar for Dietary Supplements Revenue (USD Million) by Type (2021-2032)
11.1.2. Asia Pacific Functional Sugar for Dietary Supplements Revenue (USD Million) by Application (2021-2032)
11.1.3. Asia Pacific Functional Sugar for Dietary Supplements Revenue (USD Million) by Product (2021-2032)
By Type
Oligosaccharide
Inulin
Sugar Alcohols
By Sales Channel
Online
Offline
Chapter 12. South America Functional Sugar for Dietary Supplements Analysis and Outlook
12.1. South America Functional Sugar for Dietary Supplements Revenue (USD Million), by Segments (2021-2032)
12.1.1. South America Functional Sugar for Dietary Supplements Revenue (USD Million) by Type (2021-2032)
12.1.2. South America Functional Sugar for Dietary Supplements Revenue (USD Million) by Application (2021-2032)
12.1.3. South America Functional Sugar for Dietary Supplements Revenue (USD Million) by Product (2021-2032)
By Type
Oligosaccharide
Inulin
Sugar Alcohols
By Sales Channel
Online
Offline
Chapter 13. Middle East and Africa Functional Sugar for Dietary Supplements Analysis and Outlook
13.1. Middle East and Africa Functional Sugar for Dietary Supplements Revenue (USD Million), by Segments (2021-2032)
13.1.1. Middle East and Africa Functional Sugar for Dietary Supplements Revenue (USD Million) by Type (2021-2032)
13.1.2. Middle East and Africa Functional Sugar for Dietary Supplements Revenue (USD Million) by Application (2021-2032)
13.1.3. Middle East and Africa Functional Sugar for Dietary Supplements Revenue (USD Million) by Product (2021-2032)
By Type
Oligosaccharide
Inulin
Sugar Alcohols
By Sales Channel
Online
Offline
Chapter 14. Functional Sugar for Dietary Supplements Company Profiles
14.1 Business Overview
14.2 Product Profiles
14.3 SWOT Profiles
14.5 Recent Developments
14.6 Financial Profile
List of Companies
Archer Daniels Midland Company (ADM)
Baolingbao Biology Co., Ltd.
Global Sweeteners Holdings Limited
Ingredion Incorporated
Lihua Starch Co., Ltd.
Meiji Holdings Co., Ltd.
NFBC
Nikon Shokuhin Kako Co., Ltd.
Nissin Sugar Co., Ltd.
Orafit
PT AKR Corporindo Tbk
Qufu Hi-Tech Trading Co., Ltd. (QHT)
Roquette Frères
Royal FrieslandCampina N.V.
Shandong Tianli Pharmaceutical Co., Ltd.
Taiwan Fructose Co., Ltd.
Xylem Inc.
Yakult Honsha Co., Ltd.
Yantai Longlive Bio-Technology Co., Ltd.
Yibin Yatai Biological Engineering Co., Ltd.
15. Methodology and Data Sources
15.1 Customization Offerings
15.2 Subscription Services
15.3 Related Reports
15.4 Publisher Expertise
LIST OF TABLES
Table 1 Market Segmentation Analysis
Table 2 Global Functional Sugar for Dietary Supplements Market Share of Leading Companies, 2023
Table 3 Product Offerings of Leading Companies
Table 4 Low Growth Scenario Forecasts
Table 5 Reference Case Growth Scenario
Table 6 High Growth Case Scenario
Table 7 Global Functional Sugar for Dietary Supplements Revenue (USD Million) And CAGR (%) By Type (2021-2032)
Table 8 Global Functional Sugar for Dietary Supplements Revenue (USD Million) And CAGR (%) By Application (2021-2032)
Table 9 Global Functional Sugar for Dietary Supplements Revenue (USD Million) And CAGR (%) By Product (2021-2032)
Table 10 Global Functional Sugar for Dietary Supplements Market Revenue (USD Million) By Regions (2021-2032)
Table 11 Global Functional Sugar for Dietary Supplements Market Share (%) By Regions (2021-2032)
Table 12 North America Functional Sugar for Dietary Supplements Revenue (USD Million) By Country (2021-2032)
Table 13 Europe Functional Sugar for Dietary Supplements Revenue (USD Million) By Country (2021-2032)
Table 14 Asia Pacific Functional Sugar for Dietary Supplements Revenue (USD Million) By Country (2021-2032)
Table 15 South America Functional Sugar for Dietary Supplements Revenue (USD Million) By Country (2021-2032)
Table 16 Middle East and Africa Functional Sugar for Dietary Supplements Revenue (USD Million) By Region (2021-2032)
Table 17 North America Functional Sugar for Dietary Supplements Revenue (USD Million) By Type (2021-2032)
Table 18 North America Functional Sugar for Dietary Supplements Revenue (USD Million) By Application (2021-2032)
Table 19 North America Functional Sugar for Dietary Supplements Revenue (USD Million) By Product (2021-2032)
Table 20 Europe Functional Sugar for Dietary Supplements Revenue (USD Million) By Type (2021-2032)
Table 21 Europe Functional Sugar for Dietary Supplements Revenue (USD Million) By Application (2021-2032)
Table 22 Europe Functional Sugar for Dietary Supplements Revenue (USD Million) By Product (2021-2032)
Table 23 Asia Pacific Functional Sugar for Dietary Supplements Revenue (USD Million) By Type (2021-2032)
Table 24 Asia Pacific Functional Sugar for Dietary Supplements Revenue (USD Million) By Application (2021-2032)
Table 25 Asia Pacific Functional Sugar for Dietary Supplements Revenue (USD Million) By Product (2021-2032)
Table 26 South America Functional Sugar for Dietary Supplements Revenue (USD Million) By Type (2021-2032)
Table 27 South America Functional Sugar for Dietary Supplements Revenue (USD Million) By Application (2021-2032)
Table 28 South America Functional Sugar for Dietary Supplements Revenue (USD Million) By Product (2021-2032)
Table 29 Middle East and Africa Functional Sugar for Dietary Supplements Revenue (USD Million) By Type (2021-2032)
Table 30 Middle East and Africa Functional Sugar for Dietary Supplements Revenue (USD Million) By Application (2021-2032)
Table 31 Middle East and Africa Functional Sugar for Dietary Supplements Revenue (USD Million) By Product (2021-2032)
LIST OF FIGURES
Figure 1. Market Scope
Figure 2. Pricing Forecasts Per Unit, 2023- 2032
Figure 3. Porter’s Five Forces
Figure 4. Global Functional Sugar for Dietary Supplements Market Revenue (USD Million) By Regions (2021-2032)
Figure 5. Global Functional Sugar for Dietary Supplements Market Share (%) By Regions (2023)
Figure 6. North America Functional Sugar for Dietary Supplements Revenue (USD Million) By Country (2021-2032)
Figure 7. United States Functional Sugar for Dietary Supplements Revenue (USD Million) By Country (2021-2032)
Figure 8. Canada Functional Sugar for Dietary Supplements Revenue (USD Million) By Country (2021-2032)
Figure 9. Mexico Functional Sugar for Dietary Supplements Revenue (USD Million) By Country (2021-2032)
Figure 10. Europe Functional Sugar for Dietary Supplements Revenue (USD Million) By Country (2021-2032)
Figure 11. Germany Functional Sugar for Dietary Supplements Revenue (USD Million) By Country (2021-2032)
Figure 12. France Functional Sugar for Dietary Supplements Revenue (USD Million) By Country (2021-2032)
Figure 13. United Kingdom Functional Sugar for Dietary Supplements Revenue (USD Million) By Country (2021-2032)
Figure 14. Spain Functional Sugar for Dietary Supplements Revenue (USD Million) By Country (2021-2032)
Figure 15. Italy Functional Sugar for Dietary Supplements Revenue (USD Million) By Country (2021-2032)
Figure 16. Russia Functional Sugar for Dietary Supplements Revenue (USD Million) By Country (2021-2032)
Figure 17. Rest of Europe Functional Sugar for Dietary Supplements Revenue (USD Million) By Country (2021-2032)
Figure 11. Asia Pacific Functional Sugar for Dietary Supplements Revenue (USD Million) By Country (2021-2032)
Figure 12. China Functional Sugar for Dietary Supplements Revenue (USD Million) By Country (2021-2032)
Figure 13. Japan Functional Sugar for Dietary Supplements Revenue (USD Million) By Country (2021-2032)
Figure 14. India Functional Sugar for Dietary Supplements Revenue (USD Million) By Country (2021-2032)
Figure 15. South Korea Functional Sugar for Dietary Supplements Revenue (USD Million) By Country (2021-2032)
Figure 16. Australia Functional Sugar for Dietary Supplements Revenue (USD Million) By Country (2021-2032)
Figure 17. South East Asia Functional Sugar for Dietary Supplements Revenue (USD Million) By Country (2021-2032)
Figure 18. South America Functional Sugar for Dietary Supplements Revenue (USD Million) By Country (2021-2032)
Figure 19. Brazil Functional Sugar for Dietary Supplements Revenue (USD Million) By Country (2021-2032)
Figure 20. Argentina Functional Sugar for Dietary Supplements Revenue (USD Million) By Country (2021-2032)
Figure 21. Rest of Asia Pacific Functional Sugar for Dietary Supplements Revenue (USD Million) By Country (2021-2032)
Figure 22. Middle East and Africa Functional Sugar for Dietary Supplements Revenue (USD Million) By Region (2021-2032)
Figure 23. Saudi Arabia Functional Sugar for Dietary Supplements Revenue (USD Million) By Region (2021-2032)
Figure 24. The UAE Functional Sugar for Dietary Supplements Revenue (USD Million) By Region (2021-2032)
Figure 25. Rest of Middle East Functional Sugar for Dietary Supplements Revenue (USD Million) By Region (2021-2032)
Figure 26. South Africa Functional Sugar for Dietary Supplements Revenue (USD Million) By Region (2021-2032)
Figure 27. Africa Functional Sugar for Dietary Supplements Revenue (USD Million) By Region (2021-2032)
Figure 28. North America Functional Sugar for Dietary Supplements Revenue (USD Million) By Type (2021-2032)
Figure 29. North America Functional Sugar for Dietary Supplements Revenue (USD Million) By Application (2021-2032)
Figure 30. North America Functional Sugar for Dietary Supplements Revenue (USD Million) By Product (2021-2032)
Figure 31. Europe Functional Sugar for Dietary Supplements Revenue (USD Million) By Type (2021-2032)
Figure 32. Europe Functional Sugar for Dietary Supplements Revenue (USD Million) By Application (2021-2032)
Figure 33. Europe Functional Sugar for Dietary Supplements Revenue (USD Million) By Product (2021-2032)
Figure 34. Asia Pacific Functional Sugar for Dietary Supplements Revenue (USD Million) By Type (2021-2032)
Figure 35. Asia Pacific Functional Sugar for Dietary Supplements Revenue (USD Million) By Application (2021-2032)
Figure 36. Asia Pacific Functional Sugar for Dietary Supplements Revenue (USD Million) By Product (2021-2032)
Figure 37. South America Functional Sugar for Dietary Supplements Revenue (USD Million) By Type (2021-2032)
Figure 38. South America Functional Sugar for Dietary Supplements Revenue (USD Million) By Application (2021-2032)
Figure 39. South America Functional Sugar for Dietary Supplements Revenue (USD Million) By Product (2021-2032)
Figure 40. Middle East and Africa Functional Sugar for Dietary Supplements Revenue (USD Million) By Type (2021-2032)
Figure 41. Middle East and Africa Functional Sugar for Dietary Supplements Revenue (USD Million) By Application (2021-2032)
Figure 42. Middle East and Africa Functional Sugar for Dietary Supplements Revenue (USD Million) By Product (2021-2032)
By Type
Oligosaccharide
Inulin
Sugar Alcohols
By Sales Channel
Online
Offline
Countries Analyzed
North America (US, Canada, Mexico)
Europe (Germany, UK, France, Spain, Italy, Russia, Rest of Europe)
Asia Pacific (China, India, Japan, South Korea, Australia, South East Asia, Rest of Asia)
South America (Brazil, Argentina, Rest of South America)
Middle East and Africa (Saudi Arabia, UAE, Rest of Middle East, South Africa, Egypt, Rest of Africa)
