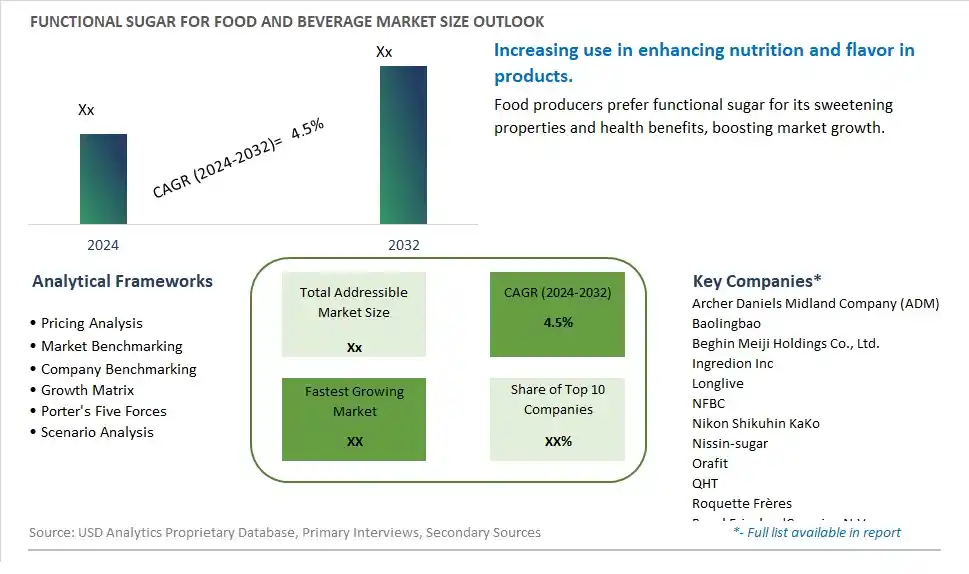
Global Functional Sugar for Food and Beverage Market Size is valued at $XX Million in 2024 and is forecast to register a growth rate (CAGR) of 4.5% to reach $XX Million by 2032.
The global Functional Sugar for Food and Beverage Market Comprehensive Study analyzes and forecasts the market size across 6 regions and 24 countries for diverse segments -By Type (Oligosaccharide, Inulin, Sugar Alcohols, Others), By Application (Food, Beverages)
An Introduction to Functional Sugar for Food and Beverage Market
The Functional Sugar for Food and Beverage market in 2024 is witnessing robust growth, driven by the rising demand for healthier and multifunctional sweeteners in food and beverage products. Functional sugars, such as low-calorie and fiber-enriched sugars, are used to enhance the nutritional profile and health benefits of products. The market benefits from advancements in sugar processing and fortification technologies, the growing trend of health-conscious and clean label products, and the expansion of the functional food and beverage sectors. Additionally, the increasing focus on reducing sugar intake and promoting healthy eating is driving market growth.
Functional Sugar for Food and Beverage Competitive Landscape
The market report analyses the leading companies in the industry including Archer Daniels Midland Company (ADM), Baolingbao, Beghin Meiji Holdings Co., Ltd., Ingredion Inc, Longlive, NFBC, Nikon Shikuhin KaKo, Nissin-sugar, Orafit, QHT, Roquette Frères, Royal FrieslandCampina N.V., Taiwan Fructose, Yakult Honsha Co., Ltd., YIBIN YATAI, and Others.
Functional Sugar for Food and Beverage Market Dynamics
Functional Sugar for Food and Beverage Market Trend: Increasing Preference for Healthier Sweeteners in F&B
The most prominent trend in the Functional Sugar for Food and Beverage Market is the increasing preference for healthier sweeteners in food and beverage products. As consumers become more health-conscious and aware of the adverse effects of excessive sugar consumption, there is a growing demand for functional sugars that offer additional health benefits. This trend is driven by the need for sweeteners that not only provide sweetness but also contribute to overall wellness.
Functional Sugar for Food and Beverage Market Driver: Growth in Health and Wellness Food Products
The key driver of the Functional Sugar for Food and Beverage Market is the growth in health and wellness food products. As more consumers seek out healthier food and beverage options, there is a higher demand for products that incorporate functional sugars to enhance their nutritional value. This driver is supported by the trend towards clean-label products and the desire for natural, minimally processed ingredients in everyday food and beverages.
Functional Sugar for Food and Beverage Market Opportunity: Innovation in Food and Beverage Applications
A significant opportunity in the Functional Sugar for Food and Beverage Market lies in innovation in food and beverage applications. By developing new products that utilize functional sugars to enhance taste and nutritional content, companies can cater to the evolving preferences of health-conscious consumers. Offering functional sugars in various forms, such as syrups, powders, and granules, can enable their use in a wide range of food and beverage products, from baked goods to beverages, thereby expanding market reach.
Functional Sugar for Food and Beverage Market Share Analysis: Inulin segment generated the highest revenue share in the industry
Inulin is the largest segment within the Functional Sugar for Food and Beverage Market by type. This segment's dominance is driven by the versatile applications and significant health benefits that inulin offers. Inulin, a type of soluble fiber found in many plants, is widely used in the food and beverage industry for its prebiotic properties, which promote gut health by stimulating the growth of beneficial bacteria in the digestive tract. Additionally, inulin helps in improving digestive health, enhancing calcium absorption, and supporting weight management by increasing feelings of fullness. The use of inulin extends across a variety of food and beverage products, including dairy products, baked goods, beverages, and nutritional bars, where it acts as a fat replacer, texture enhancer, and sugar substitute. The growing consumer demand for natural and functional ingredients in food and beverages has further boosted the popularity of inulin. Its ability to enhance taste and texture while providing health benefits makes it an attractive ingredient for manufacturers aiming to cater to health-conscious consumers. As the trend towards clean-label, high-fiber, and digestive health products continues to rise, the demand for inulin in the food and beverage industry is expected to remain strong, solidifying its position as the largest segment in the functional sugar market.
Functional Sugar for Food and Beverage Market Share Analysis: Beverages is the fastest growing segment over the forecast period to 2032
The Beverages segment is the fastest-growing within the Functional Sugar for Food and Beverage Market by application, projected to experience significant growth up to 2032. This rapid expansion is driven by the increasing consumer demand for healthier and functional beverages that offer additional nutritional benefits. Functional sugars, such as inulin, oligosaccharides, and sugar alcohols, are being increasingly incorporated into a wide range of beverages, including sports drinks, energy drinks, fortified waters, juices, and dairy-based drinks. These sugars provide multiple health benefits, including improved digestive health, enhanced nutrient absorption, and reduced calorie content, which appeal to health-conscious consumers.The trend towards clean-label and natural ingredients has also contributed to the growth of functional sugars in the beverage industry. Manufacturers are innovating with new formulations that enhance the nutritional profile of beverages without compromising on taste. The rising popularity of plant-based and low-sugar drinks further supports this growth, as functional sugars help achieve the desired sweetness and texture while maintaining a healthful appeal. As consumers continue to seek convenient and nutritious drink options, the demand for functional sugars in the beverage segment is expected to soar, solidifying its position as the fastest-growing application in the functional sugar for food and beverage market.
Functional Sugar for Food and Beverage Market Segmentation
By Type
Oligosaccharide
Inulin
Sugar Alcohols
Others
By Application
Food
Beverages
Countries Analyzed
North America (US, Canada, Mexico)
Europe (Germany, UK, France, Spain, Italy, Russia, Rest of Europe)
Asia Pacific (China, India, Japan, South Korea, Australia, South East Asia, Rest of Asia)
South America (Brazil, Argentina, Rest of South America)
Middle East and Africa (Saudi Arabia, UAE, Rest of Middle East, South Africa, Egypt, Rest of Africa)
Functional Sugar for Food and Beverage Companies Profiled in the Study
Archer Daniels Midland Company (ADM)
Baolingbao
Beghin Meiji Holdings Co., Ltd.
Ingredion Inc
Longlive
NFBC
Nikon Shikuhin KaKo
Nissin-sugar
Orafit
QHT
Roquette Frères
Royal FrieslandCampina N.V.
Taiwan Fructose
Yakult Honsha Co., Ltd.
YIBIN YATAI
*- List Not Exhaustive
Chapter 1. TABLE OF CONTENTS
Chapter 2. Introduction to Functional Sugar for Food and Beverage Market
2.1. Market Overview
2.2. Key Statistics and Report Highlights
2.3. Scope of the Comprehensive Study
2.3.1. Market Definition
2.3.2 Countries and Regions Covered
2.3.3 Research Objective
2.3.4 Units, Currency, and Conversions
2.3.5 Industry Value Chain
2.4. Key Market Segments
2.5. Key Companies
2.6. Study Period
Chapter 3. Strategic Analysis Review
3.1. Functional Sugar for Food and Beverage Pricing Analysis and Forecast
3.2. Porter’s Five Forces
3.3. Market Ecosystem
3.4. SWOT Analysis
3.5. Regulatory Scenario
3.3. Effects of Inflation, Russia-Ukraine War, moderating economic growth, and other macroeconomic factors
Chapter 4. Competitive Landscape
4.1. Market Share Analysis
4.1.1. Global Functional Sugar for Food and Beverage Market Share by Company, 2023
4.1.2. Product Offerings of Leading Functional Sugar for Food and Beverage Companies
4.2. Market Entropy
4.2.1. New Product Launches in the Industry
4.2.2. Mergers, Acquisitions, Joint ventures, and Partnerships
4.3. Key Strategies and Best Practices
Chapter 5. Global Market Projections: Best, Reference, and Low Case Scenarios
5.1. Growth Analysis- Case Scenario Definitions
5.2. Low Growth Case Scenario Forecasts
5.3. Reference Growth Case Scenario Forecasts
5.4. High Growth Case Scenario Forecasts
Chapter 6. Market Dynamics
6.1. Functional Sugar for Food and Beverage Market Drivers
6.2. Functional Sugar for Food and Beverage Market Challenges
6.6. Functional Sugar for Food and Beverage Market Opportunities
6.4. Functional Sugar for Food and Beverage Market Trends
Chapter 7. Global Functional Sugar for Food and Beverage Market Outlook Trends
7.1. Global Functional Sugar for Food and Beverage Revenue (USD Million) and CAGR (%) by Type (2021-2032)
7.2. Global Functional Sugar for Food and Beverage Revenue (USD Million) and CAGR (%) by Application (2021-2032)
7.3. Global Functional Sugar for Food and Beverage Revenue (USD Million) and CAGR (%) by Product (2021-2032)
By Type
Oligosaccharide
Inulin
Sugar Alcohols
Others
By Application
Food
Beverages
Chapter 8. Global Functional Sugar for Food and Beverage Regional Analysis and Outlook
8.1. Global Functional Sugar for Food and Beverage Revenue (USD Million) By Regions (2021- 2032)
8.2. North America Functional Sugar for Food and Beverage Revenue (USD Million) by Country (2021-2032)
8.2.1. United States Functional Sugar for Food and Beverage Regional Analysis and Outlook
8.2.2. Canada Functional Sugar for Food and Beverage Regional Analysis and Outlook
8.2.3. Mexico Functional Sugar for Food and Beverage Regional Analysis and Outlook
8.3. Europe Functional Sugar for Food and Beverage Revenue (USD Million), by Country (2021-2032)
8.3.1. Germany Functional Sugar for Food and Beverage Regional Analysis and Outlook
8.3.2. France Functional Sugar for Food and Beverage Regional Analysis and Outlook
8.3.3. United Kingdom Functional Sugar for Food and Beverage Regional Analysis and Outlook
8.3.4. Spain Functional Sugar for Food and Beverage Regional Analysis and Outlook
8.3.5. Italy Functional Sugar for Food and Beverage Regional Analysis and Outlook
8.3.6. Russia Functional Sugar for Food and Beverage Regional Analysis and Outlook
8.3.7. Rest of Europe Functional Sugar for Food and Beverage Regional Analysis and Outlook
8.4. Asia Pacific Functional Sugar for Food and Beverage Revenue (USD Million) by Country (2021-2032)
8.4.1. China Functional Sugar for Food and Beverage Regional Analysis and Outlook
8.4.2. Japan Functional Sugar for Food and Beverage Regional Analysis and Outlook
8.4.3. India Functional Sugar for Food and Beverage Regional Analysis and Outlook
8.4.4. South Korea Functional Sugar for Food and Beverage Regional Analysis and Outlook
8.4.5. Australia Functional Sugar for Food and Beverage Regional Analysis and Outlook
8.4.6. South East Asia Functional Sugar for Food and Beverage Regional Analysis and Outlook
8.4.7. Rest of Asia Pacific Functional Sugar for Food and Beverage Regional Analysis and Outlook
8.5. South America Functional Sugar for Food and Beverage Revenue (USD Million), by Country (2021-2032)
8.5.1. Brazil Functional Sugar for Food and Beverage Regional Analysis and Outlook
8.5.2. Argentina Functional Sugar for Food and Beverage Regional Analysis and Outlook
8.5.3. Rest of South America Functional Sugar for Food and Beverage Regional Analysis and Outlook
8.6. Middle East and Africa Functional Sugar for Food and Beverage Revenue (USD Million) by Country (2021-2032)
8.6.1. Middle East Functional Sugar for Food and Beverage Regional Analysis and Outlook
8.6.2. Africa Functional Sugar for Food and Beverage Regional Analysis and Outlook
Chapter 9. North America Functional Sugar for Food and Beverage Analysis and Outlook
9.1. North America Functional Sugar for Food and Beverage Revenue (USD Million) by Segments (2021-2032)
9.1.1. North America Functional Sugar for Food and Beverage Revenue (USD Million) by Type (2021-2032)
9.1.2. North America Functional Sugar for Food and Beverage Revenue (USD Million) by Application (2021-2032)
9.1.3. North America Functional Sugar for Food and Beverage Revenue (USD Million) by Product (2021-2032)
By Type
Oligosaccharide
Inulin
Sugar Alcohols
Others
By Application
Food
Beverages
Chapter 10. Europe Functional Sugar for Food and Beverage Analysis and Outlook
10.1. Europe Functional Sugar for Food and Beverage Revenue (USD Million), by Segments (USD Million) (2021-2032)
10.1.1. Europe Functional Sugar for Food and Beverage Revenue (USD Million) by Type (2021-2032)
10.1.2. Europe Functional Sugar for Food and Beverage Revenue (USD Million) by Application (2021-2032)
10.1.3. Europe Functional Sugar for Food and Beverage Revenue (USD Million) by Product (2021-2032)
By Type
Oligosaccharide
Inulin
Sugar Alcohols
Others
By Application
Food
Beverages
Chapter 11. Asia Pacific Functional Sugar for Food and Beverage Analysis and Outlook
11.1. Asia Pacific Functional Sugar for Food and Beverage Revenue (USD Million), and Revenue (USD Million) by Segments (2021-2032)
11.1.1. Asia Pacific Functional Sugar for Food and Beverage Revenue (USD Million) by Type (2021-2032)
11.1.2. Asia Pacific Functional Sugar for Food and Beverage Revenue (USD Million) by Application (2021-2032)
11.1.3. Asia Pacific Functional Sugar for Food and Beverage Revenue (USD Million) by Product (2021-2032)
By Type
Oligosaccharide
Inulin
Sugar Alcohols
Others
By Application
Food
Beverages
Chapter 12. South America Functional Sugar for Food and Beverage Analysis and Outlook
12.1. South America Functional Sugar for Food and Beverage Revenue (USD Million), by Segments (2021-2032)
12.1.1. South America Functional Sugar for Food and Beverage Revenue (USD Million) by Type (2021-2032)
12.1.2. South America Functional Sugar for Food and Beverage Revenue (USD Million) by Application (2021-2032)
12.1.3. South America Functional Sugar for Food and Beverage Revenue (USD Million) by Product (2021-2032)
By Type
Oligosaccharide
Inulin
Sugar Alcohols
Others
By Application
Food
Beverages
Chapter 13. Middle East and Africa Functional Sugar for Food and Beverage Analysis and Outlook
13.1. Middle East and Africa Functional Sugar for Food and Beverage Revenue (USD Million), by Segments (2021-2032)
13.1.1. Middle East and Africa Functional Sugar for Food and Beverage Revenue (USD Million) by Type (2021-2032)
13.1.2. Middle East and Africa Functional Sugar for Food and Beverage Revenue (USD Million) by Application (2021-2032)
13.1.3. Middle East and Africa Functional Sugar for Food and Beverage Revenue (USD Million) by Product (2021-2032)
By Type
Oligosaccharide
Inulin
Sugar Alcohols
Others
By Application
Food
Beverages
Chapter 14. Functional Sugar for Food and Beverage Company Profiles
14.1 Business Overview
14.2 Product Profiles
14.3 SWOT Profiles
14.5 Recent Developments
14.6 Financial Profile
List of Companies
Archer Daniels Midland Company (ADM)
Baolingbao
Beghin Meiji Holdings Co., Ltd.
Ingredion Inc
Longlive
NFBC
Nikon Shikuhin KaKo
Nissin-sugar
Orafit
QHT
Roquette Frères
Royal FrieslandCampina N.V.
Taiwan Fructose
Yakult Honsha Co., Ltd.
YIBIN YATAI
15. Methodology and Data Sources
15.1 Customization Offerings
15.2 Subscription Services
15.3 Related Reports
15.4 Publisher Expertise
LIST OF TABLES
Table 1 Market Segmentation Analysis
Table 2 Global Functional Sugar for Food and Beverage Market Share of Leading Companies, 2023
Table 3 Product Offerings of Leading Companies
Table 4 Low Growth Scenario Forecasts
Table 5 Reference Case Growth Scenario
Table 6 High Growth Case Scenario
Table 7 Global Functional Sugar for Food and Beverage Revenue (USD Million) And CAGR (%) By Type (2021-2032)
Table 8 Global Functional Sugar for Food and Beverage Revenue (USD Million) And CAGR (%) By Application (2021-2032)
Table 9 Global Functional Sugar for Food and Beverage Revenue (USD Million) And CAGR (%) By Product (2021-2032)
Table 10 Global Functional Sugar for Food and Beverage Market Revenue (USD Million) By Regions (2021-2032)
Table 11 Global Functional Sugar for Food and Beverage Market Share (%) By Regions (2021-2032)
Table 12 North America Functional Sugar for Food and Beverage Revenue (USD Million) By Country (2021-2032)
Table 13 Europe Functional Sugar for Food and Beverage Revenue (USD Million) By Country (2021-2032)
Table 14 Asia Pacific Functional Sugar for Food and Beverage Revenue (USD Million) By Country (2021-2032)
Table 15 South America Functional Sugar for Food and Beverage Revenue (USD Million) By Country (2021-2032)
Table 16 Middle East and Africa Functional Sugar for Food and Beverage Revenue (USD Million) By Region (2021-2032)
Table 17 North America Functional Sugar for Food and Beverage Revenue (USD Million) By Type (2021-2032)
Table 18 North America Functional Sugar for Food and Beverage Revenue (USD Million) By Application (2021-2032)
Table 19 North America Functional Sugar for Food and Beverage Revenue (USD Million) By Product (2021-2032)
Table 20 Europe Functional Sugar for Food and Beverage Revenue (USD Million) By Type (2021-2032)
Table 21 Europe Functional Sugar for Food and Beverage Revenue (USD Million) By Application (2021-2032)
Table 22 Europe Functional Sugar for Food and Beverage Revenue (USD Million) By Product (2021-2032)
Table 23 Asia Pacific Functional Sugar for Food and Beverage Revenue (USD Million) By Type (2021-2032)
Table 24 Asia Pacific Functional Sugar for Food and Beverage Revenue (USD Million) By Application (2021-2032)
Table 25 Asia Pacific Functional Sugar for Food and Beverage Revenue (USD Million) By Product (2021-2032)
Table 26 South America Functional Sugar for Food and Beverage Revenue (USD Million) By Type (2021-2032)
Table 27 South America Functional Sugar for Food and Beverage Revenue (USD Million) By Application (2021-2032)
Table 28 South America Functional Sugar for Food and Beverage Revenue (USD Million) By Product (2021-2032)
Table 29 Middle East and Africa Functional Sugar for Food and Beverage Revenue (USD Million) By Type (2021-2032)
Table 30 Middle East and Africa Functional Sugar for Food and Beverage Revenue (USD Million) By Application (2021-2032)
Table 31 Middle East and Africa Functional Sugar for Food and Beverage Revenue (USD Million) By Product (2021-2032)
LIST OF FIGURES
Figure 1. Market Scope
Figure 2. Pricing Forecasts Per Unit, 2023- 2032
Figure 3. Porter’s Five Forces
Figure 4. Global Functional Sugar for Food and Beverage Market Revenue (USD Million) By Regions (2021-2032)
Figure 5. Global Functional Sugar for Food and Beverage Market Share (%) By Regions (2023)
Figure 6. North America Functional Sugar for Food and Beverage Revenue (USD Million) By Country (2021-2032)
Figure 7. United States Functional Sugar for Food and Beverage Revenue (USD Million) By Country (2021-2032)
Figure 8. Canada Functional Sugar for Food and Beverage Revenue (USD Million) By Country (2021-2032)
Figure 9. Mexico Functional Sugar for Food and Beverage Revenue (USD Million) By Country (2021-2032)
Figure 10. Europe Functional Sugar for Food and Beverage Revenue (USD Million) By Country (2021-2032)
Figure 11. Germany Functional Sugar for Food and Beverage Revenue (USD Million) By Country (2021-2032)
Figure 12. France Functional Sugar for Food and Beverage Revenue (USD Million) By Country (2021-2032)
Figure 13. United Kingdom Functional Sugar for Food and Beverage Revenue (USD Million) By Country (2021-2032)
Figure 14. Spain Functional Sugar for Food and Beverage Revenue (USD Million) By Country (2021-2032)
Figure 15. Italy Functional Sugar for Food and Beverage Revenue (USD Million) By Country (2021-2032)
Figure 16. Russia Functional Sugar for Food and Beverage Revenue (USD Million) By Country (2021-2032)
Figure 17. Rest of Europe Functional Sugar for Food and Beverage Revenue (USD Million) By Country (2021-2032)
Figure 11. Asia Pacific Functional Sugar for Food and Beverage Revenue (USD Million) By Country (2021-2032)
Figure 12. China Functional Sugar for Food and Beverage Revenue (USD Million) By Country (2021-2032)
Figure 13. Japan Functional Sugar for Food and Beverage Revenue (USD Million) By Country (2021-2032)
Figure 14. India Functional Sugar for Food and Beverage Revenue (USD Million) By Country (2021-2032)
Figure 15. South Korea Functional Sugar for Food and Beverage Revenue (USD Million) By Country (2021-2032)
Figure 16. Australia Functional Sugar for Food and Beverage Revenue (USD Million) By Country (2021-2032)
Figure 17. South East Asia Functional Sugar for Food and Beverage Revenue (USD Million) By Country (2021-2032)
Figure 18. South America Functional Sugar for Food and Beverage Revenue (USD Million) By Country (2021-2032)
Figure 19. Brazil Functional Sugar for Food and Beverage Revenue (USD Million) By Country (2021-2032)
Figure 20. Argentina Functional Sugar for Food and Beverage Revenue (USD Million) By Country (2021-2032)
Figure 21. Rest of Asia Pacific Functional Sugar for Food and Beverage Revenue (USD Million) By Country (2021-2032)
Figure 22. Middle East and Africa Functional Sugar for Food and Beverage Revenue (USD Million) By Region (2021-2032)
Figure 23. Saudi Arabia Functional Sugar for Food and Beverage Revenue (USD Million) By Region (2021-2032)
Figure 24. The UAE Functional Sugar for Food and Beverage Revenue (USD Million) By Region (2021-2032)
Figure 25. Rest of Middle East Functional Sugar for Food and Beverage Revenue (USD Million) By Region (2021-2032)
Figure 26. South Africa Functional Sugar for Food and Beverage Revenue (USD Million) By Region (2021-2032)
Figure 27. Africa Functional Sugar for Food and Beverage Revenue (USD Million) By Region (2021-2032)
Figure 28. North America Functional Sugar for Food and Beverage Revenue (USD Million) By Type (2021-2032)
Figure 29. North America Functional Sugar for Food and Beverage Revenue (USD Million) By Application (2021-2032)
Figure 30. North America Functional Sugar for Food and Beverage Revenue (USD Million) By Product (2021-2032)
Figure 31. Europe Functional Sugar for Food and Beverage Revenue (USD Million) By Type (2021-2032)
Figure 32. Europe Functional Sugar for Food and Beverage Revenue (USD Million) By Application (2021-2032)
Figure 33. Europe Functional Sugar for Food and Beverage Revenue (USD Million) By Product (2021-2032)
Figure 34. Asia Pacific Functional Sugar for Food and Beverage Revenue (USD Million) By Type (2021-2032)
Figure 35. Asia Pacific Functional Sugar for Food and Beverage Revenue (USD Million) By Application (2021-2032)
Figure 36. Asia Pacific Functional Sugar for Food and Beverage Revenue (USD Million) By Product (2021-2032)
Figure 37. South America Functional Sugar for Food and Beverage Revenue (USD Million) By Type (2021-2032)
Figure 38. South America Functional Sugar for Food and Beverage Revenue (USD Million) By Application (2021-2032)
Figure 39. South America Functional Sugar for Food and Beverage Revenue (USD Million) By Product (2021-2032)
Figure 40. Middle East and Africa Functional Sugar for Food and Beverage Revenue (USD Million) By Type (2021-2032)
Figure 41. Middle East and Africa Functional Sugar for Food and Beverage Revenue (USD Million) By Application (2021-2032)
Figure 42. Middle East and Africa Functional Sugar for Food and Beverage Revenue (USD Million) By Product (2021-2032)
By Type
Oligosaccharide
Inulin
Sugar Alcohols
Others
By Application
Food
Beverages
Countries Analyzed
North America (US, Canada, Mexico)
Europe (Germany, UK, France, Spain, Italy, Russia, Rest of Europe)
Asia Pacific (China, India, Japan, South Korea, Australia, South East Asia, Rest of Asia)
South America (Brazil, Argentina, Rest of South America)
Middle East and Africa (Saudi Arabia, UAE, Rest of Middle East, South Africa, Egypt, Rest of Africa)
