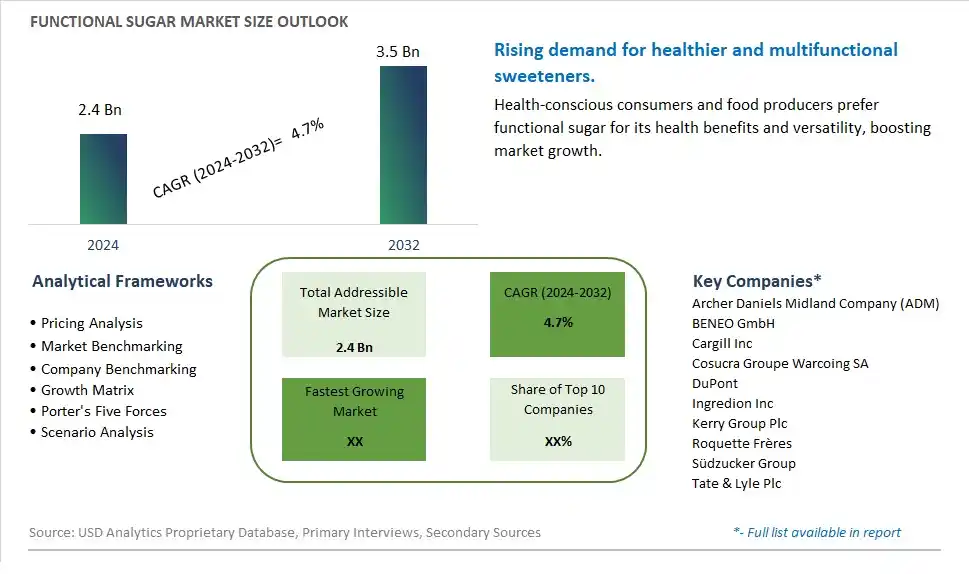
Global Functional Sugar Market Size is valued at $2.4 Billion in 2024 and is forecast to register a growth rate (CAGR) of 4.7% to reach $3.5 Billion by 2032.
The global Functional Sugar Market Comprehensive Study analyzes and forecasts the market size across 6 regions and 24 countries for diverse segments -By Type (Prebiotic Sugars, Low-Calorie Sweeteners, Sugar Alcohols, Molasses, Others), By Distribution Channel (Supermarkets/Hypermarkets, Convenience Stores, Specialty Stores, E-Commerce, Others), By Application (Food and Beverages, Pharmaceuticals, Cosmetics, Others)
An Introduction to Functional Sugar Market
The Functional Sugar market in 2024 is experiencing significant growth, driven by the rising demand for healthier and multifunctional sweeteners. Functional sugars, such as low-glycemic and fiber-enriched sugars, offer additional health benefits beyond sweetness. The market benefits from advancements in sugar processing and fortification technologies, the growing trend of health-conscious and diabetic-friendly products, and the expansion of the functional food and beverage sectors. Additionally, the increasing awareness of the benefits of functional sugars for managing blood sugar levels and promoting digestive health is driving market growth.
Functional Sugar Competitive Landscape
The market report analyses the leading companies in the industry including Archer Daniels Midland Company (ADM), BENEO GmbH, Cargill Inc, Cosucra Groupe Warcoing SA, DuPont, Ingredion Inc, Kerry Group Plc, Roquette Frères, Südzucker Group, Tate & Lyle Plc, and Others.
Functional Sugar Market Dynamics
Functional Sugar Market Trend: Rising Demand for Healthier Sweetening Options
The most prominent trend in the Functional Sugar Market is the rising demand for healthier sweetening options. As consumers become more health-conscious, there is a growing preference for sugars that offer additional health benefits beyond sweetening. Functional sugars, such as those enriched with vitamins, minerals, or prebiotics, are gaining popularity as they provide a dual function of sweetening and enhancing nutritional value.
Functional Sugar Market Driver: Increase in Health and Wellness Products
The key driver of the Functional Sugar Market is the increase in health and wellness products. As more consumers focus on reducing their sugar intake and managing their health, there is a higher demand for functional sugars that offer lower glycemic indices, reduced calories, and added health benefits. This driver is supported by the trend towards clean-label products and the desire for natural, minimally processed sweeteners.
Functional Sugar Market Opportunity: Innovation in Functional Sugar Formulations
A significant opportunity in the Functional Sugar Market lies in innovation in functional sugar formulations. By developing new products that combine sweetening capabilities with health-promoting properties, such as enhanced gut health or immune support, companies can meet the evolving needs of health-conscious consumers. Offering functional sugars in various formats, such as granulated, liquid, or powdered, can also cater to different culinary and dietary applications, expanding market reach.
Functional Sugar Market Share Analysis: E-Commerce is the fastest growing segment over the forecast period to 2032
The E-Commerce segment is the fastest-growing within the Functional Sugar Market by distribution channel, projected to experience significant growth up to 2032. This rapid expansion is driven by the increasing consumer preference for the convenience and variety offered by online shopping platforms. E-commerce allows consumers to easily access a wide range of functional sugars, including prebiotic sugars, low-calorie sweeteners, and sugar alcohols, from the comfort of their homes. The rise of health-consciousness and the demand for specialty products that may not be available in local stores have significantly boosted online sales. Additionally, the Past few yearshas accelerated the shift towards online shopping as consumers seek safe and contactless purchasing options. E-commerce platforms also provide detailed product information, customer reviews, and competitive pricing, enhancing the overall shopping experience. Subscription services and targeted advertising by e-commerce retailers further attract and retain customers. As digital shopping continues to grow and evolve, the e-commerce segment is expected to maintain its rapid growth, solidifying its position as the fastest-growing distribution channel in the functional sugar market.
Functional Sugar Market Share Analysis: Food and Beverages segment generated the highest revenue share in the industry
The Food and Beverages segment is the largest within the Functional Sugar Market by application. This segment's dominance is due to the extensive use of functional sugars in a wide variety of food and beverage products aimed at improving health benefits, flavor profiles, and functional attributes. Functional sugars, such as prebiotic sugars and low-calorie sweeteners, are incorporated into products like snacks, beverages, dairy items, and baked goods to cater to the growing demand for healthier alternatives to traditional sugar. The increasing consumer focus on reducing sugar intake while maintaining taste has driven manufacturers to innovate and use functional sugars to meet these needs. Additionally, the rising trend of clean-label and natural ingredients has further boosted the use of functional sugars in the food and beverage industry. The combination of health benefits, versatility, and consumer demand for healthier food options ensures that the food and beverages segment remains the largest application in the functional sugar market.
Functional Sugar Market Share Analysis: Low-Calorie Sweeteners segment generated the highest revenue share in the industry
Low-Calorie Sweeteners are the largest segment within the Functional Sugar Market by type. This segment's dominance is driven by the increasing consumer demand for healthier sugar alternatives that support weight management and overall health without compromising on taste. Low-calorie sweeteners, such as stevia, sucralose, and aspartame, are widely used in a variety of food and beverage products, including diet sodas, sugar-free desserts, and low-calorie snacks. These sweeteners provide the sweetness of sugar with significantly fewer calories, making them an attractive option for consumers looking to reduce their sugar intake while still enjoying sweet flavors. The rising prevalence of lifestyle-related diseases, such as diabetes and obesity, has further fueled the demand for low-calorie sweeteners. Additionally, the growing trend towards clean-label and natural products has boosted the popularity of natural low-calorie sweeteners like stevia and monk fruit. The extensive use of low-calorie sweeteners in various applications, coupled with the increasing health consciousness among consumers, ensures that this segment remains the largest in the functional sugar market.
Functional Sugar Market Segmentation
By Type
Prebiotic Sugars
Low-Calorie Sweeteners
Sugar Alcohols
Molasses
Others
By Distribution Channel
Supermarkets/Hypermarkets
Convenience Stores
Specialty Stores
E-Commerce
Others
By Application
Food and Beverages
Pharmaceuticals
Cosmetics
Others
Countries Analyzed
North America (US, Canada, Mexico)
Europe (Germany, UK, France, Spain, Italy, Russia, Rest of Europe)
Asia Pacific (China, India, Japan, South Korea, Australia, South East Asia, Rest of Asia)
South America (Brazil, Argentina, Rest of South America)
Middle East and Africa (Saudi Arabia, UAE, Rest of Middle East, South Africa, Egypt, Rest of Africa)
Functional Sugar Companies Profiled in the Study
Archer Daniels Midland Company (ADM)
BENEO GmbH
Cargill Inc
Cosucra Groupe Warcoing SA
DuPont
Ingredion Inc
Kerry Group Plc
Roquette Frères
Südzucker Group
Tate & Lyle Plc
*- List Not Exhaustive
Chapter 1. TABLE OF CONTENTS
Chapter 2. Introduction to Functional Sugar Market
2.1. Market Overview
2.2. Key Statistics and Report Highlights
2.3. Scope of the Comprehensive Study
2.3.1. Market Definition
2.3.2 Countries and Regions Covered
2.3.3 Research Objective
2.3.4 Units, Currency, and Conversions
2.3.5 Industry Value Chain
2.4. Key Market Segments
2.5. Key Companies
2.6. Study Period
Chapter 3. Strategic Analysis Review
3.1. Functional Sugar Pricing Analysis and Forecast
3.2. Porter’s Five Forces
3.3. Market Ecosystem
3.4. SWOT Analysis
3.5. Regulatory Scenario
3.3. Effects of Inflation, Russia-Ukraine War, moderating economic growth, and other macroeconomic factors
Chapter 4. Competitive Landscape
4.1. Market Share Analysis
4.1.1. Global Functional Sugar Market Share by Company, 2023
4.1.2. Product Offerings of Leading Functional Sugar Companies
4.2. Market Entropy
4.2.1. New Product Launches in the Industry
4.2.2. Mergers, Acquisitions, Joint ventures, and Partnerships
4.3. Key Strategies and Best Practices
Chapter 5. Global Market Projections: Best, Reference, and Low Case Scenarios
5.1. Growth Analysis- Case Scenario Definitions
5.2. Low Growth Case Scenario Forecasts
5.3. Reference Growth Case Scenario Forecasts
5.4. High Growth Case Scenario Forecasts
Chapter 6. Market Dynamics
6.1. Functional Sugar Market Drivers
6.2. Functional Sugar Market Challenges
6.6. Functional Sugar Market Opportunities
6.4. Functional Sugar Market Trends
Chapter 7. Global Functional Sugar Market Outlook Trends
7.1. Global Functional Sugar Revenue (USD Million) and CAGR (%) by Type (2021-2032)
7.2. Global Functional Sugar Revenue (USD Million) and CAGR (%) by Application (2021-2032)
7.3. Global Functional Sugar Revenue (USD Million) and CAGR (%) by Product (2021-2032)
By Type
Prebiotic Sugars
Low-Calorie Sweeteners
Sugar Alcohols
Molasses
Others
By Distribution Channel
Supermarkets/Hypermarkets
Convenience Stores
Specialty Stores
E-Commerce
Others
By Application
Food and Beverages
Pharmaceuticals
Cosmetics
Others
Chapter 8. Global Functional Sugar Regional Analysis and Outlook
8.1. Global Functional Sugar Revenue (USD Million) By Regions (2021- 2032)
8.2. North America Functional Sugar Revenue (USD Million) by Country (2021-2032)
8.2.1. United States Functional Sugar Regional Analysis and Outlook
8.2.2. Canada Functional Sugar Regional Analysis and Outlook
8.2.3. Mexico Functional Sugar Regional Analysis and Outlook
8.3. Europe Functional Sugar Revenue (USD Million), by Country (2021-2032)
8.3.1. Germany Functional Sugar Regional Analysis and Outlook
8.3.2. France Functional Sugar Regional Analysis and Outlook
8.3.3. United Kingdom Functional Sugar Regional Analysis and Outlook
8.3.4. Spain Functional Sugar Regional Analysis and Outlook
8.3.5. Italy Functional Sugar Regional Analysis and Outlook
8.3.6. Russia Functional Sugar Regional Analysis and Outlook
8.3.7. Rest of Europe Functional Sugar Regional Analysis and Outlook
8.4. Asia Pacific Functional Sugar Revenue (USD Million) by Country (2021-2032)
8.4.1. China Functional Sugar Regional Analysis and Outlook
8.4.2. Japan Functional Sugar Regional Analysis and Outlook
8.4.3. India Functional Sugar Regional Analysis and Outlook
8.4.4. South Korea Functional Sugar Regional Analysis and Outlook
8.4.5. Australia Functional Sugar Regional Analysis and Outlook
8.4.6. South East Asia Functional Sugar Regional Analysis and Outlook
8.4.7. Rest of Asia Pacific Functional Sugar Regional Analysis and Outlook
8.5. South America Functional Sugar Revenue (USD Million), by Country (2021-2032)
8.5.1. Brazil Functional Sugar Regional Analysis and Outlook
8.5.2. Argentina Functional Sugar Regional Analysis and Outlook
8.5.3. Rest of South America Functional Sugar Regional Analysis and Outlook
8.6. Middle East and Africa Functional Sugar Revenue (USD Million) by Country (2021-2032)
8.6.1. Middle East Functional Sugar Regional Analysis and Outlook
8.6.2. Africa Functional Sugar Regional Analysis and Outlook
Chapter 9. North America Functional Sugar Analysis and Outlook
9.1. North America Functional Sugar Revenue (USD Million) by Segments (2021-2032)
9.1.1. North America Functional Sugar Revenue (USD Million) by Type (2021-2032)
9.1.2. North America Functional Sugar Revenue (USD Million) by Application (2021-2032)
9.1.3. North America Functional Sugar Revenue (USD Million) by Product (2021-2032)
By Type
Prebiotic Sugars
Low-Calorie Sweeteners
Sugar Alcohols
Molasses
Others
By Distribution Channel
Supermarkets/Hypermarkets
Convenience Stores
Specialty Stores
E-Commerce
Others
By Application
Food and Beverages
Pharmaceuticals
Cosmetics
Others
Chapter 10. Europe Functional Sugar Analysis and Outlook
10.1. Europe Functional Sugar Revenue (USD Million), by Segments (USD Million) (2021-2032)
10.1.1. Europe Functional Sugar Revenue (USD Million) by Type (2021-2032)
10.1.2. Europe Functional Sugar Revenue (USD Million) by Application (2021-2032)
10.1.3. Europe Functional Sugar Revenue (USD Million) by Product (2021-2032)
By Type
Prebiotic Sugars
Low-Calorie Sweeteners
Sugar Alcohols
Molasses
Others
By Distribution Channel
Supermarkets/Hypermarkets
Convenience Stores
Specialty Stores
E-Commerce
Others
By Application
Food and Beverages
Pharmaceuticals
Cosmetics
Others
Chapter 11. Asia Pacific Functional Sugar Analysis and Outlook
11.1. Asia Pacific Functional Sugar Revenue (USD Million), and Revenue (USD Million) by Segments (2021-2032)
11.1.1. Asia Pacific Functional Sugar Revenue (USD Million) by Type (2021-2032)
11.1.2. Asia Pacific Functional Sugar Revenue (USD Million) by Application (2021-2032)
11.1.3. Asia Pacific Functional Sugar Revenue (USD Million) by Product (2021-2032)
By Type
Prebiotic Sugars
Low-Calorie Sweeteners
Sugar Alcohols
Molasses
Others
By Distribution Channel
Supermarkets/Hypermarkets
Convenience Stores
Specialty Stores
E-Commerce
Others
By Application
Food and Beverages
Pharmaceuticals
Cosmetics
Others
Chapter 12. South America Functional Sugar Analysis and Outlook
12.1. South America Functional Sugar Revenue (USD Million), by Segments (2021-2032)
12.1.1. South America Functional Sugar Revenue (USD Million) by Type (2021-2032)
12.1.2. South America Functional Sugar Revenue (USD Million) by Application (2021-2032)
12.1.3. South America Functional Sugar Revenue (USD Million) by Product (2021-2032)
By Type
Prebiotic Sugars
Low-Calorie Sweeteners
Sugar Alcohols
Molasses
Others
By Distribution Channel
Supermarkets/Hypermarkets
Convenience Stores
Specialty Stores
E-Commerce
Others
By Application
Food and Beverages
Pharmaceuticals
Cosmetics
Others
Chapter 13. Middle East and Africa Functional Sugar Analysis and Outlook
13.1. Middle East and Africa Functional Sugar Revenue (USD Million), by Segments (2021-2032)
13.1.1. Middle East and Africa Functional Sugar Revenue (USD Million) by Type (2021-2032)
13.1.2. Middle East and Africa Functional Sugar Revenue (USD Million) by Application (2021-2032)
13.1.3. Middle East and Africa Functional Sugar Revenue (USD Million) by Product (2021-2032)
By Type
Prebiotic Sugars
Low-Calorie Sweeteners
Sugar Alcohols
Molasses
Others
By Distribution Channel
Supermarkets/Hypermarkets
Convenience Stores
Specialty Stores
E-Commerce
Others
By Application
Food and Beverages
Pharmaceuticals
Cosmetics
Others
Chapter 14. Functional Sugar Company Profiles
14.1 Business Overview
14.2 Product Profiles
14.3 SWOT Profiles
14.5 Recent Developments
14.6 Financial Profile
List of Companies
Archer Daniels Midland Company (ADM)
BENEO GmbH
Cargill Inc
Cosucra Groupe Warcoing SA
DuPont
Ingredion Inc
Kerry Group Plc
Roquette Frères
Südzucker Group
Tate & Lyle Plc
15. Methodology and Data Sources
15.1 Customization Offerings
15.2 Subscription Services
15.3 Related Reports
15.4 Publisher Expertise
LIST OF TABLES
Table 1 Market Segmentation Analysis
Table 2 Global Functional Sugar Market Share of Leading Companies, 2023
Table 3 Product Offerings of Leading Companies
Table 4 Low Growth Scenario Forecasts
Table 5 Reference Case Growth Scenario
Table 6 High Growth Case Scenario
Table 7 Global Functional Sugar Revenue (USD Million) And CAGR (%) By Type (2021-2032)
Table 8 Global Functional Sugar Revenue (USD Million) And CAGR (%) By Application (2021-2032)
Table 9 Global Functional Sugar Revenue (USD Million) And CAGR (%) By Product (2021-2032)
Table 10 Global Functional Sugar Market Revenue (USD Million) By Regions (2021-2032)
Table 11 Global Functional Sugar Market Share (%) By Regions (2021-2032)
Table 12 North America Functional Sugar Revenue (USD Million) By Country (2021-2032)
Table 13 Europe Functional Sugar Revenue (USD Million) By Country (2021-2032)
Table 14 Asia Pacific Functional Sugar Revenue (USD Million) By Country (2021-2032)
Table 15 South America Functional Sugar Revenue (USD Million) By Country (2021-2032)
Table 16 Middle East and Africa Functional Sugar Revenue (USD Million) By Region (2021-2032)
Table 17 North America Functional Sugar Revenue (USD Million) By Type (2021-2032)
Table 18 North America Functional Sugar Revenue (USD Million) By Application (2021-2032)
Table 19 North America Functional Sugar Revenue (USD Million) By Product (2021-2032)
Table 20 Europe Functional Sugar Revenue (USD Million) By Type (2021-2032)
Table 21 Europe Functional Sugar Revenue (USD Million) By Application (2021-2032)
Table 22 Europe Functional Sugar Revenue (USD Million) By Product (2021-2032)
Table 23 Asia Pacific Functional Sugar Revenue (USD Million) By Type (2021-2032)
Table 24 Asia Pacific Functional Sugar Revenue (USD Million) By Application (2021-2032)
Table 25 Asia Pacific Functional Sugar Revenue (USD Million) By Product (2021-2032)
Table 26 South America Functional Sugar Revenue (USD Million) By Type (2021-2032)
Table 27 South America Functional Sugar Revenue (USD Million) By Application (2021-2032)
Table 28 South America Functional Sugar Revenue (USD Million) By Product (2021-2032)
Table 29 Middle East and Africa Functional Sugar Revenue (USD Million) By Type (2021-2032)
Table 30 Middle East and Africa Functional Sugar Revenue (USD Million) By Application (2021-2032)
Table 31 Middle East and Africa Functional Sugar Revenue (USD Million) By Product (2021-2032)
LIST OF FIGURES
Figure 1. Market Scope
Figure 2. Pricing Forecasts Per Unit, 2023- 2032
Figure 3. Porter’s Five Forces
Figure 4. Global Functional Sugar Market Revenue (USD Million) By Regions (2021-2032)
Figure 5. Global Functional Sugar Market Share (%) By Regions (2023)
Figure 6. North America Functional Sugar Revenue (USD Million) By Country (2021-2032)
Figure 7. United States Functional Sugar Revenue (USD Million) By Country (2021-2032)
Figure 8. Canada Functional Sugar Revenue (USD Million) By Country (2021-2032)
Figure 9. Mexico Functional Sugar Revenue (USD Million) By Country (2021-2032)
Figure 10. Europe Functional Sugar Revenue (USD Million) By Country (2021-2032)
Figure 11. Germany Functional Sugar Revenue (USD Million) By Country (2021-2032)
Figure 12. France Functional Sugar Revenue (USD Million) By Country (2021-2032)
Figure 13. United Kingdom Functional Sugar Revenue (USD Million) By Country (2021-2032)
Figure 14. Spain Functional Sugar Revenue (USD Million) By Country (2021-2032)
Figure 15. Italy Functional Sugar Revenue (USD Million) By Country (2021-2032)
Figure 16. Russia Functional Sugar Revenue (USD Million) By Country (2021-2032)
Figure 17. Rest of Europe Functional Sugar Revenue (USD Million) By Country (2021-2032)
Figure 11. Asia Pacific Functional Sugar Revenue (USD Million) By Country (2021-2032)
Figure 12. China Functional Sugar Revenue (USD Million) By Country (2021-2032)
Figure 13. Japan Functional Sugar Revenue (USD Million) By Country (2021-2032)
Figure 14. India Functional Sugar Revenue (USD Million) By Country (2021-2032)
Figure 15. South Korea Functional Sugar Revenue (USD Million) By Country (2021-2032)
Figure 16. Australia Functional Sugar Revenue (USD Million) By Country (2021-2032)
Figure 17. South East Asia Functional Sugar Revenue (USD Million) By Country (2021-2032)
Figure 18. South America Functional Sugar Revenue (USD Million) By Country (2021-2032)
Figure 19. Brazil Functional Sugar Revenue (USD Million) By Country (2021-2032)
Figure 20. Argentina Functional Sugar Revenue (USD Million) By Country (2021-2032)
Figure 21. Rest of Asia Pacific Functional Sugar Revenue (USD Million) By Country (2021-2032)
Figure 22. Middle East and Africa Functional Sugar Revenue (USD Million) By Region (2021-2032)
Figure 23. Saudi Arabia Functional Sugar Revenue (USD Million) By Region (2021-2032)
Figure 24. The UAE Functional Sugar Revenue (USD Million) By Region (2021-2032)
Figure 25. Rest of Middle East Functional Sugar Revenue (USD Million) By Region (2021-2032)
Figure 26. South Africa Functional Sugar Revenue (USD Million) By Region (2021-2032)
Figure 27. Africa Functional Sugar Revenue (USD Million) By Region (2021-2032)
Figure 28. North America Functional Sugar Revenue (USD Million) By Type (2021-2032)
Figure 29. North America Functional Sugar Revenue (USD Million) By Application (2021-2032)
Figure 30. North America Functional Sugar Revenue (USD Million) By Product (2021-2032)
Figure 31. Europe Functional Sugar Revenue (USD Million) By Type (2021-2032)
Figure 32. Europe Functional Sugar Revenue (USD Million) By Application (2021-2032)
Figure 33. Europe Functional Sugar Revenue (USD Million) By Product (2021-2032)
Figure 34. Asia Pacific Functional Sugar Revenue (USD Million) By Type (2021-2032)
Figure 35. Asia Pacific Functional Sugar Revenue (USD Million) By Application (2021-2032)
Figure 36. Asia Pacific Functional Sugar Revenue (USD Million) By Product (2021-2032)
Figure 37. South America Functional Sugar Revenue (USD Million) By Type (2021-2032)
Figure 38. South America Functional Sugar Revenue (USD Million) By Application (2021-2032)
Figure 39. South America Functional Sugar Revenue (USD Million) By Product (2021-2032)
Figure 40. Middle East and Africa Functional Sugar Revenue (USD Million) By Type (2021-2032)
Figure 41. Middle East and Africa Functional Sugar Revenue (USD Million) By Application (2021-2032)
Figure 42. Middle East and Africa Functional Sugar Revenue (USD Million) By Product (2021-2032)
By Type
Prebiotic Sugars
Low-Calorie Sweeteners
Sugar Alcohols
Molasses
Others
By Distribution Channel
Supermarkets/Hypermarkets
Convenience Stores
Specialty Stores
E-Commerce
Others
By Application
Food and Beverages
Pharmaceuticals
Cosmetics
Others
Countries Analyzed
North America (US, Canada, Mexico)
Europe (Germany, UK, France, Spain, Italy, Russia, Rest of Europe)
Asia Pacific (China, India, Japan, South Korea, Australia, South East Asia, Rest of Asia)
South America (Brazil, Argentina, Rest of South America)
Middle East and Africa (Saudi Arabia, UAE, Rest of Middle East, South Africa, Egypt, Rest of Africa)
