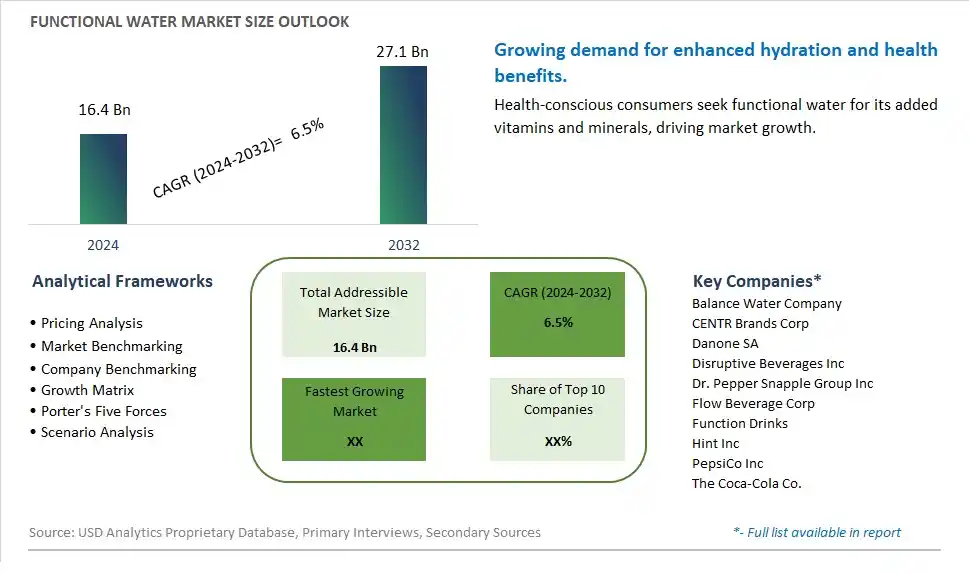
Global Functional Water Market Size is valued at $16.4 Billion in 2024 and is forecast to register a growth rate (CAGR) of 6.5% to reach $27.1 Billion by 2032.
The global Functional Water Market Comprehensive Study analyzes and forecasts the market size across 6 regions and 24 countries for diverse segments -By Product (Vitamin, Protein, Others), By Distribution Channel (Supermarkets/ Hypermarkets, Convenience/Grocery Stores, Online Retail Stores, Others)
An Introduction to Functional Water Market
The functional water market is witnessing rapid growth in 2024, driven by the increasing demand for healthier and functional beverages, the rising prevalence of lifestyle-related health issues, and the growing consumer awareness of hydration and wellness. Functional water, infused with vitamins, minerals, antioxidants, electrolytes, or herbal extracts, offers hydration with added health benefits, catering to the evolving needs and preferences of health-conscious consumers. With the rise of personalized nutrition and wellness trends, functional water is gaining traction as a convenient and customizable beverage option, targeting specific health concerns such as immunity, energy, digestion, and relaxation. Moreover, the sports and fitness industry is embracing functional water as a hydrating and performance-enhancing drink, suitable for pre, during, and post-workout consumption. Additionally, the beauty and personal care sector are launching functional water products with collagen, biotin, or hyaluronic acid for skin hydration and rejuvenation, further expanding market opportunities. As consumers seek innovative and functional solutions for their hydration needs, the functional water market is poised for continued growth and product innovation in the coming years.
Functional Water Competitive Landscape
The market report analyses the leading companies in the industry including Balance Water Company, CENTR Brands Corp, Danone SA, Disruptive Beverages Inc, Dr. Pepper Snapple Group Inc, Flow Beverage Corp, Function Drinks, Hint Inc, PepsiCo Inc, The Coca-Cola Co., and Others.
Functional Water Market Dynamics
Functional Water Market Trend: Growing Demand for Health and Wellness Beverages
One prominent trend in the functional water market is the growing demand for health and wellness beverages. As consumers become increasingly health-conscious and seek out products that offer functional benefits, there's a rising interest in functional waters enriched with vitamins, minerals, antioxidants, and other bioactive ingredients. Functional waters are perceived as convenient and refreshing options for hydration that also provide additional health benefits such as immune support, hydration enhancement, energy boost, or stress relief. This trend is driving the expansion of the functional water market as consumers incorporate these beverages into their daily routines to support their overall well-being.
Market Driver: Shift Towards Healthy Hydration Alternatives
A key driver in the functional water market is the shift towards healthy hydration alternatives. With growing concerns about sugar-laden beverages and artificial additives in traditional soft drinks and sports drinks, consumers are seeking healthier options for hydration that offer both refreshment and functional benefits. Functional waters, often formulated with natural ingredients and low or no added sugars, are positioned as alternatives to sugary sodas and energy drinks, appealing to health-conscious consumers seeking better-for-you beverage options. This driver fuels market growth as consumers prioritize hydration solutions that align with their health and wellness goals, driving demand for functional waters that offer hydration plus added functional benefits.
Market Opportunity: Innovation in Functional Ingredients and Product Formulations
An emerging opportunity in the functional water market is innovation in functional ingredients and product formulations. Beyond basic hydration, there's potential to develop functional waters with targeted health benefits that address specific consumer needs and preferences. By incorporating innovative ingredients such as adaptogens, probiotics, CBD, electrolytes, or plant extracts, functional water manufacturers can create specialized formulations tailored to support energy, focus, relaxation, digestion, or other health goals. Additionally, there's an opportunity to explore new product formats such as flavored sparkling waters, infused waters, or water enhancers that offer customizable hydration experiences and flavor profiles. By staying ahead of consumer trends and investing in research and development, functional water brands can differentiate their offerings and capitalize on the growing demand for functional and health-enhancing beverages.
Functional Water Market Share Analysis: Vitamin Water held the dominant market share in 2024
Within the Functional Water Market, the Vitamin Water segment is the largest, driven by its widespread popularity and perceived health benefits. Vitamin-infused waters offer consumers a convenient and refreshing way to supplement their daily nutrient intake while staying hydrated. With consumers increasingly prioritizing health and wellness, the demand for functional beverages fortified with vitamins has surged. Vitamin water provides an easy and flavorful alternative to traditional supplements, appealing to a broad spectrum of health-conscious consumers. Further, the versatility of vitamin water allows for a wide range of formulations and flavors, catering to diverse tastes and preferences. As the trend towards preventive healthcare and holistic wellness continues to grow, the Vitamin Water segment maintains its dominance, solidifying its position as the largest and most sought-after category in the Functional Water Market.
Functional Water Market Share Analysis: Online Retail Stores market is poised to register the fastest growth rae over the forecast period to 2032
In the ever-evolving landscape of the Functional Water Market, the Online Retail Stores segment is the fastest-growing, driven by shifting consumer preferences towards e-commerce and digital shopping platforms. The convenience and accessibility offered by online retailers have transformed the way consumers purchase functional water, providing a seamless shopping experience from the comfort of their homes. Additionally, the COVID-19 pandemic has accelerated the adoption of online shopping as consumers prioritize safety and contactless transactions. The ability to browse a wide selection of products, compare prices, and access exclusive deals online has propelled the growth of the Online Retail Stores segment, attracting a broader demographic of consumers. As digital infrastructure continues to evolve and online retailers invest in enhancing the user experience, the Online Retail Stores segment is poised to sustain its rapid growth trajectory, reshaping the Functional Water Market with innovation and convenience. Additionally, online platforms offer consumers access to a diverse range of functional water products, including specialty formulations and unique flavors, which may not be readily available in traditional brick-and-mortar stores.
Functional Water Market Segmentation
By Product
Vitamin
Protein
Others
By Distribution Channel
Supermarkets/ Hypermarkets
Convenience/Grocery Stores
Online Retail Stores
Others
Countries Analyzed
North America (US, Canada, Mexico)
Europe (Germany, UK, France, Spain, Italy, Russia, Rest of Europe)
Asia Pacific (China, India, Japan, South Korea, Australia, South East Asia, Rest of Asia)
South America (Brazil, Argentina, Rest of South America)
Middle East and Africa (Saudi Arabia, UAE, Rest of Middle East, South Africa, Egypt, Rest of Africa)
Functional Water Companies Profiled in the Study
Balance Water Company
CENTR Brands Corp
Danone SA
Disruptive Beverages Inc
Dr. Pepper Snapple Group Inc
Flow Beverage Corp
Function Drinks
Hint Inc
PepsiCo Inc
The Coca-Cola Co.
*- List Not Exhaustive
Chapter 1. TABLE OF CONTENTS
Chapter 2. Introduction to Functional Water Market
2.1. Market Overview
2.2. Key Statistics and Report Highlights
2.3. Scope of the Comprehensive Study
2.3.1. Market Definition
2.3.2 Countries and Regions Covered
2.3.3 Research Objective
2.3.4 Units, Currency, and Conversions
2.3.5 Industry Value Chain
2.4. Key Market Segments
2.5. Key Companies
2.6. Study Period
Chapter 3. Strategic Analysis Review
3.1. Functional Water Pricing Analysis and Forecast
3.2. Porter’s Five Forces
3.3. Market Ecosystem
3.4. SWOT Analysis
3.5. Regulatory Scenario
3.3. Effects of Inflation, Russia-Ukraine War, moderating economic growth, and other macroeconomic factors
Chapter 4. Competitive Landscape
4.1. Market Share Analysis
4.1.1. Global Functional Water Market Share by Company, 2023
4.1.2. Product Offerings of Leading Functional Water Companies
4.2. Market Entropy
4.2.1. New Product Launches in the Industry
4.2.2. Mergers, Acquisitions, Joint ventures, and Partnerships
4.3. Key Strategies and Best Practices
Chapter 5. Global Market Projections: Best, Reference, and Low Case Scenarios
5.1. Growth Analysis- Case Scenario Definitions
5.2. Low Growth Case Scenario Forecasts
5.3. Reference Growth Case Scenario Forecasts
5.4. High Growth Case Scenario Forecasts
Chapter 6. Market Dynamics
6.1. Functional Water Market Drivers
6.2. Functional Water Market Challenges
6.6. Functional Water Market Opportunities
6.4. Functional Water Market Trends
Chapter 7. Global Functional Water Market Outlook Trends
7.1. Global Functional Water Revenue (USD Million) and CAGR (%) by Type (2021-2032)
7.2. Global Functional Water Revenue (USD Million) and CAGR (%) by Application (2021-2032)
7.3. Global Functional Water Revenue (USD Million) and CAGR (%) by Product (2021-2032)
By Product
Vitamin
Protein
Others
By Distribution Channel
Supermarkets/ Hypermarkets
Convenience/Grocery Stores
Online Retail Stores
Others
Chapter 8. Global Functional Water Regional Analysis and Outlook
8.1. Global Functional Water Revenue (USD Million) By Regions (2021- 2032)
8.2. North America Functional Water Revenue (USD Million) by Country (2021-2032)
8.2.1. United States Functional Water Regional Analysis and Outlook
8.2.2. Canada Functional Water Regional Analysis and Outlook
8.2.3. Mexico Functional Water Regional Analysis and Outlook
8.3. Europe Functional Water Revenue (USD Million), by Country (2021-2032)
8.3.1. Germany Functional Water Regional Analysis and Outlook
8.3.2. France Functional Water Regional Analysis and Outlook
8.3.3. United Kingdom Functional Water Regional Analysis and Outlook
8.3.4. Spain Functional Water Regional Analysis and Outlook
8.3.5. Italy Functional Water Regional Analysis and Outlook
8.3.6. Russia Functional Water Regional Analysis and Outlook
8.3.7. Rest of Europe Functional Water Regional Analysis and Outlook
8.4. Asia Pacific Functional Water Revenue (USD Million) by Country (2021-2032)
8.4.1. China Functional Water Regional Analysis and Outlook
8.4.2. Japan Functional Water Regional Analysis and Outlook
8.4.3. India Functional Water Regional Analysis and Outlook
8.4.4. South Korea Functional Water Regional Analysis and Outlook
8.4.5. Australia Functional Water Regional Analysis and Outlook
8.4.6. South East Asia Functional Water Regional Analysis and Outlook
8.4.7. Rest of Asia Pacific Functional Water Regional Analysis and Outlook
8.5. South America Functional Water Revenue (USD Million), by Country (2021-2032)
8.5.1. Brazil Functional Water Regional Analysis and Outlook
8.5.2. Argentina Functional Water Regional Analysis and Outlook
8.5.3. Rest of South America Functional Water Regional Analysis and Outlook
8.6. Middle East and Africa Functional Water Revenue (USD Million) by Country (2021-2032)
8.6.1. Middle East Functional Water Regional Analysis and Outlook
8.6.2. Africa Functional Water Regional Analysis and Outlook
Chapter 9. North America Functional Water Analysis and Outlook
9.1. North America Functional Water Revenue (USD Million) by Segments (2021-2032)
9.1.1. North America Functional Water Revenue (USD Million) by Type (2021-2032)
9.1.2. North America Functional Water Revenue (USD Million) by Application (2021-2032)
9.1.3. North America Functional Water Revenue (USD Million) by Product (2021-2032)
By Product
Vitamin
Protein
Others
By Distribution Channel
Supermarkets/ Hypermarkets
Convenience/Grocery Stores
Online Retail Stores
Others
Chapter 10. Europe Functional Water Analysis and Outlook
10.1. Europe Functional Water Revenue (USD Million), by Segments (USD Million) (2021-2032)
10.1.1. Europe Functional Water Revenue (USD Million) by Type (2021-2032)
10.1.2. Europe Functional Water Revenue (USD Million) by Application (2021-2032)
10.1.3. Europe Functional Water Revenue (USD Million) by Product (2021-2032)
By Product
Vitamin
Protein
Others
By Distribution Channel
Supermarkets/ Hypermarkets
Convenience/Grocery Stores
Online Retail Stores
Others
Chapter 11. Asia Pacific Functional Water Analysis and Outlook
11.1. Asia Pacific Functional Water Revenue (USD Million), and Revenue (USD Million) by Segments (2021-2032)
11.1.1. Asia Pacific Functional Water Revenue (USD Million) by Type (2021-2032)
11.1.2. Asia Pacific Functional Water Revenue (USD Million) by Application (2021-2032)
11.1.3. Asia Pacific Functional Water Revenue (USD Million) by Product (2021-2032)
By Product
Vitamin
Protein
Others
By Distribution Channel
Supermarkets/ Hypermarkets
Convenience/Grocery Stores
Online Retail Stores
Others
Chapter 12. South America Functional Water Analysis and Outlook
12.1. South America Functional Water Revenue (USD Million), by Segments (2021-2032)
12.1.1. South America Functional Water Revenue (USD Million) by Type (2021-2032)
12.1.2. South America Functional Water Revenue (USD Million) by Application (2021-2032)
12.1.3. South America Functional Water Revenue (USD Million) by Product (2021-2032)
By Product
Vitamin
Protein
Others
By Distribution Channel
Supermarkets/ Hypermarkets
Convenience/Grocery Stores
Online Retail Stores
Others
Chapter 13. Middle East and Africa Functional Water Analysis and Outlook
13.1. Middle East and Africa Functional Water Revenue (USD Million), by Segments (2021-2032)
13.1.1. Middle East and Africa Functional Water Revenue (USD Million) by Type (2021-2032)
13.1.2. Middle East and Africa Functional Water Revenue (USD Million) by Application (2021-2032)
13.1.3. Middle East and Africa Functional Water Revenue (USD Million) by Product (2021-2032)
By Product
Vitamin
Protein
Others
By Distribution Channel
Supermarkets/ Hypermarkets
Convenience/Grocery Stores
Online Retail Stores
Others
Chapter 14. Functional Water Company Profiles
14.1 Business Overview
14.2 Product Profiles
14.3 SWOT Profiles
14.5 Recent Developments
14.6 Financial Profile
List of Companies
Balance Water Company
CENTR Brands Corp
Danone SA
Disruptive Beverages Inc
Dr. Pepper Snapple Group Inc
Flow Beverage Corp
Function Drinks
Hint Inc
PepsiCo Inc
The Coca-Cola Co.
15. Methodology and Data Sources
15.1 Customization Offerings
15.2 Subscription Services
15.3 Related Reports
15.4 Publisher Expertise
LIST OF TABLES
Table 1 Market Segmentation Analysis
Table 2 Global Functional Water Market Share of Leading Companies, 2023
Table 3 Product Offerings of Leading Companies
Table 4 Low Growth Scenario Forecasts
Table 5 Reference Case Growth Scenario
Table 6 High Growth Case Scenario
Table 7 Global Functional Water Revenue (USD Million) And CAGR (%) By Type (2021-2032)
Table 8 Global Functional Water Revenue (USD Million) And CAGR (%) By Application (2021-2032)
Table 9 Global Functional Water Revenue (USD Million) And CAGR (%) By Product (2021-2032)
Table 10 Global Functional Water Market Revenue (USD Million) By Regions (2021-2032)
Table 11 Global Functional Water Market Share (%) By Regions (2021-2032)
Table 12 North America Functional Water Revenue (USD Million) By Country (2021-2032)
Table 13 Europe Functional Water Revenue (USD Million) By Country (2021-2032)
Table 14 Asia Pacific Functional Water Revenue (USD Million) By Country (2021-2032)
Table 15 South America Functional Water Revenue (USD Million) By Country (2021-2032)
Table 16 Middle East and Africa Functional Water Revenue (USD Million) By Region (2021-2032)
Table 17 North America Functional Water Revenue (USD Million) By Type (2021-2032)
Table 18 North America Functional Water Revenue (USD Million) By Application (2021-2032)
Table 19 North America Functional Water Revenue (USD Million) By Product (2021-2032)
Table 20 Europe Functional Water Revenue (USD Million) By Type (2021-2032)
Table 21 Europe Functional Water Revenue (USD Million) By Application (2021-2032)
Table 22 Europe Functional Water Revenue (USD Million) By Product (2021-2032)
Table 23 Asia Pacific Functional Water Revenue (USD Million) By Type (2021-2032)
Table 24 Asia Pacific Functional Water Revenue (USD Million) By Application (2021-2032)
Table 25 Asia Pacific Functional Water Revenue (USD Million) By Product (2021-2032)
Table 26 South America Functional Water Revenue (USD Million) By Type (2021-2032)
Table 27 South America Functional Water Revenue (USD Million) By Application (2021-2032)
Table 28 South America Functional Water Revenue (USD Million) By Product (2021-2032)
Table 29 Middle East and Africa Functional Water Revenue (USD Million) By Type (2021-2032)
Table 30 Middle East and Africa Functional Water Revenue (USD Million) By Application (2021-2032)
Table 31 Middle East and Africa Functional Water Revenue (USD Million) By Product (2021-2032)
LIST OF FIGURES
Figure 1. Market Scope
Figure 2. Pricing Forecasts Per Unit, 2023- 2032
Figure 3. Porter’s Five Forces
Figure 4. Global Functional Water Market Revenue (USD Million) By Regions (2021-2032)
Figure 5. Global Functional Water Market Share (%) By Regions (2023)
Figure 6. North America Functional Water Revenue (USD Million) By Country (2021-2032)
Figure 7. United States Functional Water Revenue (USD Million) By Country (2021-2032)
Figure 8. Canada Functional Water Revenue (USD Million) By Country (2021-2032)
Figure 9. Mexico Functional Water Revenue (USD Million) By Country (2021-2032)
Figure 10. Europe Functional Water Revenue (USD Million) By Country (2021-2032)
Figure 11. Germany Functional Water Revenue (USD Million) By Country (2021-2032)
Figure 12. France Functional Water Revenue (USD Million) By Country (2021-2032)
Figure 13. United Kingdom Functional Water Revenue (USD Million) By Country (2021-2032)
Figure 14. Spain Functional Water Revenue (USD Million) By Country (2021-2032)
Figure 15. Italy Functional Water Revenue (USD Million) By Country (2021-2032)
Figure 16. Russia Functional Water Revenue (USD Million) By Country (2021-2032)
Figure 17. Rest of Europe Functional Water Revenue (USD Million) By Country (2021-2032)
Figure 11. Asia Pacific Functional Water Revenue (USD Million) By Country (2021-2032)
Figure 12. China Functional Water Revenue (USD Million) By Country (2021-2032)
Figure 13. Japan Functional Water Revenue (USD Million) By Country (2021-2032)
Figure 14. India Functional Water Revenue (USD Million) By Country (2021-2032)
Figure 15. South Korea Functional Water Revenue (USD Million) By Country (2021-2032)
Figure 16. Australia Functional Water Revenue (USD Million) By Country (2021-2032)
Figure 17. South East Asia Functional Water Revenue (USD Million) By Country (2021-2032)
Figure 18. South America Functional Water Revenue (USD Million) By Country (2021-2032)
Figure 19. Brazil Functional Water Revenue (USD Million) By Country (2021-2032)
Figure 20. Argentina Functional Water Revenue (USD Million) By Country (2021-2032)
Figure 21. Rest of Asia Pacific Functional Water Revenue (USD Million) By Country (2021-2032)
Figure 22. Middle East and Africa Functional Water Revenue (USD Million) By Region (2021-2032)
Figure 23. Saudi Arabia Functional Water Revenue (USD Million) By Region (2021-2032)
Figure 24. The UAE Functional Water Revenue (USD Million) By Region (2021-2032)
Figure 25. Rest of Middle East Functional Water Revenue (USD Million) By Region (2021-2032)
Figure 26. South Africa Functional Water Revenue (USD Million) By Region (2021-2032)
Figure 27. Africa Functional Water Revenue (USD Million) By Region (2021-2032)
Figure 28. North America Functional Water Revenue (USD Million) By Type (2021-2032)
Figure 29. North America Functional Water Revenue (USD Million) By Application (2021-2032)
Figure 30. North America Functional Water Revenue (USD Million) By Product (2021-2032)
Figure 31. Europe Functional Water Revenue (USD Million) By Type (2021-2032)
Figure 32. Europe Functional Water Revenue (USD Million) By Application (2021-2032)
Figure 33. Europe Functional Water Revenue (USD Million) By Product (2021-2032)
Figure 34. Asia Pacific Functional Water Revenue (USD Million) By Type (2021-2032)
Figure 35. Asia Pacific Functional Water Revenue (USD Million) By Application (2021-2032)
Figure 36. Asia Pacific Functional Water Revenue (USD Million) By Product (2021-2032)
Figure 37. South America Functional Water Revenue (USD Million) By Type (2021-2032)
Figure 38. South America Functional Water Revenue (USD Million) By Application (2021-2032)
Figure 39. South America Functional Water Revenue (USD Million) By Product (2021-2032)
Figure 40. Middle East and Africa Functional Water Revenue (USD Million) By Type (2021-2032)
Figure 41. Middle East and Africa Functional Water Revenue (USD Million) By Application (2021-2032)
Figure 42. Middle East and Africa Functional Water Revenue (USD Million) By Product (2021-2032)
By Product
Vitamin
Protein
Others
By Distribution Channel
Supermarkets/ Hypermarkets
Convenience/Grocery Stores
Online Retail Stores
Others
Countries Analyzed
North America (US, Canada, Mexico)
Europe (Germany, UK, France, Spain, Italy, Russia, Rest of Europe)
Asia Pacific (China, India, Japan, South Korea, Australia, South East Asia, Rest of Asia)
South America (Brazil, Argentina, Rest of South America)
Middle East and Africa (Saudi Arabia, UAE, Rest of Middle East, South Africa, Egypt, Rest of Africa)
