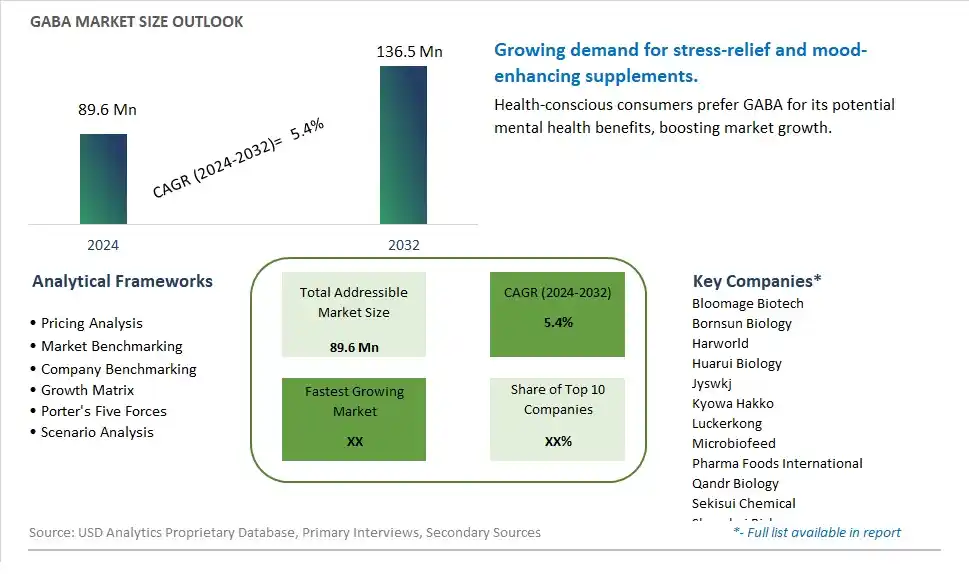
Global GABA Market Size is valued at $89.6 Million in 2024 and is forecast to register a growth rate (CAGR) of 5.4% to reach $136.5 Million by 2032.
The global GABA Market Comprehensive Study analyzes and forecasts the market size across 6 regions and 24 countries for diverse segments -By Type (Microbial Fermentation (Feed Grade), Microbial Fermentation (Food Grade), Chemical Synthesis), By Application (Animal Feed, Food, Medicine, Plant Growth Promoter, Cosmetic, Others)
An Introduction to GABA Market
The GABA market in 2024 is thriving, fueled by the rising demand for natural and effective supplements that promote relaxation and mental well-being. Gamma-Aminobutyric Acid (GABA), known for its calming effects on the nervous system, is popular in dietary supplements and functional foods. The market benefits from advancements in GABA production and formulation technologies, the growing trend of mental health and wellness, and the expansion of the global nutraceutical sector. Additionally, the increasing awareness of the benefits of GABA for reducing stress and enhancing sleep quality is driving market growth.
GABA Competitive Landscape
The market report analyses the leading companies in the industry including Bloomage Biotech, Bornsun Biology, Harworld, Huarui Biology, Jyswkj, Kyowa Hakko, Luckerkong, Microbiofeed, Pharma Foods International, Qandr Biology, Sekisui Chemical, Shanghai Richen, Sino Biotek, Viab Life, Xinyou Chemistry, Zhejiang Yiwan Bio, Zjtr Chemistry, and Others.
GABA Market Dynamics
GABA Market Trend: Rising Interest in Natural Stress-Relief Solutions
The most prominent trend in the GABA Market is the rising interest in natural stress-relief solutions. As consumers seek alternatives to pharmaceutical products for managing stress and anxiety, GABA (gamma-aminobutyric acid) is gaining popularity for its natural calming effects. This trend is driven by the growing demand for natural and holistic health products that support mental well-being without adverse side effects.
GABA Market Driver: Increase in Mental Health Awareness
The key driver of the GABA Market is the increase in mental health awareness. As more people recognize the importance of mental health and seek ways to manage stress and anxiety, there is a higher demand for natural supplements that promote relaxation and mental clarity. GABA supplements, known for their role in neurotransmission and calming effects, are increasingly sought after by health-conscious consumers looking for natural ways to support their mental health.
GABA Market Opportunity: Development of Functional Foods and Beverages
A significant opportunity in the GABA Market lies in the development of functional foods and beverages that incorporate GABA. By creating products that offer both nutritional benefits and stress-relief properties, companies can attract a broader audience. Offering innovative GABA-infused products, such as beverages, snacks, and dietary supplements, can help meet the growing demand for convenient and natural mental health solutions, driving market growth.
GABA Market Share Analysis: Microbial Fermentation (Food Grade) is the fastest growing segment over the forecast period to 2032
Microbial Fermentation (Food Grade) is the fastest-growing segment within the GABA (Gamma-Aminobutyric Acid) Market by type, projected to experience significant growth up to 2032. This growth is driven by the increasing consumer demand for natural and health-enhancing food ingredients. GABA produced through microbial fermentation is considered a natural process, aligning with the growing trend towards clean-label products and natural food additives. Food-grade GABA is widely used in functional foods and beverages, dietary supplements, and nutraceuticals due to its potential health benefits, including stress relief, improved sleep quality, and enhanced mental focus. The rise in health-conscious consumers seeking natural remedies for mental and physical well-being has significantly boosted the demand for GABA in the food and beverage industry. Additionally, advancements in fermentation technology have improved the efficiency and scalability of GABA production, making it more accessible and cost-effective for manufacturers. As the trend towards natural health products continues to rise, the demand for food-grade GABA produced through microbial fermentation is expected to soar, solidifying its position as the fastest-growing segment in the GABA market.
GABA Market Share Analysis: Microbial Fermentation (Food Grade) segment generated the highest revenue share in the industry
Microbial Fermentation (Food Grade) is also the largest segment within the GABA Market by type. This segment's dominance is attributed to the broad application range and high consumer acceptance of food-grade GABA. Products containing GABA are marketed for their health benefits, which appeal to a wide demographic seeking natural ways to enhance their well-being. The extensive use of food-grade GABA in functional foods, beverages, and supplements, combined with its recognized efficacy and safety, drives its significant market share. As consumers increasingly prioritize natural and health-promoting ingredients, the demand for food-grade GABA produced through microbial fermentation is expected to remain robust, maintaining its position as the largest segment in the GABA market.
GABA Market Share Analysis: Food is the fastest growing segment over the forecast period to 2032
The Food segment is the fastest-growing within the GABA (Gamma-Aminobutyric Acid) Market by application, projected to experience significant growth up to 2032. This rapid expansion is driven by the increasing consumer awareness and demand for functional foods that offer health benefits beyond basic nutrition. GABA is widely recognized for its potential benefits in reducing stress, improving sleep quality, and enhancing mental focus, making it a highly sought-after ingredient in the food industry. The rise of health-conscious consumers seeking natural and effective ways to improve their well-being has significantly boosted the incorporation of GABA into various food products, such as functional beverages, dairy products, snacks, and dietary supplements. The trend towards clean-label and natural ingredients further supports the growth of GABA in the food segment, as consumers prefer products that are free from synthetic additives and chemicals. Additionally, advancements in food processing and formulation technologies have made it easier to incorporate GABA into a wide range of food products without compromising taste and texture. As the demand for functional foods continues to rise, the food segment is expected to maintain its rapid growth, solidifying its position as the fastest-growing application in the GABA market.
GABA Market Segmentation
By Type
Microbial Fermentation (Feed Grade)
Microbial Fermentation (Food Grade)
Chemical Synthesis
By Application
Animal Feed
Food
Medicine
Plant Growth Promoter
Cosmetic
Others
Countries Analyzed
North America (US, Canada, Mexico)
Europe (Germany, UK, France, Spain, Italy, Russia, Rest of Europe)
Asia Pacific (China, India, Japan, South Korea, Australia, South East Asia, Rest of Asia)
South America (Brazil, Argentina, Rest of South America)
Middle East and Africa (Saudi Arabia, UAE, Rest of Middle East, South Africa, Egypt, Rest of Africa)
GABA Companies Profiled in the Study
Bloomage Biotech
Bornsun Biology
Harworld
Huarui Biology
Jyswkj
Kyowa Hakko
Luckerkong
Microbiofeed
Pharma Foods International
Qandr Biology
Sekisui Chemical
Shanghai Richen
Sino Biotek
Viab Life
Xinyou Chemistry
Zhejiang Yiwan Bio
Zjtr Chemistry
*- List Not Exhaustive
Chapter 1. TABLE OF CONTENTS
Chapter 2. Introduction to GABA Market
2.1. Market Overview
2.2. Key Statistics and Report Highlights
2.3. Scope of the Comprehensive Study
2.3.1. Market Definition
2.3.2 Countries and Regions Covered
2.3.3 Research Objective
2.3.4 Units, Currency, and Conversions
2.3.5 Industry Value Chain
2.4. Key Market Segments
2.5. Key Companies
2.6. Study Period
Chapter 3. Strategic Analysis Review
3.1. GABA Pricing Analysis and Forecast
3.2. Porter’s Five Forces
3.3. Market Ecosystem
3.4. SWOT Analysis
3.5. Regulatory Scenario
3.3. Effects of Inflation, Russia-Ukraine War, moderating economic growth, and other macroeconomic factors
Chapter 4. Competitive Landscape
4.1. Market Share Analysis
4.1.1. Global GABA Market Share by Company, 2023
4.1.2. Product Offerings of Leading GABA Companies
4.2. Market Entropy
4.2.1. New Product Launches in the Industry
4.2.2. Mergers, Acquisitions, Joint ventures, and Partnerships
4.3. Key Strategies and Best Practices
Chapter 5. Global Market Projections: Best, Reference, and Low Case Scenarios
5.1. Growth Analysis- Case Scenario Definitions
5.2. Low Growth Case Scenario Forecasts
5.3. Reference Growth Case Scenario Forecasts
5.4. High Growth Case Scenario Forecasts
Chapter 6. Market Dynamics
6.1. GABA Market Drivers
6.2. GABA Market Challenges
6.6. GABA Market Opportunities
6.4. GABA Market Trends
Chapter 7. Global GABA Market Outlook Trends
7.1. Global GABA Revenue (USD Million) and CAGR (%) by Type (2021-2032)
7.2. Global GABA Revenue (USD Million) and CAGR (%) by Application (2021-2032)
7.3. Global GABA Revenue (USD Million) and CAGR (%) by Product (2021-2032)
By Type
Microbial Fermentation (Feed Grade)
Microbial Fermentation (Food Grade)
Chemical Synthesis
By Application
Animal Feed
Food
Medicine
Plant Growth Promoter
Cosmetic
Others
Chapter 8. Global GABA Regional Analysis and Outlook
8.1. Global GABA Revenue (USD Million) By Regions (2021- 2032)
8.2. North America GABA Revenue (USD Million) by Country (2021-2032)
8.2.1. United States GABA Regional Analysis and Outlook
8.2.2. Canada GABA Regional Analysis and Outlook
8.2.3. Mexico GABA Regional Analysis and Outlook
8.3. Europe GABA Revenue (USD Million), by Country (2021-2032)
8.3.1. Germany GABA Regional Analysis and Outlook
8.3.2. France GABA Regional Analysis and Outlook
8.3.3. United Kingdom GABA Regional Analysis and Outlook
8.3.4. Spain GABA Regional Analysis and Outlook
8.3.5. Italy GABA Regional Analysis and Outlook
8.3.6. Russia GABA Regional Analysis and Outlook
8.3.7. Rest of Europe GABA Regional Analysis and Outlook
8.4. Asia Pacific GABA Revenue (USD Million) by Country (2021-2032)
8.4.1. China GABA Regional Analysis and Outlook
8.4.2. Japan GABA Regional Analysis and Outlook
8.4.3. India GABA Regional Analysis and Outlook
8.4.4. South Korea GABA Regional Analysis and Outlook
8.4.5. Australia GABA Regional Analysis and Outlook
8.4.6. South East Asia GABA Regional Analysis and Outlook
8.4.7. Rest of Asia Pacific GABA Regional Analysis and Outlook
8.5. South America GABA Revenue (USD Million), by Country (2021-2032)
8.5.1. Brazil GABA Regional Analysis and Outlook
8.5.2. Argentina GABA Regional Analysis and Outlook
8.5.3. Rest of South America GABA Regional Analysis and Outlook
8.6. Middle East and Africa GABA Revenue (USD Million) by Country (2021-2032)
8.6.1. Middle East GABA Regional Analysis and Outlook
8.6.2. Africa GABA Regional Analysis and Outlook
Chapter 9. North America GABA Analysis and Outlook
9.1. North America GABA Revenue (USD Million) by Segments (2021-2032)
9.1.1. North America GABA Revenue (USD Million) by Type (2021-2032)
9.1.2. North America GABA Revenue (USD Million) by Application (2021-2032)
9.1.3. North America GABA Revenue (USD Million) by Product (2021-2032)
By Type
Microbial Fermentation (Feed Grade)
Microbial Fermentation (Food Grade)
Chemical Synthesis
By Application
Animal Feed
Food
Medicine
Plant Growth Promoter
Cosmetic
Others
Chapter 10. Europe GABA Analysis and Outlook
10.1. Europe GABA Revenue (USD Million), by Segments (USD Million) (2021-2032)
10.1.1. Europe GABA Revenue (USD Million) by Type (2021-2032)
10.1.2. Europe GABA Revenue (USD Million) by Application (2021-2032)
10.1.3. Europe GABA Revenue (USD Million) by Product (2021-2032)
By Type
Microbial Fermentation (Feed Grade)
Microbial Fermentation (Food Grade)
Chemical Synthesis
By Application
Animal Feed
Food
Medicine
Plant Growth Promoter
Cosmetic
Others
Chapter 11. Asia Pacific GABA Analysis and Outlook
11.1. Asia Pacific GABA Revenue (USD Million), and Revenue (USD Million) by Segments (2021-2032)
11.1.1. Asia Pacific GABA Revenue (USD Million) by Type (2021-2032)
11.1.2. Asia Pacific GABA Revenue (USD Million) by Application (2021-2032)
11.1.3. Asia Pacific GABA Revenue (USD Million) by Product (2021-2032)
By Type
Microbial Fermentation (Feed Grade)
Microbial Fermentation (Food Grade)
Chemical Synthesis
By Application
Animal Feed
Food
Medicine
Plant Growth Promoter
Cosmetic
Others
Chapter 12. South America GABA Analysis and Outlook
12.1. South America GABA Revenue (USD Million), by Segments (2021-2032)
12.1.1. South America GABA Revenue (USD Million) by Type (2021-2032)
12.1.2. South America GABA Revenue (USD Million) by Application (2021-2032)
12.1.3. South America GABA Revenue (USD Million) by Product (2021-2032)
By Type
Microbial Fermentation (Feed Grade)
Microbial Fermentation (Food Grade)
Chemical Synthesis
By Application
Animal Feed
Food
Medicine
Plant Growth Promoter
Cosmetic
Others
Chapter 13. Middle East and Africa GABA Analysis and Outlook
13.1. Middle East and Africa GABA Revenue (USD Million), by Segments (2021-2032)
13.1.1. Middle East and Africa GABA Revenue (USD Million) by Type (2021-2032)
13.1.2. Middle East and Africa GABA Revenue (USD Million) by Application (2021-2032)
13.1.3. Middle East and Africa GABA Revenue (USD Million) by Product (2021-2032)
By Type
Microbial Fermentation (Feed Grade)
Microbial Fermentation (Food Grade)
Chemical Synthesis
By Application
Animal Feed
Food
Medicine
Plant Growth Promoter
Cosmetic
Others
Chapter 14. GABA Company Profiles
14.1 Business Overview
14.2 Product Profiles
14.3 SWOT Profiles
14.5 Recent Developments
14.6 Financial Profile
List of Companies
Bloomage Biotech
Bornsun Biology
Harworld
Huarui Biology
Jyswkj
Kyowa Hakko
Luckerkong
Microbiofeed
Pharma Foods International
Qandr Biology
Sekisui Chemical
Shanghai Richen
Sino Biotek
Viab Life
Xinyou Chemistry
Zhejiang Yiwan Bio
Zjtr Chemistry
15. Methodology and Data Sources
15.1 Customization Offerings
15.2 Subscription Services
15.3 Related Reports
15.4 Publisher Expertise
LIST OF TABLES
Table 1 Market Segmentation Analysis
Table 2 Global GABA Market Share of Leading Companies, 2023
Table 3 Product Offerings of Leading Companies
Table 4 Low Growth Scenario Forecasts
Table 5 Reference Case Growth Scenario
Table 6 High Growth Case Scenario
Table 7 Global GABA Revenue (USD Million) And CAGR (%) By Type (2021-2032)
Table 8 Global GABA Revenue (USD Million) And CAGR (%) By Application (2021-2032)
Table 9 Global GABA Revenue (USD Million) And CAGR (%) By Product (2021-2032)
Table 10 Global GABA Market Revenue (USD Million) By Regions (2021-2032)
Table 11 Global GABA Market Share (%) By Regions (2021-2032)
Table 12 North America GABA Revenue (USD Million) By Country (2021-2032)
Table 13 Europe GABA Revenue (USD Million) By Country (2021-2032)
Table 14 Asia Pacific GABA Revenue (USD Million) By Country (2021-2032)
Table 15 South America GABA Revenue (USD Million) By Country (2021-2032)
Table 16 Middle East and Africa GABA Revenue (USD Million) By Region (2021-2032)
Table 17 North America GABA Revenue (USD Million) By Type (2021-2032)
Table 18 North America GABA Revenue (USD Million) By Application (2021-2032)
Table 19 North America GABA Revenue (USD Million) By Product (2021-2032)
Table 20 Europe GABA Revenue (USD Million) By Type (2021-2032)
Table 21 Europe GABA Revenue (USD Million) By Application (2021-2032)
Table 22 Europe GABA Revenue (USD Million) By Product (2021-2032)
Table 23 Asia Pacific GABA Revenue (USD Million) By Type (2021-2032)
Table 24 Asia Pacific GABA Revenue (USD Million) By Application (2021-2032)
Table 25 Asia Pacific GABA Revenue (USD Million) By Product (2021-2032)
Table 26 South America GABA Revenue (USD Million) By Type (2021-2032)
Table 27 South America GABA Revenue (USD Million) By Application (2021-2032)
Table 28 South America GABA Revenue (USD Million) By Product (2021-2032)
Table 29 Middle East and Africa GABA Revenue (USD Million) By Type (2021-2032)
Table 30 Middle East and Africa GABA Revenue (USD Million) By Application (2021-2032)
Table 31 Middle East and Africa GABA Revenue (USD Million) By Product (2021-2032)
LIST OF FIGURES
Figure 1. Market Scope
Figure 2. Pricing Forecasts Per Unit, 2023- 2032
Figure 3. Porter’s Five Forces
Figure 4. Global GABA Market Revenue (USD Million) By Regions (2021-2032)
Figure 5. Global GABA Market Share (%) By Regions (2023)
Figure 6. North America GABA Revenue (USD Million) By Country (2021-2032)
Figure 7. United States GABA Revenue (USD Million) By Country (2021-2032)
Figure 8. Canada GABA Revenue (USD Million) By Country (2021-2032)
Figure 9. Mexico GABA Revenue (USD Million) By Country (2021-2032)
Figure 10. Europe GABA Revenue (USD Million) By Country (2021-2032)
Figure 11. Germany GABA Revenue (USD Million) By Country (2021-2032)
Figure 12. France GABA Revenue (USD Million) By Country (2021-2032)
Figure 13. United Kingdom GABA Revenue (USD Million) By Country (2021-2032)
Figure 14. Spain GABA Revenue (USD Million) By Country (2021-2032)
Figure 15. Italy GABA Revenue (USD Million) By Country (2021-2032)
Figure 16. Russia GABA Revenue (USD Million) By Country (2021-2032)
Figure 17. Rest of Europe GABA Revenue (USD Million) By Country (2021-2032)
Figure 11. Asia Pacific GABA Revenue (USD Million) By Country (2021-2032)
Figure 12. China GABA Revenue (USD Million) By Country (2021-2032)
Figure 13. Japan GABA Revenue (USD Million) By Country (2021-2032)
Figure 14. India GABA Revenue (USD Million) By Country (2021-2032)
Figure 15. South Korea GABA Revenue (USD Million) By Country (2021-2032)
Figure 16. Australia GABA Revenue (USD Million) By Country (2021-2032)
Figure 17. South East Asia GABA Revenue (USD Million) By Country (2021-2032)
Figure 18. South America GABA Revenue (USD Million) By Country (2021-2032)
Figure 19. Brazil GABA Revenue (USD Million) By Country (2021-2032)
Figure 20. Argentina GABA Revenue (USD Million) By Country (2021-2032)
Figure 21. Rest of Asia Pacific GABA Revenue (USD Million) By Country (2021-2032)
Figure 22. Middle East and Africa GABA Revenue (USD Million) By Region (2021-2032)
Figure 23. Saudi Arabia GABA Revenue (USD Million) By Region (2021-2032)
Figure 24. The UAE GABA Revenue (USD Million) By Region (2021-2032)
Figure 25. Rest of Middle East GABA Revenue (USD Million) By Region (2021-2032)
Figure 26. South Africa GABA Revenue (USD Million) By Region (2021-2032)
Figure 27. Africa GABA Revenue (USD Million) By Region (2021-2032)
Figure 28. North America GABA Revenue (USD Million) By Type (2021-2032)
Figure 29. North America GABA Revenue (USD Million) By Application (2021-2032)
Figure 30. North America GABA Revenue (USD Million) By Product (2021-2032)
Figure 31. Europe GABA Revenue (USD Million) By Type (2021-2032)
Figure 32. Europe GABA Revenue (USD Million) By Application (2021-2032)
Figure 33. Europe GABA Revenue (USD Million) By Product (2021-2032)
Figure 34. Asia Pacific GABA Revenue (USD Million) By Type (2021-2032)
Figure 35. Asia Pacific GABA Revenue (USD Million) By Application (2021-2032)
Figure 36. Asia Pacific GABA Revenue (USD Million) By Product (2021-2032)
Figure 37. South America GABA Revenue (USD Million) By Type (2021-2032)
Figure 38. South America GABA Revenue (USD Million) By Application (2021-2032)
Figure 39. South America GABA Revenue (USD Million) By Product (2021-2032)
Figure 40. Middle East and Africa GABA Revenue (USD Million) By Type (2021-2032)
Figure 41. Middle East and Africa GABA Revenue (USD Million) By Application (2021-2032)
Figure 42. Middle East and Africa GABA Revenue (USD Million) By Product (2021-2032)
By Type
Microbial Fermentation (Feed Grade)
Microbial Fermentation (Food Grade)
Chemical Synthesis
By Application
Animal Feed
Food
Medicine
Plant Growth Promoter
Cosmetic
Others
Countries Analyzed
North America (US, Canada, Mexico)
Europe (Germany, UK, France, Spain, Italy, Russia, Rest of Europe)
Asia Pacific (China, India, Japan, South Korea, Australia, South East Asia, Rest of Asia)
South America (Brazil, Argentina, Rest of South America)
Middle East and Africa (Saudi Arabia, UAE, Rest of Middle East, South Africa, Egypt, Rest of Africa)
