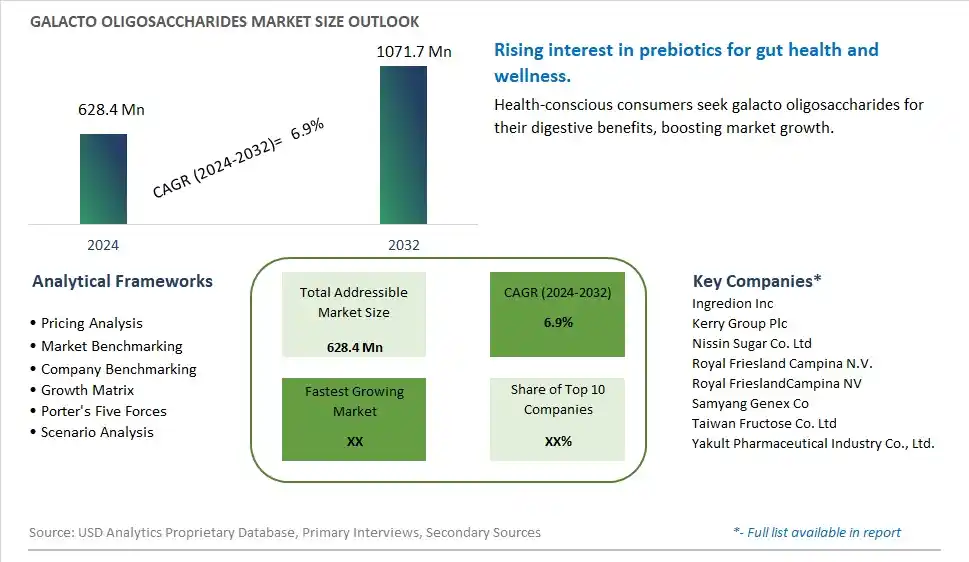
Global Galacto Oligosaccharides Market Size is valued at $628.4 Million in 2024 and is forecast to register a growth rate (CAGR) of 6.9% to reach $1071.7 Million by 2032.
The global Galacto Oligosaccharides Market Comprehensive Study analyzes and forecasts the market size across 6 regions and 24 countries for diverse segments -By Product (Liquid, Powder), By Primary Function (Prebiotics, Sweeteners), By End-User (Dietary Supplements, Bakery, Dairy Products, Animal Feed, Pharmaceuticals, Personal Care, Others)
An Introduction to Galacto Oligosaccharides Market
The galacto oligosaccharides (GOS) market in 2024 is expanding rapidly, driven by the demand for prebiotic fibers that support digestive health. GOS, derived from lactose, promotes the growth of beneficial gut bacteria and is used in infant formula, dairy products, and functional foods. The market benefits from advancements in extraction and synthesis technologies that enhance the purity and efficacy of GOS. The trend towards clean label and natural ingredients is influencing product development. Increasing consumer awareness of gut health and the popularity of prebiotic-enriched products are further propelling market growth.
Galacto Oligosaccharides Competitive Landscape
The market report analyses the leading companies in the industry including Ingredion Inc, Kerry Group Plc, Nissin Sugar Co. Ltd, Royal Friesland Campina N.V., Royal FrieslandCampina NV, Samyang Genex Co, Taiwan Fructose Co. Ltd, Yakult Pharmaceutical Industry Co., Ltd., and Others.
Galacto Oligosaccharides Market Dynamics
Galacto Oligosaccharides Market Trend: Increasing Use in Infant Formula and Functional Foods
The most prominent trend in the Galacto Oligosaccharides (GOS) Market is the increasing use in infant formula and functional foods. GOS is recognized for its prebiotic properties, promoting gut health by stimulating the growth of beneficial bacteria. This trend is driven by the demand for ingredients that support digestive health and enhance the nutritional profile of food products.
Galacto Oligosaccharides Market Driver: Health Consciousness and Demand for Prebiotic Ingredients
A key driver in the Galacto Oligosaccharides Market is health consciousness and the demand for prebiotic ingredients. As more individuals focus on maintaining a healthy gut microbiome, there is a rising demand for GOS in various food and supplement products. This demand supports market growth as consumers seek natural and effective prebiotic solutions to support their digestive health.
Galacto Oligosaccharides Market Opportunity: Expansion into Functional Beverages and Supplements
One significant opportunity in the Galacto Oligosaccharides Market lies in expansion into functional beverages and supplements. Companies can innovate by incorporating GOS into a variety of products, such as probiotic drinks, health bars, and dietary supplements, offering consumers convenient ways to enhance their gut health. By highlighting the benefits and versatility of GOS, manufacturers can attract a broader consumer base and drive market growth.
Galacto Oligosaccharides Market Share Analysis- Largest Segment by Product
In the Galacto Oligosaccharides Market, the Powder form is the largest segment by product. Powdered galacto oligosaccharides are preferred for their versatility and ease of use in various applications, including dietary supplements, functional foods, and beverages. The powder form offers advantages in terms of stability, shelf-life, and ease of incorporation into dry mixes or formulations. Its broad applicability and convenience in handling and storage make powdered galacto oligosaccharides the dominant product type in the market.
Galacto Oligosaccharides Market Share Analysis- Poised to Grow Fastest Over the Next Five Years by Primary Function
The Prebiotics function segment in the Galacto Oligosaccharides Market is poised to grow the fastest over the next five years. Galacto oligosaccharides are known for their prebiotic properties, which promote the growth of beneficial gut bacteria and support digestive health. As consumer awareness of gut health and its impact on overall well-being increases, the demand for prebiotic ingredients is expected to rise. The growing trend towards functional foods and dietary supplements that support digestive health and immunity is driving this growth, making prebiotics the fastest-growing function segment in the market.
Galacto Oligosaccharides Market Share Analysis- Largest Segment by End-User
In the Galacto Oligosaccharides Market, the Dietary Supplements end-user segment is the largest. The significant use of galacto oligosaccharides in dietary supplements is driven by their prebiotic benefits, which support gut health and overall wellness. The increasing consumer focus on health and wellness, coupled with the growing popularity of personalized nutrition, fuels the demand for dietary supplements containing galacto oligosaccharides. Their role in enhancing digestive health and boosting immunity positions dietary supplements as the leading end-user segment in the galacto oligosaccharides market.
Galacto Oligosaccharides Market Segmentation
By Product
Liquid
Powder
By Primary Function
Prebiotics
Sweeteners
By End-User
Dietary Supplements
Bakery
Dairy Products
Animal Feed
Pharmaceuticals
Personal Care
Others
Countries Analyzed
North America (US, Canada, Mexico)
Europe (Germany, UK, France, Spain, Italy, Russia, Rest of Europe)
Asia Pacific (China, India, Japan, South Korea, Australia, South East Asia, Rest of Asia)
South America (Brazil, Argentina, Rest of South America)
Middle East and Africa (Saudi Arabia, UAE, Rest of Middle East, South Africa, Egypt, Rest of Africa)
Galacto Oligosaccharides Companies Profiled in the Study
Ingredion Inc
Kerry Group Plc
Nissin Sugar Co. Ltd
Royal Friesland Campina N.V.
Royal FrieslandCampina NV
Samyang Genex Co
Taiwan Fructose Co. Ltd
Yakult Pharmaceutical Industry Co., Ltd.
*- List Not Exhaustive
Chapter 1. TABLE OF CONTENTS
Chapter 2. Introduction to Galacto Oligosaccharides Market
2.1. Market Overview
2.2. Key Statistics and Report Highlights
2.3. Scope of the Comprehensive Study
2.3.1. Market Definition
2.3.2 Countries and Regions Covered
2.3.3 Research Objective
2.3.4 Units, Currency, and Conversions
2.3.5 Industry Value Chain
2.4. Key Market Segments
2.5. Key Companies
2.6. Study Period
Chapter 3. Strategic Analysis Review
3.1. Galacto Oligosaccharides Pricing Analysis and Forecast
3.2. Porter’s Five Forces
3.3. Market Ecosystem
3.4. SWOT Analysis
3.5. Regulatory Scenario
3.3. Effects of Inflation, Russia-Ukraine War, moderating economic growth, and other macroeconomic factors
Chapter 4. Competitive Landscape
4.1. Market Share Analysis
4.1.1. Global Galacto Oligosaccharides Market Share by Company, 2023
4.1.2. Product Offerings of Leading Galacto Oligosaccharides Companies
4.2. Market Entropy
4.2.1. New Product Launches in the Industry
4.2.2. Mergers, Acquisitions, Joint ventures, and Partnerships
4.3. Key Strategies and Best Practices
Chapter 5. Global Market Projections: Best, Reference, and Low Case Scenarios
5.1. Growth Analysis- Case Scenario Definitions
5.2. Low Growth Case Scenario Forecasts
5.3. Reference Growth Case Scenario Forecasts
5.4. High Growth Case Scenario Forecasts
Chapter 6. Market Dynamics
6.1. Galacto Oligosaccharides Market Drivers
6.2. Galacto Oligosaccharides Market Challenges
6.6. Galacto Oligosaccharides Market Opportunities
6.4. Galacto Oligosaccharides Market Trends
Chapter 7. Global Galacto Oligosaccharides Market Outlook Trends
7.1. Global Galacto Oligosaccharides Revenue (USD Million) and CAGR (%) by Type (2021-2032)
7.2. Global Galacto Oligosaccharides Revenue (USD Million) and CAGR (%) by Application (2021-2032)
7.3. Global Galacto Oligosaccharides Revenue (USD Million) and CAGR (%) by Product (2021-2032)
By Product
Liquid
Powder
By Primary Function
Prebiotics
Sweeteners
By End-User
Dietary Supplements
Bakery
Dairy Products
Animal Feed
Pharmaceuticals
Personal Care
Others
Chapter 8. Global Galacto Oligosaccharides Regional Analysis and Outlook
8.1. Global Galacto Oligosaccharides Revenue (USD Million) By Regions (2021- 2032)
8.2. North America Galacto Oligosaccharides Revenue (USD Million) by Country (2021-2032)
8.2.1. United States Galacto Oligosaccharides Regional Analysis and Outlook
8.2.2. Canada Galacto Oligosaccharides Regional Analysis and Outlook
8.2.3. Mexico Galacto Oligosaccharides Regional Analysis and Outlook
8.3. Europe Galacto Oligosaccharides Revenue (USD Million), by Country (2021-2032)
8.3.1. Germany Galacto Oligosaccharides Regional Analysis and Outlook
8.3.2. France Galacto Oligosaccharides Regional Analysis and Outlook
8.3.3. United Kingdom Galacto Oligosaccharides Regional Analysis and Outlook
8.3.4. Spain Galacto Oligosaccharides Regional Analysis and Outlook
8.3.5. Italy Galacto Oligosaccharides Regional Analysis and Outlook
8.3.6. Russia Galacto Oligosaccharides Regional Analysis and Outlook
8.3.7. Rest of Europe Galacto Oligosaccharides Regional Analysis and Outlook
8.4. Asia Pacific Galacto Oligosaccharides Revenue (USD Million) by Country (2021-2032)
8.4.1. China Galacto Oligosaccharides Regional Analysis and Outlook
8.4.2. Japan Galacto Oligosaccharides Regional Analysis and Outlook
8.4.3. India Galacto Oligosaccharides Regional Analysis and Outlook
8.4.4. South Korea Galacto Oligosaccharides Regional Analysis and Outlook
8.4.5. Australia Galacto Oligosaccharides Regional Analysis and Outlook
8.4.6. South East Asia Galacto Oligosaccharides Regional Analysis and Outlook
8.4.7. Rest of Asia Pacific Galacto Oligosaccharides Regional Analysis and Outlook
8.5. South America Galacto Oligosaccharides Revenue (USD Million), by Country (2021-2032)
8.5.1. Brazil Galacto Oligosaccharides Regional Analysis and Outlook
8.5.2. Argentina Galacto Oligosaccharides Regional Analysis and Outlook
8.5.3. Rest of South America Galacto Oligosaccharides Regional Analysis and Outlook
8.6. Middle East and Africa Galacto Oligosaccharides Revenue (USD Million) by Country (2021-2032)
8.6.1. Middle East Galacto Oligosaccharides Regional Analysis and Outlook
8.6.2. Africa Galacto Oligosaccharides Regional Analysis and Outlook
Chapter 9. North America Galacto Oligosaccharides Analysis and Outlook
9.1. North America Galacto Oligosaccharides Revenue (USD Million) by Segments (2021-2032)
9.1.1. North America Galacto Oligosaccharides Revenue (USD Million) by Type (2021-2032)
9.1.2. North America Galacto Oligosaccharides Revenue (USD Million) by Application (2021-2032)
9.1.3. North America Galacto Oligosaccharides Revenue (USD Million) by Product (2021-2032)
By Product
Liquid
Powder
By Primary Function
Prebiotics
Sweeteners
By End-User
Dietary Supplements
Bakery
Dairy Products
Animal Feed
Pharmaceuticals
Personal Care
Others
Chapter 10. Europe Galacto Oligosaccharides Analysis and Outlook
10.1. Europe Galacto Oligosaccharides Revenue (USD Million), by Segments (USD Million) (2021-2032)
10.1.1. Europe Galacto Oligosaccharides Revenue (USD Million) by Type (2021-2032)
10.1.2. Europe Galacto Oligosaccharides Revenue (USD Million) by Application (2021-2032)
10.1.3. Europe Galacto Oligosaccharides Revenue (USD Million) by Product (2021-2032)
By Product
Liquid
Powder
By Primary Function
Prebiotics
Sweeteners
By End-User
Dietary Supplements
Bakery
Dairy Products
Animal Feed
Pharmaceuticals
Personal Care
Others
Chapter 11. Asia Pacific Galacto Oligosaccharides Analysis and Outlook
11.1. Asia Pacific Galacto Oligosaccharides Revenue (USD Million), and Revenue (USD Million) by Segments (2021-2032)
11.1.1. Asia Pacific Galacto Oligosaccharides Revenue (USD Million) by Type (2021-2032)
11.1.2. Asia Pacific Galacto Oligosaccharides Revenue (USD Million) by Application (2021-2032)
11.1.3. Asia Pacific Galacto Oligosaccharides Revenue (USD Million) by Product (2021-2032)
By Product
Liquid
Powder
By Primary Function
Prebiotics
Sweeteners
By End-User
Dietary Supplements
Bakery
Dairy Products
Animal Feed
Pharmaceuticals
Personal Care
Others
Chapter 12. South America Galacto Oligosaccharides Analysis and Outlook
12.1. South America Galacto Oligosaccharides Revenue (USD Million), by Segments (2021-2032)
12.1.1. South America Galacto Oligosaccharides Revenue (USD Million) by Type (2021-2032)
12.1.2. South America Galacto Oligosaccharides Revenue (USD Million) by Application (2021-2032)
12.1.3. South America Galacto Oligosaccharides Revenue (USD Million) by Product (2021-2032)
By Product
Liquid
Powder
By Primary Function
Prebiotics
Sweeteners
By End-User
Dietary Supplements
Bakery
Dairy Products
Animal Feed
Pharmaceuticals
Personal Care
Others
Chapter 13. Middle East and Africa Galacto Oligosaccharides Analysis and Outlook
13.1. Middle East and Africa Galacto Oligosaccharides Revenue (USD Million), by Segments (2021-2032)
13.1.1. Middle East and Africa Galacto Oligosaccharides Revenue (USD Million) by Type (2021-2032)
13.1.2. Middle East and Africa Galacto Oligosaccharides Revenue (USD Million) by Application (2021-2032)
13.1.3. Middle East and Africa Galacto Oligosaccharides Revenue (USD Million) by Product (2021-2032)
By Product
Liquid
Powder
By Primary Function
Prebiotics
Sweeteners
By End-User
Dietary Supplements
Bakery
Dairy Products
Animal Feed
Pharmaceuticals
Personal Care
Others
Chapter 14. Galacto Oligosaccharides Company Profiles
14.1 Business Overview
14.2 Product Profiles
14.3 SWOT Profiles
14.5 Recent Developments
14.6 Financial Profile
List of Companies
Ingredion Inc
Kerry Group Plc
Nissin Sugar Co. Ltd
Royal Friesland Campina N.V.
Royal FrieslandCampina NV
Samyang Genex Co
Taiwan Fructose Co. Ltd
Yakult Pharmaceutical Industry Co., Ltd.
15. Methodology and Data Sources
15.1 Customization Offerings
15.2 Subscription Services
15.3 Related Reports
15.4 Publisher Expertise
LIST OF TABLES
Table 1 Market Segmentation Analysis
Table 2 Global Galacto Oligosaccharides Market Share of Leading Companies, 2023
Table 3 Product Offerings of Leading Companies
Table 4 Low Growth Scenario Forecasts
Table 5 Reference Case Growth Scenario
Table 6 High Growth Case Scenario
Table 7 Global Galacto Oligosaccharides Revenue (USD Million) And CAGR (%) By Type (2021-2032)
Table 8 Global Galacto Oligosaccharides Revenue (USD Million) And CAGR (%) By Application (2021-2032)
Table 9 Global Galacto Oligosaccharides Revenue (USD Million) And CAGR (%) By Product (2021-2032)
Table 10 Global Galacto Oligosaccharides Market Revenue (USD Million) By Regions (2021-2032)
Table 11 Global Galacto Oligosaccharides Market Share (%) By Regions (2021-2032)
Table 12 North America Galacto Oligosaccharides Revenue (USD Million) By Country (2021-2032)
Table 13 Europe Galacto Oligosaccharides Revenue (USD Million) By Country (2021-2032)
Table 14 Asia Pacific Galacto Oligosaccharides Revenue (USD Million) By Country (2021-2032)
Table 15 South America Galacto Oligosaccharides Revenue (USD Million) By Country (2021-2032)
Table 16 Middle East and Africa Galacto Oligosaccharides Revenue (USD Million) By Region (2021-2032)
Table 17 North America Galacto Oligosaccharides Revenue (USD Million) By Type (2021-2032)
Table 18 North America Galacto Oligosaccharides Revenue (USD Million) By Application (2021-2032)
Table 19 North America Galacto Oligosaccharides Revenue (USD Million) By Product (2021-2032)
Table 20 Europe Galacto Oligosaccharides Revenue (USD Million) By Type (2021-2032)
Table 21 Europe Galacto Oligosaccharides Revenue (USD Million) By Application (2021-2032)
Table 22 Europe Galacto Oligosaccharides Revenue (USD Million) By Product (2021-2032)
Table 23 Asia Pacific Galacto Oligosaccharides Revenue (USD Million) By Type (2021-2032)
Table 24 Asia Pacific Galacto Oligosaccharides Revenue (USD Million) By Application (2021-2032)
Table 25 Asia Pacific Galacto Oligosaccharides Revenue (USD Million) By Product (2021-2032)
Table 26 South America Galacto Oligosaccharides Revenue (USD Million) By Type (2021-2032)
Table 27 South America Galacto Oligosaccharides Revenue (USD Million) By Application (2021-2032)
Table 28 South America Galacto Oligosaccharides Revenue (USD Million) By Product (2021-2032)
Table 29 Middle East and Africa Galacto Oligosaccharides Revenue (USD Million) By Type (2021-2032)
Table 30 Middle East and Africa Galacto Oligosaccharides Revenue (USD Million) By Application (2021-2032)
Table 31 Middle East and Africa Galacto Oligosaccharides Revenue (USD Million) By Product (2021-2032)
LIST OF FIGURES
Figure 1. Market Scope
Figure 2. Pricing Forecasts Per Unit, 2023- 2032
Figure 3. Porter’s Five Forces
Figure 4. Global Galacto Oligosaccharides Market Revenue (USD Million) By Regions (2021-2032)
Figure 5. Global Galacto Oligosaccharides Market Share (%) By Regions (2023)
Figure 6. North America Galacto Oligosaccharides Revenue (USD Million) By Country (2021-2032)
Figure 7. United States Galacto Oligosaccharides Revenue (USD Million) By Country (2021-2032)
Figure 8. Canada Galacto Oligosaccharides Revenue (USD Million) By Country (2021-2032)
Figure 9. Mexico Galacto Oligosaccharides Revenue (USD Million) By Country (2021-2032)
Figure 10. Europe Galacto Oligosaccharides Revenue (USD Million) By Country (2021-2032)
Figure 11. Germany Galacto Oligosaccharides Revenue (USD Million) By Country (2021-2032)
Figure 12. France Galacto Oligosaccharides Revenue (USD Million) By Country (2021-2032)
Figure 13. United Kingdom Galacto Oligosaccharides Revenue (USD Million) By Country (2021-2032)
Figure 14. Spain Galacto Oligosaccharides Revenue (USD Million) By Country (2021-2032)
Figure 15. Italy Galacto Oligosaccharides Revenue (USD Million) By Country (2021-2032)
Figure 16. Russia Galacto Oligosaccharides Revenue (USD Million) By Country (2021-2032)
Figure 17. Rest of Europe Galacto Oligosaccharides Revenue (USD Million) By Country (2021-2032)
Figure 11. Asia Pacific Galacto Oligosaccharides Revenue (USD Million) By Country (2021-2032)
Figure 12. China Galacto Oligosaccharides Revenue (USD Million) By Country (2021-2032)
Figure 13. Japan Galacto Oligosaccharides Revenue (USD Million) By Country (2021-2032)
Figure 14. India Galacto Oligosaccharides Revenue (USD Million) By Country (2021-2032)
Figure 15. South Korea Galacto Oligosaccharides Revenue (USD Million) By Country (2021-2032)
Figure 16. Australia Galacto Oligosaccharides Revenue (USD Million) By Country (2021-2032)
Figure 17. South East Asia Galacto Oligosaccharides Revenue (USD Million) By Country (2021-2032)
Figure 18. South America Galacto Oligosaccharides Revenue (USD Million) By Country (2021-2032)
Figure 19. Brazil Galacto Oligosaccharides Revenue (USD Million) By Country (2021-2032)
Figure 20. Argentina Galacto Oligosaccharides Revenue (USD Million) By Country (2021-2032)
Figure 21. Rest of Asia Pacific Galacto Oligosaccharides Revenue (USD Million) By Country (2021-2032)
Figure 22. Middle East and Africa Galacto Oligosaccharides Revenue (USD Million) By Region (2021-2032)
Figure 23. Saudi Arabia Galacto Oligosaccharides Revenue (USD Million) By Region (2021-2032)
Figure 24. The UAE Galacto Oligosaccharides Revenue (USD Million) By Region (2021-2032)
Figure 25. Rest of Middle East Galacto Oligosaccharides Revenue (USD Million) By Region (2021-2032)
Figure 26. South Africa Galacto Oligosaccharides Revenue (USD Million) By Region (2021-2032)
Figure 27. Africa Galacto Oligosaccharides Revenue (USD Million) By Region (2021-2032)
Figure 28. North America Galacto Oligosaccharides Revenue (USD Million) By Type (2021-2032)
Figure 29. North America Galacto Oligosaccharides Revenue (USD Million) By Application (2021-2032)
Figure 30. North America Galacto Oligosaccharides Revenue (USD Million) By Product (2021-2032)
Figure 31. Europe Galacto Oligosaccharides Revenue (USD Million) By Type (2021-2032)
Figure 32. Europe Galacto Oligosaccharides Revenue (USD Million) By Application (2021-2032)
Figure 33. Europe Galacto Oligosaccharides Revenue (USD Million) By Product (2021-2032)
Figure 34. Asia Pacific Galacto Oligosaccharides Revenue (USD Million) By Type (2021-2032)
Figure 35. Asia Pacific Galacto Oligosaccharides Revenue (USD Million) By Application (2021-2032)
Figure 36. Asia Pacific Galacto Oligosaccharides Revenue (USD Million) By Product (2021-2032)
Figure 37. South America Galacto Oligosaccharides Revenue (USD Million) By Type (2021-2032)
Figure 38. South America Galacto Oligosaccharides Revenue (USD Million) By Application (2021-2032)
Figure 39. South America Galacto Oligosaccharides Revenue (USD Million) By Product (2021-2032)
Figure 40. Middle East and Africa Galacto Oligosaccharides Revenue (USD Million) By Type (2021-2032)
Figure 41. Middle East and Africa Galacto Oligosaccharides Revenue (USD Million) By Application (2021-2032)
Figure 42. Middle East and Africa Galacto Oligosaccharides Revenue (USD Million) By Product (2021-2032)
By Product
Liquid
Powder
By Primary Function
Prebiotics
Sweeteners
By End-User
Dietary Supplements
Bakery
Dairy Products
Animal Feed
Pharmaceuticals
Personal Care
Others
Countries Analyzed
North America (US, Canada, Mexico)
Europe (Germany, UK, France, Spain, Italy, Russia, Rest of Europe)
Asia Pacific (China, India, Japan, South Korea, Australia, South East Asia, Rest of Asia)
South America (Brazil, Argentina, Rest of South America)
Middle East and Africa (Saudi Arabia, UAE, Rest of Middle East, South Africa, Egypt, Rest of Africa)
