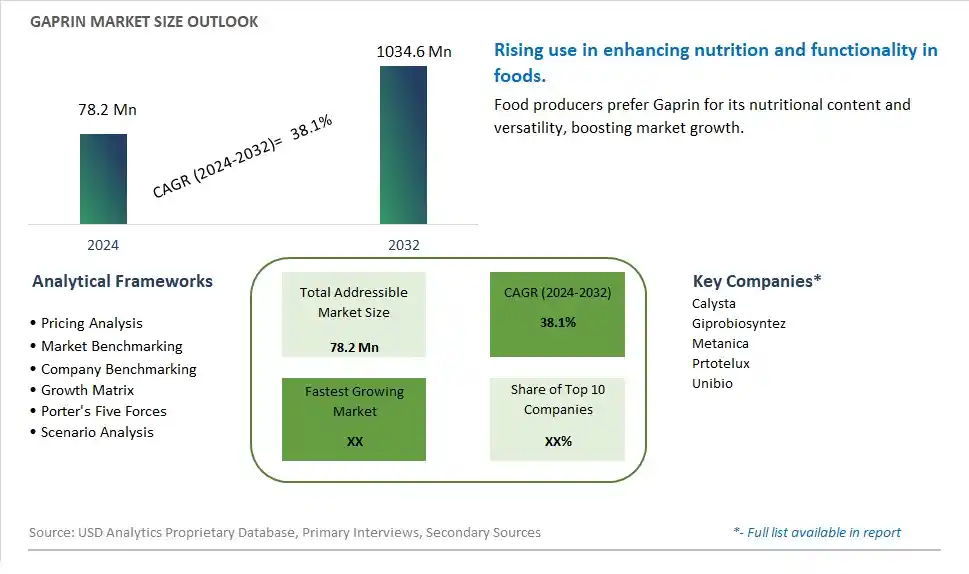
Global Gaprin Market Size is valued at $78.2 Million in 2024 and is forecast to register a growth rate (CAGR) of 38.1% to reach $1034.6 Million by 2032.
The global Gaprin Market Comprehensive Study analyzes and forecasts the market size across 6 regions and 24 countries for diverse segments -By Type (Food Grade, Feed Grade), By Application (Food & Beverages, Animal Feed, Others)
An Introduction to Gaprin Market
The Gaprin market in 2024 is experiencing significant growth, driven by the rising demand for high-quality protein ingredients in food and dietary supplements. Gaprin, a microbial protein, is known for its high nutritional value and sustainability. The market benefits from advancements in microbial fermentation and protein extraction technologies, the growing trend of sustainable and alternative protein sources, and the expansion of the functional food and nutraceutical sectors. Additionally, the increasing focus on reducing environmental impact and promoting sustainable food production is driving market growth.
Gaprin Competitive Landscape
The market report analyses the leading companies in the industry including Calysta, Giprobiosyntez, Metanica, Prtotelux, Unibio, and Others.
Gaprin Market Dynamics
Gaprin Market Trend: Increasing Demand for Sustainable Protein Sources
The most prominent trend in the Gaprin Market is the increasing demand for sustainable protein sources. As consumers become more aware of the environmental impact of traditional animal-based proteins, there is a growing interest in alternative protein sources that are environmentally friendly and nutritionally comparable. Gaprin, a protein derived from biomass, is gaining popularity as a sustainable and scalable protein option.
Gaprin Market Driver: Growth in Plant-Based and Alternative Proteins
The key driver of the Gaprin Market is the growth in plant-based and alternative proteins. As more consumers adopt vegetarian, vegan, and flexitarian diets, there is a higher demand for diverse and innovative protein sources that can replace or supplement traditional proteins. Gaprin, with its high protein content and versatility, is increasingly used in the formulation of plant-based meats, protein powders, and functional foods, driving market growth.
Gaprin Market Opportunity: Innovation in Food and Beverage Applications
A significant opportunity in the Gaprin Market lies in innovation in food and beverage applications. By developing new products that incorporate Gaprin as a key ingredient, companies can cater to the evolving preferences of health-conscious and environmentally aware consumers. Offering innovative Gaprin-based products, such as meat alternatives, protein-enriched snacks, and functional beverages, can help expand market reach and drive growth in the alternative protein sector.
Gaprin Market Share Analysis: Food & Beverages Application is the fastest growing segment over the forecast period to 2032
The Food & Beverages application segment is projected to be the fastest-growing in the Gaprin market through 2032. This growth is driven by increasing consumer demand for functional ingredients that offer health benefits in food and beverage products. Gaprin, known for its beneficial properties such as improving gut health and enhancing immune function, is gaining popularity as a functional ingredient in various food and beverage formulations. Manufacturers are increasingly incorporating Gaprin into products like dairy beverages, health drinks, and nutritional bars to appeal to health-conscious consumers seeking products that support digestive wellness and overall well-being. The trend towards natural and functional foods is also contributing to the surge in Gaprin's adoption in the food and beverage industry. As research continues to highlight the health benefits of Gaprin and consumer awareness grows, its use in food and beverage applications is expected to expand rapidly, making it a pivotal growth segment in the market.
Gaprin Market Share Analysis: Food Grade segment generated the highest revenue share in the industry
The Food Grade segment represents the largest portion of the Gaprin market by type. This segment's dominance is driven by the extensive use of Gaprin in food products where purity and safety standards are paramount. Food-grade Gaprin is specifically processed and formulated to meet strict regulatory requirements for use in human consumption. It is utilized in various food applications, including baked goods, dairy products, nutritional supplements, and functional foods, due to its ability to enhance nutritional profiles and offer health benefits. The emphasis on quality and safety in food production further supports the preference for food-grade Gaprin among manufacturers and consumers alike. As the demand for natural and functional ingredients continues to grow in the food industry, the food-grade segment of the Gaprin market is expected to maintain its leading position, driven by its versatility and suitability for a wide range of food applications.
Gaprin Market Segmentation
By Type
Food Grade
Feed Grade
By Application
Food & Beverages
Animal Feed
Others
Countries Analyzed
North America (US, Canada, Mexico)
Europe (Germany, UK, France, Spain, Italy, Russia, Rest of Europe)
Asia Pacific (China, India, Japan, South Korea, Australia, South East Asia, Rest of Asia)
South America (Brazil, Argentina, Rest of South America)
Middle East and Africa (Saudi Arabia, UAE, Rest of Middle East, South Africa, Egypt, Rest of Africa)
Gaprin Companies Profiled in the Study
Calysta
Giprobiosyntez
Metanica
Prtotelux
Unibio
*- List Not Exhaustive
Chapter 1. TABLE OF CONTENTS
Chapter 2. Introduction to Gaprin Market
2.1. Market Overview
2.2. Key Statistics and Report Highlights
2.3. Scope of the Comprehensive Study
2.3.1. Market Definition
2.3.2 Countries and Regions Covered
2.3.3 Research Objective
2.3.4 Units, Currency, and Conversions
2.3.5 Industry Value Chain
2.4. Key Market Segments
2.5. Key Companies
2.6. Study Period
Chapter 3. Strategic Analysis Review
3.1. Gaprin Pricing Analysis and Forecast
3.2. Porter’s Five Forces
3.3. Market Ecosystem
3.4. SWOT Analysis
3.5. Regulatory Scenario
3.3. Effects of Inflation, Russia-Ukraine War, moderating economic growth, and other macroeconomic factors
Chapter 4. Competitive Landscape
4.1. Market Share Analysis
4.1.1. Global Gaprin Market Share by Company, 2023
4.1.2. Product Offerings of Leading Gaprin Companies
4.2. Market Entropy
4.2.1. New Product Launches in the Industry
4.2.2. Mergers, Acquisitions, Joint ventures, and Partnerships
4.3. Key Strategies and Best Practices
Chapter 5. Global Market Projections: Best, Reference, and Low Case Scenarios
5.1. Growth Analysis- Case Scenario Definitions
5.2. Low Growth Case Scenario Forecasts
5.3. Reference Growth Case Scenario Forecasts
5.4. High Growth Case Scenario Forecasts
Chapter 6. Market Dynamics
6.1. Gaprin Market Drivers
6.2. Gaprin Market Challenges
6.6. Gaprin Market Opportunities
6.4. Gaprin Market Trends
Chapter 7. Global Gaprin Market Outlook Trends
7.1. Global Gaprin Revenue (USD Million) and CAGR (%) by Type (2021-2032)
7.2. Global Gaprin Revenue (USD Million) and CAGR (%) by Application (2021-2032)
7.3. Global Gaprin Revenue (USD Million) and CAGR (%) by Product (2021-2032)
By Type
Food Grade
Feed Grade
By Application
Food & Beverages
Animal Feed
Others
Chapter 8. Global Gaprin Regional Analysis and Outlook
8.1. Global Gaprin Revenue (USD Million) By Regions (2021- 2032)
8.2. North America Gaprin Revenue (USD Million) by Country (2021-2032)
8.2.1. United States Gaprin Regional Analysis and Outlook
8.2.2. Canada Gaprin Regional Analysis and Outlook
8.2.3. Mexico Gaprin Regional Analysis and Outlook
8.3. Europe Gaprin Revenue (USD Million), by Country (2021-2032)
8.3.1. Germany Gaprin Regional Analysis and Outlook
8.3.2. France Gaprin Regional Analysis and Outlook
8.3.3. United Kingdom Gaprin Regional Analysis and Outlook
8.3.4. Spain Gaprin Regional Analysis and Outlook
8.3.5. Italy Gaprin Regional Analysis and Outlook
8.3.6. Russia Gaprin Regional Analysis and Outlook
8.3.7. Rest of Europe Gaprin Regional Analysis and Outlook
8.4. Asia Pacific Gaprin Revenue (USD Million) by Country (2021-2032)
8.4.1. China Gaprin Regional Analysis and Outlook
8.4.2. Japan Gaprin Regional Analysis and Outlook
8.4.3. India Gaprin Regional Analysis and Outlook
8.4.4. South Korea Gaprin Regional Analysis and Outlook
8.4.5. Australia Gaprin Regional Analysis and Outlook
8.4.6. South East Asia Gaprin Regional Analysis and Outlook
8.4.7. Rest of Asia Pacific Gaprin Regional Analysis and Outlook
8.5. South America Gaprin Revenue (USD Million), by Country (2021-2032)
8.5.1. Brazil Gaprin Regional Analysis and Outlook
8.5.2. Argentina Gaprin Regional Analysis and Outlook
8.5.3. Rest of South America Gaprin Regional Analysis and Outlook
8.6. Middle East and Africa Gaprin Revenue (USD Million) by Country (2021-2032)
8.6.1. Middle East Gaprin Regional Analysis and Outlook
8.6.2. Africa Gaprin Regional Analysis and Outlook
Chapter 9. North America Gaprin Analysis and Outlook
9.1. North America Gaprin Revenue (USD Million) by Segments (2021-2032)
9.1.1. North America Gaprin Revenue (USD Million) by Type (2021-2032)
9.1.2. North America Gaprin Revenue (USD Million) by Application (2021-2032)
9.1.3. North America Gaprin Revenue (USD Million) by Product (2021-2032)
By Type
Food Grade
Feed Grade
By Application
Food & Beverages
Animal Feed
Others
Chapter 10. Europe Gaprin Analysis and Outlook
10.1. Europe Gaprin Revenue (USD Million), by Segments (USD Million) (2021-2032)
10.1.1. Europe Gaprin Revenue (USD Million) by Type (2021-2032)
10.1.2. Europe Gaprin Revenue (USD Million) by Application (2021-2032)
10.1.3. Europe Gaprin Revenue (USD Million) by Product (2021-2032)
By Type
Food Grade
Feed Grade
By Application
Food & Beverages
Animal Feed
Others
Chapter 11. Asia Pacific Gaprin Analysis and Outlook
11.1. Asia Pacific Gaprin Revenue (USD Million), and Revenue (USD Million) by Segments (2021-2032)
11.1.1. Asia Pacific Gaprin Revenue (USD Million) by Type (2021-2032)
11.1.2. Asia Pacific Gaprin Revenue (USD Million) by Application (2021-2032)
11.1.3. Asia Pacific Gaprin Revenue (USD Million) by Product (2021-2032)
By Type
Food Grade
Feed Grade
By Application
Food & Beverages
Animal Feed
Others
Chapter 12. South America Gaprin Analysis and Outlook
12.1. South America Gaprin Revenue (USD Million), by Segments (2021-2032)
12.1.1. South America Gaprin Revenue (USD Million) by Type (2021-2032)
12.1.2. South America Gaprin Revenue (USD Million) by Application (2021-2032)
12.1.3. South America Gaprin Revenue (USD Million) by Product (2021-2032)
By Type
Food Grade
Feed Grade
By Application
Food & Beverages
Animal Feed
Others
Chapter 13. Middle East and Africa Gaprin Analysis and Outlook
13.1. Middle East and Africa Gaprin Revenue (USD Million), by Segments (2021-2032)
13.1.1. Middle East and Africa Gaprin Revenue (USD Million) by Type (2021-2032)
13.1.2. Middle East and Africa Gaprin Revenue (USD Million) by Application (2021-2032)
13.1.3. Middle East and Africa Gaprin Revenue (USD Million) by Product (2021-2032)
By Type
Food Grade
Feed Grade
By Application
Food & Beverages
Animal Feed
Others
Chapter 14. Gaprin Company Profiles
14.1 Business Overview
14.2 Product Profiles
14.3 SWOT Profiles
14.5 Recent Developments
14.6 Financial Profile
List of Companies
Calysta
Giprobiosyntez
Metanica
Prtotelux
Unibio
15. Methodology and Data Sources
15.1 Customization Offerings
15.2 Subscription Services
15.3 Related Reports
15.4 Publisher Expertise
LIST OF TABLES
Table 1 Market Segmentation Analysis
Table 2 Global Gaprin Market Share of Leading Companies, 2023
Table 3 Product Offerings of Leading Companies
Table 4 Low Growth Scenario Forecasts
Table 5 Reference Case Growth Scenario
Table 6 High Growth Case Scenario
Table 7 Global Gaprin Revenue (USD Million) And CAGR (%) By Type (2021-2032)
Table 8 Global Gaprin Revenue (USD Million) And CAGR (%) By Application (2021-2032)
Table 9 Global Gaprin Revenue (USD Million) And CAGR (%) By Product (2021-2032)
Table 10 Global Gaprin Market Revenue (USD Million) By Regions (2021-2032)
Table 11 Global Gaprin Market Share (%) By Regions (2021-2032)
Table 12 North America Gaprin Revenue (USD Million) By Country (2021-2032)
Table 13 Europe Gaprin Revenue (USD Million) By Country (2021-2032)
Table 14 Asia Pacific Gaprin Revenue (USD Million) By Country (2021-2032)
Table 15 South America Gaprin Revenue (USD Million) By Country (2021-2032)
Table 16 Middle East and Africa Gaprin Revenue (USD Million) By Region (2021-2032)
Table 17 North America Gaprin Revenue (USD Million) By Type (2021-2032)
Table 18 North America Gaprin Revenue (USD Million) By Application (2021-2032)
Table 19 North America Gaprin Revenue (USD Million) By Product (2021-2032)
Table 20 Europe Gaprin Revenue (USD Million) By Type (2021-2032)
Table 21 Europe Gaprin Revenue (USD Million) By Application (2021-2032)
Table 22 Europe Gaprin Revenue (USD Million) By Product (2021-2032)
Table 23 Asia Pacific Gaprin Revenue (USD Million) By Type (2021-2032)
Table 24 Asia Pacific Gaprin Revenue (USD Million) By Application (2021-2032)
Table 25 Asia Pacific Gaprin Revenue (USD Million) By Product (2021-2032)
Table 26 South America Gaprin Revenue (USD Million) By Type (2021-2032)
Table 27 South America Gaprin Revenue (USD Million) By Application (2021-2032)
Table 28 South America Gaprin Revenue (USD Million) By Product (2021-2032)
Table 29 Middle East and Africa Gaprin Revenue (USD Million) By Type (2021-2032)
Table 30 Middle East and Africa Gaprin Revenue (USD Million) By Application (2021-2032)
Table 31 Middle East and Africa Gaprin Revenue (USD Million) By Product (2021-2032)
LIST OF FIGURES
Figure 1. Market Scope
Figure 2. Pricing Forecasts Per Unit, 2023- 2032
Figure 3. Porter’s Five Forces
Figure 4. Global Gaprin Market Revenue (USD Million) By Regions (2021-2032)
Figure 5. Global Gaprin Market Share (%) By Regions (2023)
Figure 6. North America Gaprin Revenue (USD Million) By Country (2021-2032)
Figure 7. United States Gaprin Revenue (USD Million) By Country (2021-2032)
Figure 8. Canada Gaprin Revenue (USD Million) By Country (2021-2032)
Figure 9. Mexico Gaprin Revenue (USD Million) By Country (2021-2032)
Figure 10. Europe Gaprin Revenue (USD Million) By Country (2021-2032)
Figure 11. Germany Gaprin Revenue (USD Million) By Country (2021-2032)
Figure 12. France Gaprin Revenue (USD Million) By Country (2021-2032)
Figure 13. United Kingdom Gaprin Revenue (USD Million) By Country (2021-2032)
Figure 14. Spain Gaprin Revenue (USD Million) By Country (2021-2032)
Figure 15. Italy Gaprin Revenue (USD Million) By Country (2021-2032)
Figure 16. Russia Gaprin Revenue (USD Million) By Country (2021-2032)
Figure 17. Rest of Europe Gaprin Revenue (USD Million) By Country (2021-2032)
Figure 11. Asia Pacific Gaprin Revenue (USD Million) By Country (2021-2032)
Figure 12. China Gaprin Revenue (USD Million) By Country (2021-2032)
Figure 13. Japan Gaprin Revenue (USD Million) By Country (2021-2032)
Figure 14. India Gaprin Revenue (USD Million) By Country (2021-2032)
Figure 15. South Korea Gaprin Revenue (USD Million) By Country (2021-2032)
Figure 16. Australia Gaprin Revenue (USD Million) By Country (2021-2032)
Figure 17. South East Asia Gaprin Revenue (USD Million) By Country (2021-2032)
Figure 18. South America Gaprin Revenue (USD Million) By Country (2021-2032)
Figure 19. Brazil Gaprin Revenue (USD Million) By Country (2021-2032)
Figure 20. Argentina Gaprin Revenue (USD Million) By Country (2021-2032)
Figure 21. Rest of Asia Pacific Gaprin Revenue (USD Million) By Country (2021-2032)
Figure 22. Middle East and Africa Gaprin Revenue (USD Million) By Region (2021-2032)
Figure 23. Saudi Arabia Gaprin Revenue (USD Million) By Region (2021-2032)
Figure 24. The UAE Gaprin Revenue (USD Million) By Region (2021-2032)
Figure 25. Rest of Middle East Gaprin Revenue (USD Million) By Region (2021-2032)
Figure 26. South Africa Gaprin Revenue (USD Million) By Region (2021-2032)
Figure 27. Africa Gaprin Revenue (USD Million) By Region (2021-2032)
Figure 28. North America Gaprin Revenue (USD Million) By Type (2021-2032)
Figure 29. North America Gaprin Revenue (USD Million) By Application (2021-2032)
Figure 30. North America Gaprin Revenue (USD Million) By Product (2021-2032)
Figure 31. Europe Gaprin Revenue (USD Million) By Type (2021-2032)
Figure 32. Europe Gaprin Revenue (USD Million) By Application (2021-2032)
Figure 33. Europe Gaprin Revenue (USD Million) By Product (2021-2032)
Figure 34. Asia Pacific Gaprin Revenue (USD Million) By Type (2021-2032)
Figure 35. Asia Pacific Gaprin Revenue (USD Million) By Application (2021-2032)
Figure 36. Asia Pacific Gaprin Revenue (USD Million) By Product (2021-2032)
Figure 37. South America Gaprin Revenue (USD Million) By Type (2021-2032)
Figure 38. South America Gaprin Revenue (USD Million) By Application (2021-2032)
Figure 39. South America Gaprin Revenue (USD Million) By Product (2021-2032)
Figure 40. Middle East and Africa Gaprin Revenue (USD Million) By Type (2021-2032)
Figure 41. Middle East and Africa Gaprin Revenue (USD Million) By Application (2021-2032)
Figure 42. Middle East and Africa Gaprin Revenue (USD Million) By Product (2021-2032)
By Type
Food Grade
Feed Grade
By Application
Food & Beverages
Animal Feed
Others
Countries Analyzed
North America (US, Canada, Mexico)
Europe (Germany, UK, France, Spain, Italy, Russia, Rest of Europe)
Asia Pacific (China, India, Japan, South Korea, Australia, South East Asia, Rest of Asia)
South America (Brazil, Argentina, Rest of South America)
Middle East and Africa (Saudi Arabia, UAE, Rest of Middle East, South Africa, Egypt, Rest of Africa)
