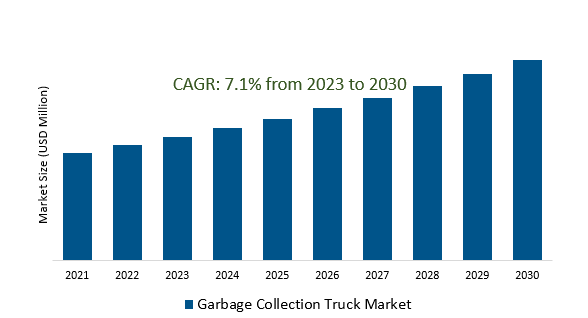
The Garbage Collection Truck Market Size is estimated to register 7.1% growth over the forecast period from 2023 to 2030
Garbage Collection Truck Market Overview
Growing emphasis on environmentally friendly initiatives drives the adoption of electric or alternative fuel-powered garbage collection trucks to reduce emissions and operational costs. Manufacturers are emphasizing ergonomic designs and safety features in garbage trucks to improve driver comfort, reduce fatigue, and enhance overall safety during waste collection operations. Rapid urbanization and population growth is globally contributing to increased waste generation, boosting the demand for efficient garbage collection trucks to manage and dispose of municipal solid waste. Growing emphasis on waste recycling and segregation initiatives by governments and municipalities creates demand for specialized garbage trucks equipped with separate compartments or systems for various waste types. Growing concerns about public health and sanitation drive investments in waste management infrastructure.
Garbage Collection Truck Market Dynamics
Market Trends- Emphasis on Safety and Ergonomics in Garbage Collection Truck Market.
Innovative safety systems such as collision detection, blind-spot monitoring, automatic braking, and rear-view cameras to enhance driver visibility and minimize accidents are influencing the market growth.
Manufacturers are placing significant emphasis on integrating advanced safety technologies and ergonomic enhancements into garbage collection trucks prompted by a growing priority for worker safety, increased regulations, and the pursuit of operational efficiency.
Features like adjustable seating, user-friendly controls, and optimized cabin layouts are being incorporated into the design of modern garbage trucks, driving the market growth.
Market Driver- Demand for Sustainable Solutions in Garbage Collection drives the market.
Municipalities, waste management companies, and other stakeholders, seeking more sustainable solutions to reduce carbon footprints and minimize the environmental impact of waste collection and disposal are fueling the demand.
Heightened interest in procuring garbage collection trucks equipped with alternative fuel systems, such as electric or hybrid models, aiming to lower emissions and comply with stringent emission standards are driving the market growth.
Further, the integration of innovative technologies, including regenerative braking systems and low-emission powertrains, aligns with the industry's shift toward sustainable operations, thereby increasing the demand.
Market Opportunity- Urbanization and population growth significantly drive the demand for Garbage Collection Market.
The rapid expansion of urban areas and the increasing global population are driving the escalating demand for efficient waste management solutions.
Municipalities and waste management companies are compelled to invest in modern waste collection vehicles capable of navigating urban landscapes and efficiently collecting and disposing of waste.
Simultaneously, population growth is driving the need for reliable and scalable waste management infrastructure, prompting the procurement of innovative garbage collection trucks equipped with advanced technology to address the evolving waste disposal challenges in densely populated areas.
Market Share Analysis- Mid-size Type will register the fastest growth.
The Garbage Collection Truck Market is analyzed across Small Type, Mid-size Type & Large Type. Mid-size Type is poised to register the fastest growth. These trucks typically fall between smaller, more agile vehicles and larger, heavy-duty options. The mid-size type is often preferred for waste collection in suburban or moderately populated areas where there's a need for a moderate waste collection capacity combined with the flexibility to navigate narrower streets or areas with limited access. These trucks are versatile enough to handle varying waste collection demands while being more maneuverable compared to larger types, making them suitable for municipal or private waste management operations servicing moderately sized communities. Additionally, they often come with multiple loading options, such as rear or side loading mechanisms, providing flexibility in waste collection methods. These vehicles offer a balance between efficiency and operational costs, appealing to waste management companies seeking a capacity that falls between small-scale and heavy-duty waste collection vehicles.
Market Share Analysis- Rear Loader held a significant market share in 2023.
The Garbage Collection Truck Market is analyzed across various loading compartments including Front Loader, Side Loader & Rear Loader. Of these, Rear Loader held a significant market share in 2023. These trucks are equipped with hydraulic compactors and lifting mechanisms located at the rear, facilitating the collection and disposal of municipal solid waste efficiently. One of the primary features of rear loader trucks is their ability to collect waste from curbside bins or containers and compress it directly into the rear storage compartment using the hydraulic compactor. This mechanism allows for the efficient handling of various types of waste, including household waste, recyclables, and green waste. Their adaptability to navigate urban and suburban environments, combined with their moderate to high capacity for waste storage, makes them suitable for diverse waste collection needs.
Garbage Collection Truck Market Segmentation
By Type
- Small Type
- Mid-size Type
- Large Type
By Loading
- Front Loader
- Side Loader
- Rear Loader
By Application
- Residential
- Commercial
- Industrial
By Technology
- Semi-Automatic garbage truck
- Automatic garbage truck
By Region
- North America (United States, Canada, Mexico)
- Europe (Germany, France, United Kingdom, Spain, Italy, Others)
- Asia Pacific (China, India, Japan, South Korea, Australia, Others)
- Latin America (Brazil, Argentina, Others)
- Middle East and Africa (Saudi Arabia, UAE, Kuwait, Other Middle East, South Africa, Nigeria, Other Africa)
Garbage Collection Truck Market
- Dongfeng Motor (China)
- Ceec Trucks Industry (China)
- Cheng Li (China)
- Curbtender (United States)
- Cnhtc (China)
- Foton car (China)
- Fujian Longma sanitation (China)
- Faun (Germany)
- Zoomlion (China)
- Dennis Eagle (United Kingdom)
*List not exhaustive
Garbage Collection Truck Market Outlook 2023
1 Market Overview
1.1 Introduction to the Garbage Collection Truck Market
1.2 Scope of the Study
1.3 Research Objective
1.3.1 Key Market Scope and Segments
1.3.2 Players Covered
1.3.3 Years Considered
2 Executive Summary
2.1 2023 Garbage Collection Truck Industry- Market Statistics
3 Market Dynamics
3.1 Market Drivers
3.2 Market Challenges
3.3 Market Opportunities
3.4 Market Trends
4 Market Factor Analysis
4.1 Porter’s Five Forces
4.2 Market Entropy
4.2.1 Global Garbage Collection Truck Market Companies with Area Served
4.2.2 Products Offerings Global Garbage Collection Truck Market
5 COVID-19 Impact Analysis and Outlook Scenarios
5.1.1 Covid-19 Impact Analysis
5.1.2 post-COVID-19 Scenario- Low Growth Case
5.1.3 post-COVID-19 Scenario- Reference Growth Case
5.1.4 post-COVID-19 Scenario- Low Growth Case
6 Global Garbage Collection Truck Market Trends
6.1 Global Garbage Collection Truck Revenue (USD Million) and CAGR (%) by Type (2018-2030)
6.2 Global Garbage Collection Truck Revenue (USD Million) and CAGR (%) by Applications (2018-2030)
6.3 Global Garbage Collection Truck Revenue (USD Million) and CAGR (%) by regions (2018-2030)
7 Global Garbage Collection Truck Market Revenue (USD Million) by Type, and Applications (2018-2022)
7.1 Global Garbage Collection Truck Revenue (USD Million) by Type (2018-2022)
7.1.1 Global Garbage Collection Truck Revenue (USD Million), Market Share (%) by Type (2018-2022)
7.2 Global Garbage Collection Truck Revenue (USD Million) by Applications (2018-2022)
7.2.1 Global Garbage Collection Truck Revenue (USD Million), Market Share (%) by Applications (2018-2022)
8 Global Garbage Collection Truck Development Regional Status and Outlook
8.1 Global Garbage Collection Truck Revenue (USD Million) By Regions (2018-2022)
8.2 North America Garbage Collection Truck Revenue (USD Million) by Type, and Application (2018-2022)
8.2.1 North America Garbage Collection Truck Revenue (USD Million) by Country (2018-2022)
8.2.2 North America Garbage Collection Truck Revenue (USD Million) by Type (2018-2022)
8.2.3 North America Garbage Collection Truck Revenue (USD Million) by Applications (2018-2022)
8.3 Europe Garbage Collection Truck Revenue (USD Million), by Type, and Applications (USD Million) (2018-2022)
8.3.1 Europe Garbage Collection Truck Revenue (USD Million), by Country (2018-2022)
8.3.2 Europe Garbage Collection Truck Revenue (USD Million) by Type (2018-2022)
8.3.3 Europe Garbage Collection Truck Revenue (USD Million) by Applications (2018-2022)
8.4 Asia Pacific Garbage Collection Truck Revenue (USD Million), and Revenue (USD Million) by Type, and Applications (2018-2022)
8.4.1 Asia Pacific Garbage Collection Truck Revenue (USD Million) by Country (2018-2022)
8.4.2 Asia Pacific Garbage Collection Truck Revenue (USD Million) by Type (2018-2022)
8.4.3 Asia Pacific Garbage Collection Truck Revenue (USD Million) by Applications (2018-2022)
8.5 South America Garbage Collection Truck Revenue (USD Million), by Type, and Applications (2018-2022)
8.5.1 South America Garbage Collection Truck Revenue (USD Million), by Country (2018-2022)
8.5.2 South America Garbage Collection Truck Revenue (USD Million) by Type (2018-2022)
8.5.3 South America Garbage Collection Truck Revenue (USD Million) by Applications (2018-2022)
8.6 Middle East and Africa Garbage Collection Truck Revenue (USD Million), by Type, Technology, Application, Thickness (2018-2022)
8.6.1 Middle East and Africa Garbage Collection Truck Revenue (USD Million) by Country (2018-2022)
8.6.2 Middle East and Africa Garbage Collection Truck Revenue (USD Million) by Type (2018-2022)
8.6.3 Middle East and Africa Garbage Collection Truck Revenue (USD Million) by Applications (2018-2022)
9 Company Profiles
10 Global Garbage Collection Truck Market Revenue (USD Million), by Type, and Applications (2023-2030)
10.1 Global Garbage Collection Truck Revenue (USD Million) and Market Share (%) by Type (2023-2030)
10.1.1 Global Garbage Collection Truck Revenue (USD Million), and Market Share (%) by Type (2023-2030)
10.2 Global Garbage Collection Truck Revenue (USD Million) and Market Share (%) by Applications (2023-2030)
10.2.1 Global Garbage Collection Truck Revenue (USD Million), and Market Share (%) by Applications (2023-2030)
11 Global Garbage Collection Truck Development Regional Status and Outlook Forecast
11.1 Global Garbage Collection Truck Revenue (USD Million) By Regions (2023-2030)
11.2 North America Garbage Collection Truck Revenue (USD Million) by Type, and Applications (2023-2030)
11.2.1 North America Garbage Collection Truck Revenue (USD) Million by Country (2023-2030)
11.2.2 North America Garbage Collection Truck Revenue (USD Million), by Type (2023-2030)
11.2.3 North America Garbage Collection Truck Revenue (USD Million), Market Share (%) by Applications (2023-2030)
11.3 Europe Garbage Collection Truck Revenue (USD Million), by Type, and Applications (2023-2030)
11.3.1 Europe Garbage Collection Truck Revenue (USD Million), by Country (2023-2030)
11.3.2 Europe Garbage Collection Truck Revenue (USD Million), by Type (2023-2030)
11.3.3 Europe Garbage Collection Truck Revenue (USD Million), by Applications (2023-2030)
11.4 Asia Pacific Garbage Collection Truck Revenue (USD Million) by Type, and Applications (2023-2030)
11.4.1 Asia Pacific Garbage Collection Truck Revenue (USD Million), by Country (2023-2030)
11.4.2 Asia Pacific Garbage Collection Truck Revenue (USD Million), by Type (2023-2030)
11.4.3 Asia Pacific Garbage Collection Truck Revenue (USD Million), by Applications (2023-2030)
11.5 South America Garbage Collection Truck Revenue (USD Million), by Type, and Applications (2023-2030)
11.5.1 South America Garbage Collection Truck Revenue (USD Million), by Country (2023-2030)
11.5.2 South America Garbage Collection Truck Revenue (USD Million), by Type (2023-2030)
11.5.3 South America Garbage Collection Truck Revenue (USD Million), by Applications (2023-2030)
11.6 Middle East and Africa Garbage Collection Truck Revenue (USD Million), by Type, and Applications (2023-2030)
11.6.1 Middle East and Africa Garbage Collection Truck Revenue (USD Million), by region (2023-2030)
11.6.2 Middle East and Africa Garbage Collection Truck Revenue (USD Million), by Type (2023-2030)
11.6.3 Middle East and Africa Garbage Collection Truck Revenue (USD Million), by Applications (2023-2030)
12 Methodology and Data Sources
12.1 Methodology/Research Approach
12.1.1 Research Programs/Design
12.1.2 Market Size Estimation
12.1.3 Market Breakdown and Data Triangulation
12.2 Data Sources
12.2.1 Secondary Sources
12.2.2 Primary Sources
12.3 Disclaimer
List of Tables
Table 1 Market Segmentation Analysis
Table 2 Global Garbage Collection Truck Market Companies with Areas Served
Table 3 Products Offerings Global Garbage Collection Truck Market
Table 4 Low Growth Scenario Forecasts
Table 5 Reference Case Growth Scenario
Table 6 High Growth Case Scenario
Table 7 Global Garbage Collection Truck Revenue (USD Million) And CAGR (%) By Type (2018-2030)
Table 8 Global Garbage Collection Truck Revenue (USD Million) And CAGR (%) By Applications (2018-2030)
Table 9 Global Garbage Collection Truck Revenue (USD Million) And CAGR (%) By Regions (2018-2030)
Table 10 Global Garbage Collection Truck Revenue (USD Million) By Type (2018-2022)
Table 11 Global Garbage Collection Truck Revenue Market Share (%) By Type (2018-2022)
Table 12 Global Garbage Collection Truck Revenue (USD Million) By Applications (2018-2022)
Table 13 Global Garbage Collection Truck Revenue Market Share (%) By Applications (2018-2022)
Table 14 Global Garbage Collection Truck Market Revenue (USD Million) By Regions (2018-2022)
Table 15 Global Garbage Collection Truck Market Share (%) By Regions (2018-2022)
Table 16 North America Garbage Collection Truck Revenue (USD Million) By Country (2018-2022)
Table 17 North America Garbage Collection Truck Revenue (USD Million) By Type (2018-2022)
Table 18 North America Garbage Collection Truck Revenue (USD Million) By Applications (2018-2022)
Table 19 Europe Garbage Collection Truck Revenue (USD Million) By Country (2018-2022)
Table 20 Europe Garbage Collection Truck Revenue (USD Million) By Type (2018-2022)
Table 21 Europe Garbage Collection Truck Revenue (USD Million) By Applications (2018-2022)
Table 22 Asia Pacific Garbage Collection Truck Revenue (USD Million) By Country (2018-2022)
Table 23 Asia Pacific Garbage Collection Truck Revenue (USD Million) By Type (2018-2022)
Table 24 Asia Pacific Garbage Collection Truck Revenue (USD Million) By Applications (2018-2022)
Table 25 South America Garbage Collection Truck Revenue (USD Million) By Country (2018-2022)
Table 26 South America Garbage Collection Truck Revenue (USD Million) By Type (2018-2022)
Table 27 South America Garbage Collection Truck Revenue (USD Million) By Applications (2018-2022)
Table 28 Middle East and Africa Garbage Collection Truck Revenue (USD Million) By Region (2018-2022)
Table 29 Middle East and Africa Garbage Collection Truck Revenue (USD Million) By Type (2018-2022)
Table 30 Middle East and Africa Garbage Collection Truck Revenue (USD Million) By Applications (2018-2022)
Table 31 Financial Analysis
Table 32 Global Garbage Collection Truck Revenue (USD Million) By Type (2023-2030)
Table 33 Global Garbage Collection Truck Revenue Market Share (%) By Type (2023-2030)
Table 34 Global Garbage Collection Truck Revenue (USD Million) By Applications (2023-2030)
Table 35 Global Garbage Collection Truck Revenue Market Share (%) By Applications (2023-2030)
Table 36 Global Garbage Collection Truck Market Revenue (USD Million), And Revenue (USD Million) By Regions (2023-2030)
Table 37 North America Garbage Collection Truck Revenue (USD)By Country (2023-2030)
Table 38 North America Garbage Collection Truck Revenue (USD Million) By Type (2023-2030)
Table 39 North America Garbage Collection Truck Revenue (USD Million) By Applications (2023-2030)
Table 40 Europe Garbage Collection Truck Revenue (USD Million) By Country (2023-2030)
Table 41 Europe Garbage Collection Truck Revenue (USD Million) By Type (2023-2030)
Table 42 Europe Garbage Collection Truck Revenue (USD Million) By Applications (2023-2030)
Table 43 Asia Pacific Garbage Collection Truck Revenue (USD Million) By Country (2023-2030)
Table 44 Asia Pacific Garbage Collection Truck Revenue (USD Million) By Type (2023-2030)
Table 45 Asia Pacific Garbage Collection Truck Revenue (USD Million) By Applications (2023-2030)
Table 46 South America Garbage Collection Truck Revenue (USD Million) By Country (2023-2030)
Table 47 South America Garbage Collection Truck Revenue (USD Million) By Type (2023-2030)
Table 48 South America Garbage Collection Truck Revenue (USD Million) By Applications (2023-2030)
Table 49 Middle East and Africa Garbage Collection Truck Revenue (USD Million) By Region (2023-2030)
Table 50 Middle East and Africa Garbage Collection Truck Revenue (USD Million) By Region (2023-2030)
Table 51 Middle East and Africa Garbage Collection Truck Revenue (USD Million) By Type (2023-2030)
Table 52 Middle East and Africa Garbage Collection Truck Revenue (USD Million) By Applications (2023-2030)
Table 53 Research Programs/Design for This Report
Table 54 Key Data Information from Secondary Sources
Table 55 Key Data Information from Primary Sources
List of Figures
Figure 1 Market Scope
Figure 2 Porter’s Five Forces
Figure 3 Global Garbage Collection Truck Revenue (USD Million) By Type (2018-2022)
Figure 4 Global Garbage Collection Truck Revenue Market Share (%) By Type (2022)
Figure 5 Global Garbage Collection Truck Revenue (USD Million) By Applications (2018-2022)
Figure 6 Global Garbage Collection Truck Revenue Market Share (%) By Applications (2022)
Figure 7 Global Garbage Collection Truck Market Revenue (USD Million) By Regions (2018-2022)
Figure 8 Global Garbage Collection Truck Market Share (%) By Regions (2022)
Figure 9 North America Garbage Collection Truck Revenue (USD Million) By Country (2018-2022)
Figure 10 North America Garbage Collection Truck Revenue (USD Million) By Type (2018-2022)
Figure 11 North America Garbage Collection Truck Revenue (USD Million) By Applications (2018-2022)
Figure 12 Europe Garbage Collection Truck Revenue (USD Million) By Country (2018-2022)
Figure 13 Europe Garbage Collection Truck Revenue (USD Million) By Type (2018-2022)
Figure 14 Europe Garbage Collection Truck Revenue (USD Million) By Applications (2018-2022)
Figure 15 Asia Pacific Garbage Collection Truck Revenue (USD Million) By Country (2018-2022)
Figure 16 Asia Pacific Garbage Collection Truck Revenue (USD Million) By Type (2018-2022)
Figure 17 Asia Pacific Garbage Collection Truck Revenue (USD Million) By Applications (2018-2022)
Figure 18 South America Garbage Collection Truck Revenue (USD Million) By Country (2018-2022)
Figure 19 South America Garbage Collection Truck Revenue (USD Million) By Type (2018-2022)
Figure 20 South America Garbage Collection Truck Revenue (USD Million) By Applications (2018-2022)
Figure 21 Middle East and Africa Garbage Collection Truck Revenue (USD Million) By Region (2018-2022)
Figure 22 Middle East and Africa Garbage Collection Truck Revenue (USD Million) By Type (2018-2022)
Figure 23 Middle East and Africa Garbage Collection Truck Revenue (USD Million) By Applications (2018-2022)
Figure 24 Global Garbage Collection Truck Revenue (USD Million) By Type (2023-2030)
Figure 25 Global Garbage Collection Truck Revenue Market Share (%) By Type (2030)
Figure 26 Global Garbage Collection Truck Revenue (USD Million) By Applications (2023-2030)
Figure 27 Global Garbage Collection Truck Revenue Market Share (%) By Applications (2030)
Figure 28 Global Garbage Collection Truck Market Revenue (USD Million) By Regions (2023-2030)
Figure 29 North America Garbage Collection Truck Revenue (USD Million) By Country (2023-2030)
Figure 30 North America Garbage Collection Truck Revenue (USD Million) By Type (2023-2030)
Figure 31 North America Garbage Collection Truck Revenue (USD Million) By Applications (2023-2030)
Figure 32 Europe Garbage Collection Truck Revenue (USD Million) By Country (2023-2030)
Figure 33 Europe Garbage Collection Truck Revenue (USD Million) By Type (2023-2030)
Figure 34 Europe Garbage Collection Truck Revenue (USD Million) By Applications (2023-2030)
Figure 35 Asia Pacific Garbage Collection Truck Revenue (USD Million) By Country (2023-2030)
Figure 36 Asia Pacific Garbage Collection Truck Revenue (USD Million) By Type (2023-2030)
Figure 37 Asia Pacific Garbage Collection Truck Revenue (USD Million) By Applications (2023-2030)
Figure 38 South America Garbage Collection Truck Revenue (USD Million) By Country (2023-2030)
Figure 39 South America Garbage Collection Truck Revenue (USD Million) By Type (2023-2030)
Figure 40 South America Garbage Collection Truck Revenue (USD Million) By Applications (2023-2030)
Figure 41 Middle East and Africa Garbage Collection Truck Revenue (USD Million) By Region (2023-2030)
Figure 42 Middle East and Africa Garbage Collection Truck Revenue (USD Million) By Region (2023-2030)
Figure 43 Middle East and Africa Garbage Collection Truck Revenue (USD Million) By Type (2023-2030)
Figure 44 Middle East and Africa Garbage Collection Truck Revenue (USD Million) By Applications (2023-2030)
Figure 45 Bottom-Up and Top-Down Approaches for This Report
Figure 46 Data Triangulation
