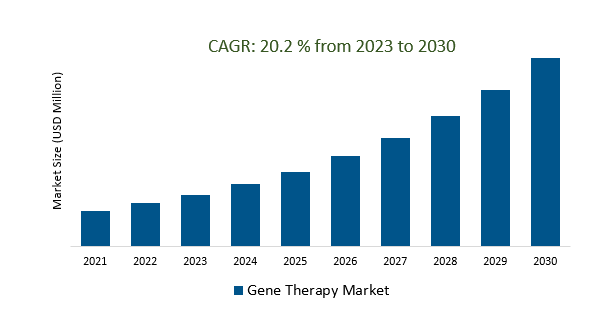
According to USD Analytics the Global Gene Therapy Market is projected to register a 20.2% CAGR from 2025 to 2034.
The market growth is driven by increasing investments from both public and private sectors are fueling research and development in gene therapy. Leading Companies focusing on the Expansion of Indications, Advanced Technologies, Improved Delivery Systems, Personalized Medicine, Long-lasting and Curative Therapies, Academic and Industry Collaboration, and others to boost market shares in the industry.
Market Overview
The gene therapy market has shown remarkable growth driven by advancements in gene editing technologies, increasing investments, regulatory approvals, and a strong focus on treating rare diseases. This dynamic market is characterized by collaborations between pharmaceutical companies and academic institutions, a patient-centric approach, and personalized treatments. Despite its immense potential, gene therapy faces challenges related to safety, high development costs, and ethical concerns. However, with ongoing research, expanding applications in various medical fields, and regulatory support, the gene therapy market is poised for continued growth and innovation, offering curative and personalized treatments for a wide range of diseases and conditions
Market Dynamics
Market Trends- Potential of Gene Editing to Revolutionize the Treatment of Non-Genetic Diseases
Gene editing technologies, particularly CRISPR-Cas9, are poised to revolutionize the treatment of non-genetic diseases, including cancer, heart disease, and infectious ailments. These technologies offer precision in targeting disease-related genes and enhancing therapeutic outcomes. By modifying immune cells to combat cancer more effectively or correcting genes associated with non-genetic diseases, gene editing holds great promise for curative treatments. However, challenges related to safety, ethics, and regulation must be addressed as this transformative approach becomes increasingly integral to modern medicine, offering new hope for patients with a wide range of conditions.
Market Driver- Growing Demand for Gene Therapy Products Drives Market Growth
The gene therapy market is experiencing substantial growth due to the escalating demand for gene therapy products. This demand surge is propelled by successful clinical applications, approvals for rare genetic disorders, and the expanding scope of gene therapy for non-genetic diseases, notably in oncology. Advancements in manufacturing processes, delivery systems, and increased patient awareness are making gene therapy more accessible, contributing to this robust demand. However, challenges like high costs and regulatory complexities need addressing to ensure equitable access. In this dynamic landscape, gene therapy signifies not only a promising treatment option but also a symbol of science's potential to reshape healthcare and improve patients' lives.
Market Opportunity- Expanded Clinical Trials Drive Innovation and Progress in Gene Therapy
Clinical trials are the driving force behind the rapid progress and innovation in the gene therapy market. With expanding trials, gene therapy is no longer limited to niche applications; it's becoming a mainstream treatment for various diseases, including cancer. Collaborations between academic institutions and pharmaceutical companies are accelerating research and development. The data generated from these trials are essential for regulatory approvals and lay the foundation for further advancements in the field, making gene therapy an integral part of modern medicine with a promising future.
Market Share Analysis- spinal muscular atrophy (SMA) Gene Therapy Market will register the fastest growth
The Global Gene Therapy Market is analyzed across Acute Lymphoblastic Leukemia (ALL), Inherited Retinal Disease, Large B-cell lymphoma, ADA-SCID, Melanoma (lesions), Beta-Thalassemia Major/SCD, Head and Neck Squamous Cell Carcinoma, Peripheral Arterial Disease, Spinal Muscular Atrophy (SMA). spinal muscular atrophy (SMA) is poised to register the fastest growth. The Spinal Muscular Atrophy (SMA) gene therapy market is rapidly expanding, driven by groundbreaking developments such as Zolgensma, which offers a revolutionary treatment for this rare genetic disorder. This growth is propelled by the urgent need for innovative therapies and the willingness of healthcare systems to cover high-cost treatments. The market is marked by intense competition among companies, fostering innovation and potential cost reduction. Technological advancements, safety improvements, and enhanced delivery systems are further contributing to the market's success. However, challenges concerning equitable access, reimbursement, and the need for long-term follow-up studies persist, making patient advocacy and ongoing research crucial for ensuring the continued progress and accessibility of SMA gene therapies.
Market Share Analysis- Lentivirus held a significant market share in 2023
The Global Gene Therapy Market is analyzed across various sectors including Lentivirus, AAV, RetroVirus & gamma RetroVirus, Modified Herpes Simplex Virus, Adenovirus, Non-viral Plasmid Vector, and others. Of these, Lentivirus held a significant market share in 2023. The Lentivirus Gene Therapy Market is experiencing rapid expansion due to the versatility and efficacy of lentiviruses as gene therapy vectors. Lentivirus-based gene therapies hold promise in treating a broad spectrum of genetic and non-genetic disorders, offering long-term gene expression and stability. Applications span rare diseases, cancer, and neurodegenerative conditions, with ongoing advancements in vector design and delivery systems enhancing their appeal. However, challenges related to safety and immune responses must be addressed. The remarkable growth of this market underscores the transformative potential of lentivirus gene therapy in modern medicine.
Gene Therapy Market Segmentation
By Indication
- Acute Lymphoblastic Leukemia (ALL)
- Inherited Retinal Disease
- Large B-Cell Lymphoma
- ADA-SCID
- Melanoma (lesions)
- Beta-Thalassemia Major/SCD
- Head & Neck Squamous Cell Carcinoma
- Peripheral Arterial Disease
- Spinal Muscular Atrophy (SMA)
- Others
By Vector
- Lentivirus
- AAV
- RetroVirus & gamma RetroVirus
- Modified Herpes Simplex Virus
- Adenovirus
- Non-viral Plasmid Vector
- Others
By Region
- North America (United States, Canada, Mexico)
- Europe (Germany, France, United Kingdom, Spain, Italy, Others)
- Asia Pacific (China, India, Japan, South Korea, Australia, Others)
- Latin America (Brazil, Argentina, Others)
- Middle East and Africa (Saudi Arabia, UAE, Kuwait, Other Middle East, South Africa, Nigeria, Other Africa)
Gene Therapy Market Companies
- REGENXBIO Inc
- Oxford BioMedica plc
- Dimension Therapeutics Inc
- Bristol-Myers Squibb Company
- SANOFI
- Applied Genetic Technologies Corporation
- UniQure N.V.
- Shire Plc
- F. Hoffmann-La Roche Ltd
- Bluebird Bio Inc
- Novartis AG
- Taxus Cardium Pharmaceuticals Group Inc
- Cellectis S.A.
- Sangamo Therapeutics Inc
- Orchard Therapeutics
- Gilead Lifesciences Inc
- BENITEC BIOPHARMA
- Sibiono GeneTech Co Ltd
- Epeius Biotechnologies Corp
- Shanghai Sunway Biotech Co Ltd
- Gensight Biologics S.A.
- Transgene
- Astellas Pharma Inc
- American Gene Technologies
- BioMarin Pharmaceuticals Inc
- Calimmune Inc
*List not exhaustive
Gene Therapy Market Outlook 2024
1 Market Overview
1.1 Introduction to the Gene Therapy Market
1.2 Scope of the Study
1.3 Research Objective
1.3.1 Key Market Scope and Segments
1.3.2 Players Covered
1.3.3 Years Considered
2 Executive Summary
2.1 2023 Gene Therapy Industry- Market Statistics
3 Market Dynamics
3.1 Market Drivers
3.2 Market Challenges
3.3 Market Opportunities
3.4 Market Trends
4 Market Factor Analysis
4.1 Porter’s Five Forces
4.2 Market Entropy
4.2.1 Global Gene Therapy Market Companies with Area Served
4.2.2 Products Offerings Global Gene Therapy Market
5 COVID-19 Impact Analysis and Outlook Scenarios
5.1.1 Covid-19 Impact Analysis
5.1.2 post-COVID-19 Scenario- Low Growth Case
5.1.3 post-COVID-19 Scenario- Reference Growth Case
5.1.4 post-COVID-19 Scenario- Low Growth Case
6 Global Gene Therapy Market Trends
6.1 Global Gene Therapy Revenue (USD Million) and CAGR (%) by Type (2018-2030)
6.2 Global Gene Therapy Revenue (USD Million) and CAGR (%) by Applications (2018-2030)
6.3 Global Gene Therapy Revenue (USD Million) and CAGR (%) by regions (2018-2030)
7 Global Gene Therapy Market Revenue (USD Million) by Type, and Applications (2018-2022)
7.1 Global Gene Therapy Revenue (USD Million) by Type (2018-2022)
7.1.1 Global Gene Therapy Revenue (USD Million), Market Share (%) by Type (2018-2022)
7.2 Global Gene Therapy Revenue (USD Million) by Applications (2018-2022)
7.2.1 Global Gene Therapy Revenue (USD Million), Market Share (%) by Applications (2018-2022)
8 Global Gene Therapy Development Regional Status and Outlook
8.1 Global Gene Therapy Revenue (USD Million) By Regions (2018-2022)
8.2 North America Gene Therapy Revenue (USD Million) by Type, and Application (2018-2022)
8.2.1 North America Gene Therapy Revenue (USD Million) by Country (2018-2022)
8.2.2 North America Gene Therapy Revenue (USD Million) by Type (2018-2022)
8.2.3 North America Gene Therapy Revenue (USD Million) by Applications (2018-2022)
8.3 Europe Gene Therapy Revenue (USD Million), by Type, and Applications (USD Million) (2018-2022)
8.3.1 Europe Gene Therapy Revenue (USD Million), by Country (2018-2022)
8.3.2 Europe Gene Therapy Revenue (USD Million) by Type (2018-2022)
8.3.3 Europe Gene Therapy Revenue (USD Million) by Applications (2018-2022)
8.4 Asia Pacific Gene Therapy Revenue (USD Million), and Revenue (USD Million) by Type, and Applications (2018-2022)
8.4.1 Asia Pacific Gene Therapy Revenue (USD Million) by Country (2018-2022)
8.4.2 Asia Pacific Gene Therapy Revenue (USD Million) by Type (2018-2022)
8.4.3 Asia Pacific Gene Therapy Revenue (USD Million) by Applications (2018-2022)
8.5 South America Gene Therapy Revenue (USD Million), by Type, and Applications (2018-2022)
8.5.1 South America Gene Therapy Revenue (USD Million), by Country (2018-2022)
8.5.2 South America Gene Therapy Revenue (USD Million) by Type (2018-2022)
8.5.3 South America Gene Therapy Revenue (USD Million) by Applications (2018-2022)
8.6 Middle East and Africa Gene Therapy Revenue (USD Million), by Type, Technology, Application, Thickness (2018-2022)
8.6.1 Middle East and Africa Gene Therapy Revenue (USD Million) by Country (2018-2022)
8.6.2 Middle East and Africa Gene Therapy Revenue (USD Million) by Type (2018-2022)
8.6.3 Middle East and Africa Gene Therapy Revenue (USD Million) by Applications (2018-2022)
9 Company Profiles
10 Global Gene Therapy Market Revenue (USD Million), by Type, and Applications (2023-2030)
10.1 Global Gene Therapy Revenue (USD Million) and Market Share (%) by Type (2023-2030)
10.1.1 Global Gene Therapy Revenue (USD Million), and Market Share (%) by Type (2023-2030)
10.2 Global Gene Therapy Revenue (USD Million) and Market Share (%) by Applications (2023-2030)
10.2.1 Global Gene Therapy Revenue (USD Million), and Market Share (%) by Applications (2023-2030)
11 Global Gene Therapy Development Regional Status and Outlook Forecast
11.1 Global Gene Therapy Revenue (USD Million) By Regions (2023-2030)
11.2 North America Gene Therapy Revenue (USD Million) by Type, and Applications (2023-2030)
11.2.1 North America Gene Therapy Revenue (USD) Million by Country (2023-2030)
11.2.2 North America Gene Therapy Revenue (USD Million), by Type (2023-2030)
11.2.3 North America Gene Therapy Revenue (USD Million), Market Share (%) by Applications (2023-2030)
11.3 Europe Gene Therapy Revenue (USD Million), by Type, and Applications (2023-2030)
11.3.1 Europe Gene Therapy Revenue (USD Million), by Country (2023-2030)
11.3.2 Europe Gene Therapy Revenue (USD Million), by Type (2023-2030)
11.3.3 Europe Gene Therapy Revenue (USD Million), by Applications (2023-2030)
11.4 Asia Pacific Gene Therapy Revenue (USD Million) by Type, and Applications (2023-2030)
11.4.1 Asia Pacific Gene Therapy Revenue (USD Million), by Country (2023-2030)
11.4.2 Asia Pacific Gene Therapy Revenue (USD Million), by Type (2023-2030)
11.4.3 Asia Pacific Gene Therapy Revenue (USD Million), by Applications (2023-2030)
11.5 South America Gene Therapy Revenue (USD Million), by Type, and Applications (2023-2030)
11.5.1 South America Gene Therapy Revenue (USD Million), by Country (2023-2030)
11.5.2 South America Gene Therapy Revenue (USD Million), by Type (2023-2030)
11.5.3 South America Gene Therapy Revenue (USD Million), by Applications (2023-2030)
11.6 Middle East and Africa Gene Therapy Revenue (USD Million), by Type, and Applications (2023-2030)
11.6.1 Middle East and Africa Gene Therapy Revenue (USD Million), by region (2023-2030)
11.6.2 Middle East and Africa Gene Therapy Revenue (USD Million), by Type (2023-2030)
11.6.3 Middle East and Africa Gene Therapy Revenue (USD Million), by Applications (2023-2030)
12 Methodology and Data Sources
12.1 Methodology/Research Approach
12.1.1 Research Programs/Design
12.1.2 Market Size Estimation
12.1.3 Market Breakdown and Data Triangulation
12.2 Data Sources
12.2.1 Secondary Sources
12.2.2 Primary Sources
12.3 Disclaimer
List of Tables
Table 1 Market Segmentation Analysis
Table 2 Global Gene Therapy Market Companies with Areas Served
Table 3 Products Offerings Global Gene Therapy Market
Table 4 Low Growth Scenario Forecasts
Table 5 Reference Case Growth Scenario
Table 6 High Growth Case Scenario
Table 7 Global Gene Therapy Revenue (USD Million) And CAGR (%) By Type (2018-2030)
Table 8 Global Gene Therapy Revenue (USD Million) And CAGR (%) By Applications (2018-2030)
Table 9 Global Gene Therapy Revenue (USD Million) And CAGR (%) By Regions (2018-2030)
Table 10 Global Gene Therapy Revenue (USD Million) By Type (2018-2022)
Table 11 Global Gene Therapy Revenue Market Share (%) By Type (2018-2022)
Table 12 Global Gene Therapy Revenue (USD Million) By Applications (2018-2022)
Table 13 Global Gene Therapy Revenue Market Share (%) By Applications (2018-2022)
Table 14 Global Gene Therapy Market Revenue (USD Million) By Regions (2018-2022)
Table 15 Global Gene Therapy Market Share (%) By Regions (2018-2022)
Table 16 North America Gene Therapy Revenue (USD Million) By Country (2018-2022)
Table 17 North America Gene Therapy Revenue (USD Million) By Type (2018-2022)
Table 18 North America Gene Therapy Revenue (USD Million) By Applications (2018-2022)
Table 19 Europe Gene Therapy Revenue (USD Million) By Country (2018-2022)
Table 20 Europe Gene Therapy Revenue (USD Million) By Type (2018-2022)
Table 21 Europe Gene Therapy Revenue (USD Million) By Applications (2018-2022)
Table 22 Asia Pacific Gene Therapy Revenue (USD Million) By Country (2018-2022)
Table 23 Asia Pacific Gene Therapy Revenue (USD Million) By Type (2018-2022)
Table 24 Asia Pacific Gene Therapy Revenue (USD Million) By Applications (2018-2022)
Table 25 South America Gene Therapy Revenue (USD Million) By Country (2018-2022)
Table 26 South America Gene Therapy Revenue (USD Million) By Type (2018-2022)
Table 27 South America Gene Therapy Revenue (USD Million) By Applications (2018-2022)
Table 28 Middle East and Africa Gene Therapy Revenue (USD Million) By Region (2018-2022)
Table 29 Middle East and Africa Gene Therapy Revenue (USD Million) By Type (2018-2022)
Table 30 Middle East and Africa Gene Therapy Revenue (USD Million) By Applications (2018-2022)
Table 31 Financial Analysis
Table 32 Global Gene Therapy Revenue (USD Million) By Type (2023-2030)
Table 33 Global Gene Therapy Revenue Market Share (%) By Type (2023-2030)
Table 34 Global Gene Therapy Revenue (USD Million) By Applications (2023-2030)
Table 35 Global Gene Therapy Revenue Market Share (%) By Applications (2023-2030)
Table 36 Global Gene Therapy Market Revenue (USD Million), And Revenue (USD Million) By Regions (2023-2030)
Table 37 North America Gene Therapy Revenue (USD)By Country (2023-2030)
Table 38 North America Gene Therapy Revenue (USD Million) By Type (2023-2030)
Table 39 North America Gene Therapy Revenue (USD Million) By Applications (2023-2030)
Table 40 Europe Gene Therapy Revenue (USD Million) By Country (2023-2030)
Table 41 Europe Gene Therapy Revenue (USD Million) By Type (2023-2030)
Table 42 Europe Gene Therapy Revenue (USD Million) By Applications (2023-2030)
Table 43 Asia Pacific Gene Therapy Revenue (USD Million) By Country (2023-2030)
Table 44 Asia Pacific Gene Therapy Revenue (USD Million) By Type (2023-2030)
Table 45 Asia Pacific Gene Therapy Revenue (USD Million) By Applications (2023-2030)
Table 46 South America Gene Therapy Revenue (USD Million) By Country (2023-2030)
Table 47 South America Gene Therapy Revenue (USD Million) By Type (2023-2030)
Table 48 South America Gene Therapy Revenue (USD Million) By Applications (2023-2030)
Table 49 Middle East and Africa Gene Therapy Revenue (USD Million) By Region (2023-2030)
Table 50 Middle East and Africa Gene Therapy Revenue (USD Million) By Region (2023-2030)
Table 51 Middle East and Africa Gene Therapy Revenue (USD Million) By Type (2023-2030)
Table 52 Middle East and Africa Gene Therapy Revenue (USD Million) By Applications (2023-2030)
Table 53 Research Programs/Design for This Report
Table 54 Key Data Information from Secondary Sources
Table 55 Key Data Information from Primary Sources
List of Figures
Figure 1 Market Scope
Figure 2 Porter’s Five Forces
Figure 3 Global Gene Therapy Revenue (USD Million) By Type (2018-2022)
Figure 4 Global Gene Therapy Revenue Market Share (%) By Type (2022)
Figure 5 Global Gene Therapy Revenue (USD Million) By Applications (2018-2022)
Figure 6 Global Gene Therapy Revenue Market Share (%) By Applications (2022)
Figure 7 Global Gene Therapy Market Revenue (USD Million) By Regions (2018-2022)
Figure 8 Global Gene Therapy Market Share (%) By Regions (2022)
Figure 9 North America Gene Therapy Revenue (USD Million) By Country (2018-2022)
Figure 10 North America Gene Therapy Revenue (USD Million) By Type (2018-2022)
Figure 11 North America Gene Therapy Revenue (USD Million) By Applications (2018-2022)
Figure 12 Europe Gene Therapy Revenue (USD Million) By Country (2018-2022)
Figure 13 Europe Gene Therapy Revenue (USD Million) By Type (2018-2022)
Figure 14 Europe Gene Therapy Revenue (USD Million) By Applications (2018-2022)
Figure 15 Asia Pacific Gene Therapy Revenue (USD Million) By Country (2018-2022)
Figure 16 Asia Pacific Gene Therapy Revenue (USD Million) By Type (2018-2022)
Figure 17 Asia Pacific Gene Therapy Revenue (USD Million) By Applications (2018-2022)
Figure 18 South America Gene Therapy Revenue (USD Million) By Country (2018-2022)
Figure 19 South America Gene Therapy Revenue (USD Million) By Type (2018-2022)
Figure 20 South America Gene Therapy Revenue (USD Million) By Applications (2018-2022)
Figure 21 Middle East and Africa Gene Therapy Revenue (USD Million) By Region (2018-2022)
Figure 22 Middle East and Africa Gene Therapy Revenue (USD Million) By Type (2018-2022)
Figure 23 Middle East and Africa Gene Therapy Revenue (USD Million) By Applications (2018-2022)
Figure 24 Global Gene Therapy Revenue (USD Million) By Type (2023-2030)
Figure 25 Global Gene Therapy Revenue Market Share (%) By Type (2030)
Figure 26 Global Gene Therapy Revenue (USD Million) By Applications (2023-2030)
Figure 27 Global Gene Therapy Revenue Market Share (%) By Applications (2030)
Figure 28 Global Gene Therapy Market Revenue (USD Million) By Regions (2023-2030)
Figure 29 North America Gene Therapy Revenue (USD Million) By Country (2023-2030)
Figure 30 North America Gene Therapy Revenue (USD Million) By Type (2023-2030)
Figure 31 North America Gene Therapy Revenue (USD Million) By Applications (2023-2030)
Figure 32 Europe Gene Therapy Revenue (USD Million) By Country (2023-2030)
Figure 33 Europe Gene Therapy Revenue (USD Million) By Type (2023-2030)
Figure 34 Europe Gene Therapy Revenue (USD Million) By Applications (2023-2030)
Figure 35 Asia Pacific Gene Therapy Revenue (USD Million) By Country (2023-2030)
Figure 36 Asia Pacific Gene Therapy Revenue (USD Million) By Type (2023-2030)
Figure 37 Asia Pacific Gene Therapy Revenue (USD Million) By Applications (2023-2030)
Figure 38 South America Gene Therapy Revenue (USD Million) By Country (2023-2030)
Figure 39 South America Gene Therapy Revenue (USD Million) By Type (2023-2030)
Figure 40 South America Gene Therapy Revenue (USD Million) By Applications (2023-2030)
Figure 41 Middle East and Africa Gene Therapy Revenue (USD Million) By Region (2023-2030)
Figure 42 Middle East and Africa Gene Therapy Revenue (USD Million) By Region (2023-2030)
Figure 43 Middle East and Africa Gene Therapy Revenue (USD Million) By Type (2023-2030)
Figure 44 Middle East and Africa Gene Therapy Revenue (USD Million) By Applications (2023-2030)
Figure 45 Bottom-Up and Top-Down Approaches for This Report
Figure 46 Data Triangulation
