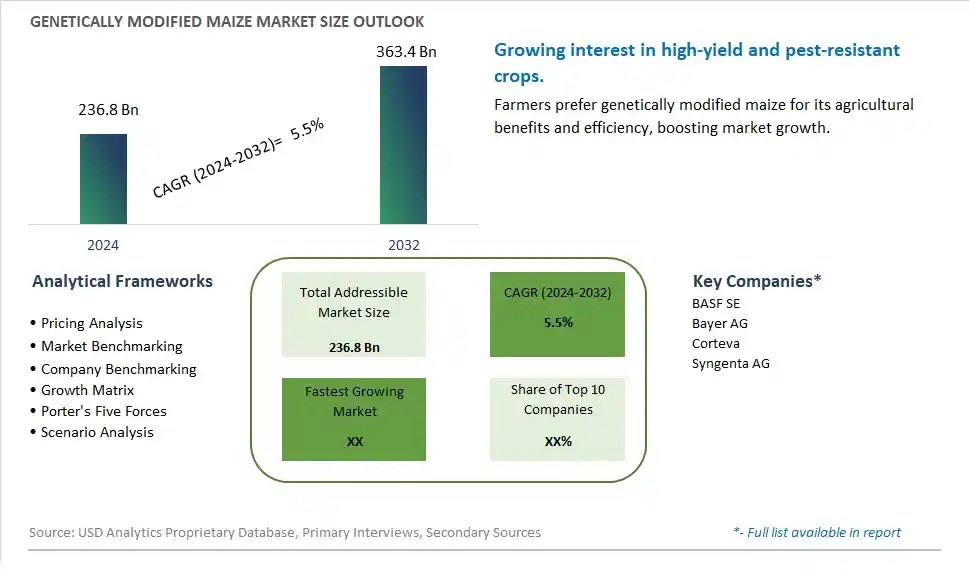
Global Genetically Modified Maize Market Size is valued at $236.8 Billion in 2024 and is forecast to register a growth rate (CAGR) of 5.5% to reach $363.4 Billion by 2032.
The global Genetically Modified Maize Market Comprehensive Study analyzes and forecasts the market size across 6 regions and 24 countries for diverse segments -By Type (Herbicide-Resistant Maize, Corn on the Cob, Sweet Corn, Drought-Resistant Maize, Maize with increased nutritional value), By Application (Farming, Food Retail, Processing Materials)
An Introduction to Genetically Modified Maize Market
In 2024, the Genetically Modified Maize market is thriving, fueled by the rising demand for high-yield and pest-resistant crops. Genetically modified (GM) maize, engineered for traits such as herbicide tolerance and insect resistance, is popular among farmers for its improved productivity and reduced input costs. The market benefits from advancements in genetic engineering and biotechnology, the growing trend of sustainable and efficient agriculture, and the expansion of the global food and feed sectors. Additionally, the increasing focus on food security and sustainable crop production is contributing to market growth.
Genetically Modified Maize Competitive Landscape
The market report analyses the leading companies in the industry including BASF SE, Bayer AG, Corteva, Syngenta AG, and Others.
Genetically Modified Maize Market Dynamics
Genetically Modified Maize Market Trend: Increasing Adoption of Biotech Crops for Enhanced Yield
The most prominent trend in the Genetically Modified Maize Market is the increasing adoption of biotech crops for enhanced yield. As agricultural productivity becomes a critical focus, genetically modified (GM) maize is gaining popularity for its ability to resist pests, tolerate herbicides, and improve crop yield. This trend is driven by the need to ensure food security and optimize agricultural output in the face of growing global demand.
Genetically Modified Maize Market Driver: Growth in Demand for High-Yield Crops
The key driver of the Genetically Modified Maize Market is the growth in demand for high-yield crops. As the global population continues to rise, there is a higher demand for crops that can provide greater yield and ensure a stable food supply. GM maize, with its enhanced resistance to environmental stressors and improved productivity, is increasingly used to meet this demand, driving market growth.
Genetically Modified Maize Market Opportunity: Expansion into Emerging Markets
A significant opportunity in the Genetically Modified Maize Market lies in the expansion into emerging markets. By promoting the benefits of GM maize and addressing regulatory concerns, companies can tap into new markets where food security is a pressing issue. Offering education and support to farmers in these regions can help increase adoption rates and drive market growth for GM maize.
Genetically Modified Maize Market Share Analysis: Herbicide-Resistant Maize segment generated the highest revenue share in the industry
Herbicide-Resistant Maize stands as the largest segment within the Genetically Modified Maize market. This segment's prominence stems from its widespread adoption in agricultural practices, particularly in regions facing challenges with weed management. Herbicide-resistant maize varieties are genetically modified to tolerate specific herbicides, allowing farmers to effectively control weeds while preserving crop yield and quality. The adoption of herbicide-resistant maize has surged due to its potential for enhanced productivity and cost-efficiency in weed control compared to conventional maize varieties. Further, these genetically modified crops contribute to sustainable agriculture by reducing the need for tillage, conserving soil moisture, and minimizing environmental impact from herbicide applications. As agricultural productivity demands increase globally amid climate uncertainties and evolving pest pressures, herbicide-resistant maize continues to be a pivotal choice for farmers seeking reliable crop protection solutions and sustainable farming practices.
Genetically Modified Maize Market Share Analysis: Food Retail is the fastest growing segment over the forecast period to 2032
The Food Retail segment is projected to be the fastest-growing application within the Genetically Modified Maize market through 2032. This growth is driven by increasing consumer demand for genetically modified maize-derived products in retail markets, including processed foods, snacks, and beverages. Genetically modified maize varieties, such as those with enhanced nutritional value or improved shelf life, are gaining traction among food manufacturers and retailers due to their potential to meet consumer preferences for healthier, sustainable, and convenient food options. Further, genetically modified maize plays a crucial role in ensuring food security by enhancing crop resilience to environmental stressors and pests, thereby supporting consistent food supply chains. As food retailers expand their offerings to cater to evolving dietary trends and consumer awareness about genetically modified organisms (GMOs), the Food Retail segment is poised for substantial growth. Manufacturers and retailers are to focus on transparency, regulatory compliance, and consumer education to capitalize on the opportunities presented by genetically modified maize in the food retail sector.
Genetically Modified Maize Market Segmentation
By Type
Herbicide-Resistant Maize
Corn on the Cob
Sweet Corn
Drought-Resistant Maize
Maize with increased nutritional value
By Application
Farming
Food Retail
Processing Materials
Countries Analyzed
North America (US, Canada, Mexico)
Europe (Germany, UK, France, Spain, Italy, Russia, Rest of Europe)
Asia Pacific (China, India, Japan, South Korea, Australia, South East Asia, Rest of Asia)
South America (Brazil, Argentina, Rest of South America)
Middle East and Africa (Saudi Arabia, UAE, Rest of Middle East, South Africa, Egypt, Rest of Africa)
Genetically Modified Maize Companies Profiled in the Study
BASF SE
Bayer AG
Corteva
Syngenta AG
*- List Not Exhaustive
Chapter 1. TABLE OF CONTENTS
Chapter 2. Introduction to Genetically Modified Maize Market
2.1. Market Overview
2.2. Key Statistics and Report Highlights
2.3. Scope of the Comprehensive Study
2.3.1. Market Definition
2.3.2 Countries and Regions Covered
2.3.3 Research Objective
2.3.4 Units, Currency, and Conversions
2.3.5 Industry Value Chain
2.4. Key Market Segments
2.5. Key Companies
2.6. Study Period
Chapter 3. Strategic Analysis Review
3.1. Genetically Modified Maize Pricing Analysis and Forecast
3.2. Porter’s Five Forces
3.3. Market Ecosystem
3.4. SWOT Analysis
3.5. Regulatory Scenario
3.3. Effects of Inflation, Russia-Ukraine War, moderating economic growth, and other macroeconomic factors
Chapter 4. Competitive Landscape
4.1. Market Share Analysis
4.1.1. Global Genetically Modified Maize Market Share by Company, 2023
4.1.2. Product Offerings of Leading Genetically Modified Maize Companies
4.2. Market Entropy
4.2.1. New Product Launches in the Industry
4.2.2. Mergers, Acquisitions, Joint ventures, and Partnerships
4.3. Key Strategies and Best Practices
Chapter 5. Global Market Projections: Best, Reference, and Low Case Scenarios
5.1. Growth Analysis- Case Scenario Definitions
5.2. Low Growth Case Scenario Forecasts
5.3. Reference Growth Case Scenario Forecasts
5.4. High Growth Case Scenario Forecasts
Chapter 6. Market Dynamics
6.1. Genetically Modified Maize Market Drivers
6.2. Genetically Modified Maize Market Challenges
6.6. Genetically Modified Maize Market Opportunities
6.4. Genetically Modified Maize Market Trends
Chapter 7. Global Genetically Modified Maize Market Outlook Trends
7.1. Global Genetically Modified Maize Revenue (USD Million) and CAGR (%) by Type (2021-2032)
7.2. Global Genetically Modified Maize Revenue (USD Million) and CAGR (%) by Application (2021-2032)
7.3. Global Genetically Modified Maize Revenue (USD Million) and CAGR (%) by Product (2021-2032)
By Type
Herbicide-Resistant Maize
Corn on the Cob
Sweet Corn
Drought-Resistant Maize
Maize with increased nutritional value
By Application
Farming
Food Retail
Processing Materials
Chapter 8. Global Genetically Modified Maize Regional Analysis and Outlook
8.1. Global Genetically Modified Maize Revenue (USD Million) By Regions (2021- 2032)
8.2. North America Genetically Modified Maize Revenue (USD Million) by Country (2021-2032)
8.2.1. United States Genetically Modified Maize Regional Analysis and Outlook
8.2.2. Canada Genetically Modified Maize Regional Analysis and Outlook
8.2.3. Mexico Genetically Modified Maize Regional Analysis and Outlook
8.3. Europe Genetically Modified Maize Revenue (USD Million), by Country (2021-2032)
8.3.1. Germany Genetically Modified Maize Regional Analysis and Outlook
8.3.2. France Genetically Modified Maize Regional Analysis and Outlook
8.3.3. United Kingdom Genetically Modified Maize Regional Analysis and Outlook
8.3.4. Spain Genetically Modified Maize Regional Analysis and Outlook
8.3.5. Italy Genetically Modified Maize Regional Analysis and Outlook
8.3.6. Russia Genetically Modified Maize Regional Analysis and Outlook
8.3.7. Rest of Europe Genetically Modified Maize Regional Analysis and Outlook
8.4. Asia Pacific Genetically Modified Maize Revenue (USD Million) by Country (2021-2032)
8.4.1. China Genetically Modified Maize Regional Analysis and Outlook
8.4.2. Japan Genetically Modified Maize Regional Analysis and Outlook
8.4.3. India Genetically Modified Maize Regional Analysis and Outlook
8.4.4. South Korea Genetically Modified Maize Regional Analysis and Outlook
8.4.5. Australia Genetically Modified Maize Regional Analysis and Outlook
8.4.6. South East Asia Genetically Modified Maize Regional Analysis and Outlook
8.4.7. Rest of Asia Pacific Genetically Modified Maize Regional Analysis and Outlook
8.5. South America Genetically Modified Maize Revenue (USD Million), by Country (2021-2032)
8.5.1. Brazil Genetically Modified Maize Regional Analysis and Outlook
8.5.2. Argentina Genetically Modified Maize Regional Analysis and Outlook
8.5.3. Rest of South America Genetically Modified Maize Regional Analysis and Outlook
8.6. Middle East and Africa Genetically Modified Maize Revenue (USD Million) by Country (2021-2032)
8.6.1. Middle East Genetically Modified Maize Regional Analysis and Outlook
8.6.2. Africa Genetically Modified Maize Regional Analysis and Outlook
Chapter 9. North America Genetically Modified Maize Analysis and Outlook
9.1. North America Genetically Modified Maize Revenue (USD Million) by Segments (2021-2032)
9.1.1. North America Genetically Modified Maize Revenue (USD Million) by Type (2021-2032)
9.1.2. North America Genetically Modified Maize Revenue (USD Million) by Application (2021-2032)
9.1.3. North America Genetically Modified Maize Revenue (USD Million) by Product (2021-2032)
By Type
Herbicide-Resistant Maize
Corn on the Cob
Sweet Corn
Drought-Resistant Maize
Maize with increased nutritional value
By Application
Farming
Food Retail
Processing Materials
Chapter 10. Europe Genetically Modified Maize Analysis and Outlook
10.1. Europe Genetically Modified Maize Revenue (USD Million), by Segments (USD Million) (2021-2032)
10.1.1. Europe Genetically Modified Maize Revenue (USD Million) by Type (2021-2032)
10.1.2. Europe Genetically Modified Maize Revenue (USD Million) by Application (2021-2032)
10.1.3. Europe Genetically Modified Maize Revenue (USD Million) by Product (2021-2032)
By Type
Herbicide-Resistant Maize
Corn on the Cob
Sweet Corn
Drought-Resistant Maize
Maize with increased nutritional value
By Application
Farming
Food Retail
Processing Materials
Chapter 11. Asia Pacific Genetically Modified Maize Analysis and Outlook
11.1. Asia Pacific Genetically Modified Maize Revenue (USD Million), and Revenue (USD Million) by Segments (2021-2032)
11.1.1. Asia Pacific Genetically Modified Maize Revenue (USD Million) by Type (2021-2032)
11.1.2. Asia Pacific Genetically Modified Maize Revenue (USD Million) by Application (2021-2032)
11.1.3. Asia Pacific Genetically Modified Maize Revenue (USD Million) by Product (2021-2032)
By Type
Herbicide-Resistant Maize
Corn on the Cob
Sweet Corn
Drought-Resistant Maize
Maize with increased nutritional value
By Application
Farming
Food Retail
Processing Materials
Chapter 12. South America Genetically Modified Maize Analysis and Outlook
12.1. South America Genetically Modified Maize Revenue (USD Million), by Segments (2021-2032)
12.1.1. South America Genetically Modified Maize Revenue (USD Million) by Type (2021-2032)
12.1.2. South America Genetically Modified Maize Revenue (USD Million) by Application (2021-2032)
12.1.3. South America Genetically Modified Maize Revenue (USD Million) by Product (2021-2032)
By Type
Herbicide-Resistant Maize
Corn on the Cob
Sweet Corn
Drought-Resistant Maize
Maize with increased nutritional value
By Application
Farming
Food Retail
Processing Materials
Chapter 13. Middle East and Africa Genetically Modified Maize Analysis and Outlook
13.1. Middle East and Africa Genetically Modified Maize Revenue (USD Million), by Segments (2021-2032)
13.1.1. Middle East and Africa Genetically Modified Maize Revenue (USD Million) by Type (2021-2032)
13.1.2. Middle East and Africa Genetically Modified Maize Revenue (USD Million) by Application (2021-2032)
13.1.3. Middle East and Africa Genetically Modified Maize Revenue (USD Million) by Product (2021-2032)
By Type
Herbicide-Resistant Maize
Corn on the Cob
Sweet Corn
Drought-Resistant Maize
Maize with increased nutritional value
By Application
Farming
Food Retail
Processing Materials
Chapter 14. Genetically Modified Maize Company Profiles
14.1 Business Overview
14.2 Product Profiles
14.3 SWOT Profiles
14.5 Recent Developments
14.6 Financial Profile
List of Companies
BASF SE
Bayer AG
Corteva
Syngenta AG
15. Methodology and Data Sources
15.1 Customization Offerings
15.2 Subscription Services
15.3 Related Reports
15.4 Publisher Expertise
LIST OF TABLES
Table 1 Market Segmentation Analysis
Table 2 Global Genetically Modified Maize Market Share of Leading Companies, 2023
Table 3 Product Offerings of Leading Companies
Table 4 Low Growth Scenario Forecasts
Table 5 Reference Case Growth Scenario
Table 6 High Growth Case Scenario
Table 7 Global Genetically Modified Maize Revenue (USD Million) And CAGR (%) By Type (2021-2032)
Table 8 Global Genetically Modified Maize Revenue (USD Million) And CAGR (%) By Application (2021-2032)
Table 9 Global Genetically Modified Maize Revenue (USD Million) And CAGR (%) By Product (2021-2032)
Table 10 Global Genetically Modified Maize Market Revenue (USD Million) By Regions (2021-2032)
Table 11 Global Genetically Modified Maize Market Share (%) By Regions (2021-2032)
Table 12 North America Genetically Modified Maize Revenue (USD Million) By Country (2021-2032)
Table 13 Europe Genetically Modified Maize Revenue (USD Million) By Country (2021-2032)
Table 14 Asia Pacific Genetically Modified Maize Revenue (USD Million) By Country (2021-2032)
Table 15 South America Genetically Modified Maize Revenue (USD Million) By Country (2021-2032)
Table 16 Middle East and Africa Genetically Modified Maize Revenue (USD Million) By Region (2021-2032)
Table 17 North America Genetically Modified Maize Revenue (USD Million) By Type (2021-2032)
Table 18 North America Genetically Modified Maize Revenue (USD Million) By Application (2021-2032)
Table 19 North America Genetically Modified Maize Revenue (USD Million) By Product (2021-2032)
Table 20 Europe Genetically Modified Maize Revenue (USD Million) By Type (2021-2032)
Table 21 Europe Genetically Modified Maize Revenue (USD Million) By Application (2021-2032)
Table 22 Europe Genetically Modified Maize Revenue (USD Million) By Product (2021-2032)
Table 23 Asia Pacific Genetically Modified Maize Revenue (USD Million) By Type (2021-2032)
Table 24 Asia Pacific Genetically Modified Maize Revenue (USD Million) By Application (2021-2032)
Table 25 Asia Pacific Genetically Modified Maize Revenue (USD Million) By Product (2021-2032)
Table 26 South America Genetically Modified Maize Revenue (USD Million) By Type (2021-2032)
Table 27 South America Genetically Modified Maize Revenue (USD Million) By Application (2021-2032)
Table 28 South America Genetically Modified Maize Revenue (USD Million) By Product (2021-2032)
Table 29 Middle East and Africa Genetically Modified Maize Revenue (USD Million) By Type (2021-2032)
Table 30 Middle East and Africa Genetically Modified Maize Revenue (USD Million) By Application (2021-2032)
Table 31 Middle East and Africa Genetically Modified Maize Revenue (USD Million) By Product (2021-2032)
LIST OF FIGURES
Figure 1. Market Scope
Figure 2. Pricing Forecasts Per Unit, 2023- 2032
Figure 3. Porter’s Five Forces
Figure 4. Global Genetically Modified Maize Market Revenue (USD Million) By Regions (2021-2032)
Figure 5. Global Genetically Modified Maize Market Share (%) By Regions (2023)
Figure 6. North America Genetically Modified Maize Revenue (USD Million) By Country (2021-2032)
Figure 7. United States Genetically Modified Maize Revenue (USD Million) By Country (2021-2032)
Figure 8. Canada Genetically Modified Maize Revenue (USD Million) By Country (2021-2032)
Figure 9. Mexico Genetically Modified Maize Revenue (USD Million) By Country (2021-2032)
Figure 10. Europe Genetically Modified Maize Revenue (USD Million) By Country (2021-2032)
Figure 11. Germany Genetically Modified Maize Revenue (USD Million) By Country (2021-2032)
Figure 12. France Genetically Modified Maize Revenue (USD Million) By Country (2021-2032)
Figure 13. United Kingdom Genetically Modified Maize Revenue (USD Million) By Country (2021-2032)
Figure 14. Spain Genetically Modified Maize Revenue (USD Million) By Country (2021-2032)
Figure 15. Italy Genetically Modified Maize Revenue (USD Million) By Country (2021-2032)
Figure 16. Russia Genetically Modified Maize Revenue (USD Million) By Country (2021-2032)
Figure 17. Rest of Europe Genetically Modified Maize Revenue (USD Million) By Country (2021-2032)
Figure 11. Asia Pacific Genetically Modified Maize Revenue (USD Million) By Country (2021-2032)
Figure 12. China Genetically Modified Maize Revenue (USD Million) By Country (2021-2032)
Figure 13. Japan Genetically Modified Maize Revenue (USD Million) By Country (2021-2032)
Figure 14. India Genetically Modified Maize Revenue (USD Million) By Country (2021-2032)
Figure 15. South Korea Genetically Modified Maize Revenue (USD Million) By Country (2021-2032)
Figure 16. Australia Genetically Modified Maize Revenue (USD Million) By Country (2021-2032)
Figure 17. South East Asia Genetically Modified Maize Revenue (USD Million) By Country (2021-2032)
Figure 18. South America Genetically Modified Maize Revenue (USD Million) By Country (2021-2032)
Figure 19. Brazil Genetically Modified Maize Revenue (USD Million) By Country (2021-2032)
Figure 20. Argentina Genetically Modified Maize Revenue (USD Million) By Country (2021-2032)
Figure 21. Rest of Asia Pacific Genetically Modified Maize Revenue (USD Million) By Country (2021-2032)
Figure 22. Middle East and Africa Genetically Modified Maize Revenue (USD Million) By Region (2021-2032)
Figure 23. Saudi Arabia Genetically Modified Maize Revenue (USD Million) By Region (2021-2032)
Figure 24. The UAE Genetically Modified Maize Revenue (USD Million) By Region (2021-2032)
Figure 25. Rest of Middle East Genetically Modified Maize Revenue (USD Million) By Region (2021-2032)
Figure 26. South Africa Genetically Modified Maize Revenue (USD Million) By Region (2021-2032)
Figure 27. Africa Genetically Modified Maize Revenue (USD Million) By Region (2021-2032)
Figure 28. North America Genetically Modified Maize Revenue (USD Million) By Type (2021-2032)
Figure 29. North America Genetically Modified Maize Revenue (USD Million) By Application (2021-2032)
Figure 30. North America Genetically Modified Maize Revenue (USD Million) By Product (2021-2032)
Figure 31. Europe Genetically Modified Maize Revenue (USD Million) By Type (2021-2032)
Figure 32. Europe Genetically Modified Maize Revenue (USD Million) By Application (2021-2032)
Figure 33. Europe Genetically Modified Maize Revenue (USD Million) By Product (2021-2032)
Figure 34. Asia Pacific Genetically Modified Maize Revenue (USD Million) By Type (2021-2032)
Figure 35. Asia Pacific Genetically Modified Maize Revenue (USD Million) By Application (2021-2032)
Figure 36. Asia Pacific Genetically Modified Maize Revenue (USD Million) By Product (2021-2032)
Figure 37. South America Genetically Modified Maize Revenue (USD Million) By Type (2021-2032)
Figure 38. South America Genetically Modified Maize Revenue (USD Million) By Application (2021-2032)
Figure 39. South America Genetically Modified Maize Revenue (USD Million) By Product (2021-2032)
Figure 40. Middle East and Africa Genetically Modified Maize Revenue (USD Million) By Type (2021-2032)
Figure 41. Middle East and Africa Genetically Modified Maize Revenue (USD Million) By Application (2021-2032)
Figure 42. Middle East and Africa Genetically Modified Maize Revenue (USD Million) By Product (2021-2032)
By Type
Herbicide-Resistant Maize
Corn on the Cob
Sweet Corn
Drought-Resistant Maize
Maize with increased nutritional value
By Application
Farming
Food Retail
Processing Materials
Countries Analyzed
North America (US, Canada, Mexico)
Europe (Germany, UK, France, Spain, Italy, Russia, Rest of Europe)
Asia Pacific (China, India, Japan, South Korea, Australia, South East Asia, Rest of Asia)
South America (Brazil, Argentina, Rest of South America)
Middle East and Africa (Saudi Arabia, UAE, Rest of Middle East, South Africa, Egypt, Rest of Africa)
