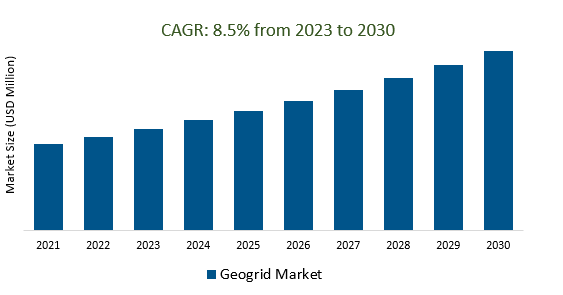
The Geogrid Market Size is estimated to register 8.5% growth over the forecast period from 2023 to 2030.
Geogrid Market Overview
The increasing infrastructure development activities across the globe in the construction of roads, highways, railways, and other civil engineering projects for soil reinforcement, stabilization, and erosion control purposes are the prime factors. Environmental concerns such as soil erosion, landslides, and the need for effective soil management are augmenting the usage of geogrids in environmental protection applications. Manufacturers are focussing on developing high-quality, durable, and cost-effective geogrids by leveraging advancements in material sciences and manufacturing technologies. New applications beyond traditional construction, such as in landscaping, mining, and agricultural sectors are driving the market. Additionally, Manufacturers are focusing on innovative product formulations, improved materials, and enhanced design methodologies to meet the stringent requirements of construction and infrastructure projects.
Geogrid Market Dynamics
Market Trends- Geogrid Market innovates product types for varied engineering needs and expands applications across non-traditional sectors.
Diversification, highlighting the adaptability and versatility of geogrids, demonstrating their efficacy in addressing diverse challenges across various industries are propelling the demand.
Manufacturers are innovating to create geogrids with varying strengths, materials, and designs, optimizing them for distinct purposes such as soil reinforcement, slope stabilization, erosion control, and subgrade improvement.
Further, Geogrids are increasingly finding relevance in non-conventional sectors like mining, landscaping, agriculture, and coastal protection.
Market Driver- Geogrid Market responds to environmental concerns, supporting sustainability with erosion control solutions driving the market.
The escalating global focus on environmental conservation, coupled with the imperative to adopt sustainable practices are significantly influencing the increased demand.
Mitigating environmental degradation by offering solutions for soil erosion control, slope reinforcement, and sedimentation management, thereby supporting ecological conservation efforts are propelling the market.
Government regulations emphasizing the use of geosynthetic materials, including geogrids, in infrastructure projects are further bolstering the market demand.
Market Opportunity- Digitalization and emergence of smart geogrids reshape the Geogrid Market.
Smart geogrids, utilizing sensors, data analytics, and real-time monitoring capabilities to provide comprehensive insights into soil conditions, stability, and structural performance are fueling the market growth.
Additionally, the data collected from smart geogrids facilitates informed decision-making in construction, ensuring optimized design and resource allocation contributing to market expansion.
Minimizing environmental impact by optimizing construction processes, reducing material wastage, and enhancing the overall lifecycle management of infrastructure projects are further fueling the demand.
Market Share Analysis- Polypropylene will register the fastest growth
The Geogrid Market is analyzed across Polyethylene, Polypropylene, Polyester and Others. Polypropylene is poised to register the fastest growth. As a material, polypropylene offers several key advantages, including high tensile strength, durability, and resistance to chemical and biological degradation. These properties make polypropylene geogrids highly suitable for soil reinforcement and stabilization in civil engineering and construction projects. Polypropylene geogrids are widely utilized in various applications such as road construction, railway stabilization, soil erosion control, and retaining wall reinforcement. In road construction, they are commonly employed to enhance the structural integrity of pavements by providing reinforcement and distributing load-bearing stresses. These geogrids effectively reduce rutting and cracking, thereby prolonging the lifespan of roadways and enhancing their performance. Additionally, in soil reinforcement applications, polypropylene geogrids offer excellent soil confinement and stability, making them valuable for slope reinforcement, embankment stabilization, and erosion control.
Market Share Analysis- Road Construction held a significant market share in 2023
The Geogrid Market is analyzed across various applications including Road Construction, Soil Reinforcement, Railroad Stabilization and Others. Of these, Road Construction held a significant market share in 2023. Geogrids are extensively used in various phases of road construction, including subgrade stabilization, base reinforcement, and pavement improvement. These materials are integrated into road construction projects to address challenges associated with soil instability, weak subgrades, and the need for increased load-bearing capacity. They distribute loads efficiently, reduce lateral movement, and improve the overall strength of the road surface. By providing reinforcement to the soil layers, geogrids minimize rutting, cracking, and deformation in pavements, thereby enhancing their durability and performance. Additionally, they mitigate reflective cracking, a common issue where cracks in old pavement layers reappear in new overlays, by distributing stresses and inhibiting crack propagation. Moreover, geogrids aid in reducing the thickness of road construction materials required, optimizing resources and construction costs while maintaining or improving the structural integrity of the road.
Geogrid Market News
Tensar Introduces Next-Generation Geogrid and Innovative Design Solutions.
Strata Launches Wide Flexible StrataGrid™ Geogrid for Enhanced Applications.
HUESKER Group Unveils ecoLine Version of Fortrac T Geogrid, crafted from 100% Recycled Polyester Yarns, for Reinforced Soil Structures.
Geogrid Market Segmentation
By Material
- Polyethylene
- Polypropylene
- Polyester
- Others
By Application
- Road Construction
- Soil Reinforcement
- Railroad Stabilization
- Others
By Region
- North America (United States, Canada, Mexico)
- Europe (Germany, France, United Kingdom, Spain, Italy, Others)
- Asia Pacific (China, India, Japan, South Korea, Australia, Others)
- Latin America (Brazil, Argentina, Others)
- Middle East and Africa (Saudi Arabia, UAE, Kuwait, Other Middle East, South Africa, Nigeria, Other Africa)
Geogrid Market Companies
- Hebei Tigergrid Geosynthetics Company
- HUESKER
- NAUE GmbH & Co KG
- Officine Maccaferri Spa
- Pietrucha Group
- TECHFABINDIA
- TENAX SPA
- TenCate Geosynthetics Asia Sdn Bhd
- Tensar International Corporation
- Titan Environmental Containment
*List not exhaustive
Geogrid Market Outlook 2023
1 Market Overview
1.1 Introduction to the Geogrid Market
1.2 Scope of the Study
1.3 Research Objective
1.3.1 Key Market Scope and Segments
1.3.2 Players Covered
1.3.3 Years Considered
2 Executive Summary
2.1 2023 Geogrid Industry- Market Statistics
3 Market Dynamics
3.1 Market Drivers
3.2 Market Challenges
3.3 Market Opportunities
3.4 Market Trends
4 Market Factor Analysis
4.1 Porter’s Five Forces
4.2 Market Entropy
4.2.1 Global Geogrid Market Companies with Area Served
4.2.2 Products Offerings Global Geogrid Market
5 COVID-19 Impact Analysis and Outlook Scenarios
5.1.1 Covid-19 Impact Analysis
5.1.2 Post-COVID-19 Scenario- Low Growth Case
5.1.3 Post-COVID-19 Scenario- Reference Growth Case
5.1.4 Post-COVID-19 Scenario- Low Growth Case
6 Global Geogrid Market Trends
6.1 Global Geogrid Revenue (USD Million) and CAGR (%) by Type (2018-2030)
6.2 Global Geogrid Revenue (USD Million) and CAGR (%) by Applications (2018-2030)
6.3 Global Geogrid Revenue (USD Million) and CAGR (%) by Regions (2018-2030)
7 Global Geogrid Market Revenue (USD Million) by Type, and Applications (2018-2022)
7.1 Global Geogrid Revenue (USD Million) by Type (2018-2022)
7.1.1 Global Geogrid Revenue (USD Million), Market Share (%) by Type (2018-2022)
7.2 Global Geogrid Revenue (USD Million) by Applications (2018-2022)
7.2.1 Global Geogrid Revenue (USD Million), Market Share (%) by Applications (2018-2022)
8 Global Geogrid Development Regional Status and Outlook
8.1 Global Geogrid Revenue (USD Million) By Regions (2018-2022)
8.2 North America Geogrid Revenue (USD Million) by Type, and Application (2018-2022)
8.2.1 North America Geogrid Revenue (USD Million) by Country (2018-2022)
8.2.2 North America Geogrid Revenue (USD Million) by Type (2018-2022)
8.2.3 North America Geogrid Revenue (USD Million) by Applications (2018-2022)
8.3 Europe Geogrid Revenue (USD Million), by Type, and Applications (USD Million) (2018-2022)
8.3.1 Europe Geogrid Revenue (USD Million), by Country (2018-2022)
8.3.2 Europe Geogrid Revenue (USD Million) by Type (2018-2022)
8.3.3 Europe Geogrid Revenue (USD Million) by Applications (2018-2022)
8.4 Asia Pacific Geogrid Revenue (USD Million), and Revenue (USD Million) by Type, and Applications (2018-2022)
8.4.1 Asia Pacific Geogrid Revenue (USD Million) by Country (2018-2022)
8.4.2 Asia Pacific Geogrid Revenue (USD Million) by Type (2018-2022)
8.4.3 Asia Pacific Geogrid Revenue (USD Million) by Applications (2018-2022)
8.5 South America Geogrid Revenue (USD Million), by Type, and Applications (2018-2022)
8.5.1 South America Geogrid Revenue (USD Million), by Country (2018-2022)
8.5.2 South America Geogrid Revenue (USD Million) by Type (2018-2022)
8.5.3 South America Geogrid Revenue (USD Million) by Applications (2018-2022)
8.6 Middle East and Africa Geogrid Revenue (USD Million), by Type, Technology, Application, Thickness (2018-2022)
8.6.1 Middle East and Africa Geogrid Revenue (USD Million) by Country (2018-2022)
8.6.2 Middle East and Africa Geogrid Revenue (USD Million) by Type (2018-2022)
8.6.3 Middle East and Africa Geogrid Revenue (USD Million) by Applications (2018-2022)
9 Company Profiles
10 Global Geogrid Market Revenue (USD Million), by Type, and Applications (2023-2030)
10.1 Global Geogrid Revenue (USD Million) and Market Share (%) by Type (2023-2030)
10.1.1 Global Geogrid Revenue (USD Million), and Market Share (%) by Type (2023-2030)
10.2 Global Geogrid Revenue (USD Million) and Market Share (%) by Applications (2023-2030)
10.2.1 Global Geogrid Revenue (USD Million), and Market Share (%) by Applications (2023-2030)
11 Global Geogrid Development Regional Status and Outlook Forecast
11.1 Global Geogrid Revenue (USD Million) By Regions (2023-2030)
11.2 North America Geogrid Revenue (USD Million) by Type, and Applications (2023-2030)
11.2.1 North America Geogrid Revenue (USD) Million by Country (2023-2030)
11.2.2 North America Geogrid Revenue (USD Million), by Type (2023-2030)
11.2.3 North America Geogrid Revenue (USD Million), Market Share (%) by Applications (2023-2030)
11.3 Europe Geogrid Revenue (USD Million), by Type, and Applications (2023-2030)
11.3.1 Europe Geogrid Revenue (USD Million), by Country (2023-2030)
11.3.2 Europe Geogrid Revenue (USD Million), by Type (2023-2030)
11.3.3 Europe Geogrid Revenue (USD Million), by Applications (2023-2030)
11.4 Asia Pacific Geogrid Revenue (USD Million) by Type, and Applications (2023-2030)
11.4.1 Asia Pacific Geogrid Revenue (USD Million), by Country (2023-2030)
11.4.2 Asia Pacific Geogrid Revenue (USD Million), by Type (2023-2030)
11.4.3 Asia Pacific Geogrid Revenue (USD Million), by Applications (2023-2030)
11.5 South America Geogrid Revenue (USD Million), by Type, and Applications (2023-2030)
11.5.1 South America Geogrid Revenue (USD Million), by Country (2023-2030)
11.5.2 South America Geogrid Revenue (USD Million), by Type (2023-2030)
11.5.3 South America Geogrid Revenue (USD Million), by Applications (2023-2030)
11.6 Middle East and Africa Geogrid Revenue (USD Million), by Type, and Applications (2023-2030)
11.6.1 Middle East and Africa Geogrid Revenue (USD Million), by Region (2023-2030)
11.6.2 Middle East and Africa Geogrid Revenue (USD Million), by Type (2023-2030)
11.6.3 Middle East and Africa Geogrid Revenue (USD Million), by Applications (2023-2030)
12 Methodology and Data Sources
12.1 Methodology/Research Approach
12.1.1 Research Programs/Design
12.1.2 Market Size Estimation
12.1.3 Market Breakdown and Data Triangulation
12.2 Data Sources
12.2.1 Secondary Sources
12.2.2 Primary Sources
12.3 Disclaimer
List of Tables
Table 1 Market Segmentation Analysis
Table 2 Global Geogrid Market Companies with Areas Served
Table 3 Products Offerings Global Geogrid Market
Table 4 Low Growth Scenario Forecasts
Table 5 Reference Case Growth Scenario
Table 6 High Growth Case Scenario
Table 7 Global Geogrid Revenue (USD Million) And CAGR (%) By Type (2018-2030)
Table 8 Global Geogrid Revenue (USD Million) And CAGR (%) By Applications (2018-2030)
Table 9 Global Geogrid Revenue (USD Million) And CAGR (%) By Regions (2018-2030)
Table 10 Global Geogrid Revenue (USD Million) By Type (2018-2022)
Table 11 Global Geogrid Revenue Market Share (%) By Type (2018-2022)
Table 12 Global Geogrid Revenue (USD Million) By Applications (2018-2022)
Table 13 Global Geogrid Revenue Market Share (%) By Applications (2018-2022)
Table 14 Global Geogrid Market Revenue (USD Million) By Regions (2018-2022)
Table 15 Global Geogrid Market Share (%) By Regions (2018-2022)
Table 16 North America Geogrid Revenue (USD Million) By Country (2018-2022)
Table 17 North America Geogrid Revenue (USD Million) By Type (2018-2022)
Table 18 North America Geogrid Revenue (USD Million) By Applications (2018-2022)
Table 19 Europe Geogrid Revenue (USD Million) By Country (2018-2022)
Table 20 Europe Geogrid Revenue (USD Million) By Type (2018-2022)
Table 21 Europe Geogrid Revenue (USD Million) By Applications (2018-2022)
Table 22 Asia Pacific Geogrid Revenue (USD Million) By Country (2018-2022)
Table 23 Asia Pacific Geogrid Revenue (USD Million) By Type (2018-2022)
Table 24 Asia Pacific Geogrid Revenue (USD Million) By Applications (2018-2022)
Table 25 South America Geogrid Revenue (USD Million) By Country (2018-2022)
Table 26 South America Geogrid Revenue (USD Million) By Type (2018-2022)
Table 27 South America Geogrid Revenue (USD Million) By Applications (2018-2022)
Table 28 Middle East and Africa Geogrid Revenue (USD Million) By Region (2018-2022)
Table 29 Middle East and Africa Geogrid Revenue (USD Million) By Type (2018-2022)
Table 30 Middle East and Africa Geogrid Revenue (USD Million) By Applications (2018-2022)
Table 31 Financial Analysis
Table 32 Global Geogrid Revenue (USD Million) By Type (2023-2030)
Table 33 Global Geogrid Revenue Market Share (%) By Type (2023-2030)
Table 34 Global Geogrid Revenue (USD Million) By Applications (2023-2030)
Table 35 Global Geogrid Revenue Market Share (%) By Applications (2023-2030)
Table 36 Global Geogrid Market Revenue (USD Million), And Revenue (USD Million) By Regions (2023-2030)
Table 37 North America Geogrid Revenue (USD)By Country (2023-2030)
Table 38 North America Geogrid Revenue (USD Million) By Type (2023-2030)
Table 39 North America Geogrid Revenue (USD Million) By Applications (2023-2030)
Table 40 Europe Geogrid Revenue (USD Million) By Country (2023-2030)
Table 41 Europe Geogrid Revenue (USD Million) By Type (2023-2030)
Table 42 Europe Geogrid Revenue (USD Million) By Applications (2023-2030)
Table 43 Asia Pacific Geogrid Revenue (USD Million) By Country (2023-2030)
Table 44 Asia Pacific Geogrid Revenue (USD Million) By Type (2023-2030)
Table 45 Asia Pacific Geogrid Revenue (USD Million) By Applications (2023-2030)
Table 46 South America Geogrid Revenue (USD Million) By Country (2023-2030)
Table 47 South America Geogrid Revenue (USD Million) By Type (2023-2030)
Table 48 South America Geogrid Revenue (USD Million) By Applications (2023-2030)
Table 49 Middle East and Africa Geogrid Revenue (USD Million) By Region (2023-2030)
Table 50 Middle East and Africa Geogrid Revenue (USD Million) By Region (2023-2030)
Table 51 Middle East and Africa Geogrid Revenue (USD Million) By Type (2023-2030)
Table 52 Middle East and Africa Geogrid Revenue (USD Million) By Applications (2023-2030)
Table 53 Research Programs/Design for This Report
Table 54 Key Data Information from Secondary Sources
Table 55 Key Data Information from Primary Sources
List of Figures
Figure 1 Market Scope
Figure 2 Porter’s Five Forces
Figure 3 Global Geogrid Revenue (USD Million) By Type (2018-2022)
Figure 4 Global Geogrid Revenue Market Share (%) By Type (2022)
Figure 5 Global Geogrid Revenue (USD Million) By Applications (2018-2022)
Figure 6 Global Geogrid Revenue Market Share (%) By Applications (2022)
Figure 7 Global Geogrid Market Revenue (USD Million) By Regions (2018-2022)
Figure 8 Global Geogrid Market Share (%) By Regions (2022)
Figure 9 North America Geogrid Revenue (USD Million) By Country (2018-2022)
Figure 10 North America Geogrid Revenue (USD Million) By Type (2018-2022)
Figure 11 North America Geogrid Revenue (USD Million) By Applications (2018-2022)
Figure 12 Europe Geogrid Revenue (USD Million) By Country (2018-2022)
Figure 13 Europe Geogrid Revenue (USD Million) By Type (2018-2022)
Figure 14 Europe Geogrid Revenue (USD Million) By Applications (2018-2022)
Figure 15 Asia Pacific Geogrid Revenue (USD Million) By Country (2018-2022)
Figure 16 Asia Pacific Geogrid Revenue (USD Million) By Type (2018-2022)
Figure 17 Asia Pacific Geogrid Revenue (USD Million) By Applications (2018-2022)
Figure 18 South America Geogrid Revenue (USD Million) By Country (2018-2022)
Figure 19 South America Geogrid Revenue (USD Million) By Type (2018-2022)
Figure 20 South America Geogrid Revenue (USD Million) By Applications (2018-2022)
Figure 21 Middle East and Africa Geogrid Revenue (USD Million) By Region (2018-2022)
Figure 22 Middle East and Africa Geogrid Revenue (USD Million) By Type (2018-2022)
Figure 23 Middle East and Africa Geogrid Revenue (USD Million) By Applications (2018-2022)
Figure 24 Global Geogrid Revenue (USD Million) By Type (2023-2030)
Figure 25 Global Geogrid Revenue Market Share (%) By Type (2030)
Figure 26 Global Geogrid Revenue (USD Million) By Applications (2023-2030)
Figure 27 Global Geogrid Revenue Market Share (%) By Applications (2030)
Figure 28 Global Geogrid Market Revenue (USD Million) By Regions (2023-2030)
Figure 29 North America Geogrid Revenue (USD Million) By Country (2023-2030)
Figure 30 North America Geogrid Revenue (USD Million) By Type (2023-2030)
Figure 31 North America Geogrid Revenue (USD Million) By Applications (2023-2030)
Figure 32 Europe Geogrid Revenue (USD Million) By Country (2023-2030)
Figure 33 Europe Geogrid Revenue (USD Million) By Type (2023-2030)
Figure 34 Europe Geogrid Revenue (USD Million) By Applications (2023-2030)
Figure 35 Asia Pacific Geogrid Revenue (USD Million) By Country (2023-2030)
Figure 36 Asia Pacific Geogrid Revenue (USD Million) By Type (2023-2030)
Figure 37 Asia Pacific Geogrid Revenue (USD Million) By Applications (2023-2030)
Figure 38 South America Geogrid Revenue (USD Million) By Country (2023-2030)
Figure 39 South America Geogrid Revenue (USD Million) By Type (2023-2030)
Figure 40 South America Geogrid Revenue (USD Million) By Applications (2023-2030)
Figure 41 Middle East and Africa Geogrid Revenue (USD Million) By Region (2023-2030)
Figure 42 Middle East and Africa Geogrid Revenue (USD Million) By Region (2023-2030)
Figure 43 Middle East and Africa Geogrid Revenue (USD Million) By Type (2023-2030)
Figure 44 Middle East and Africa Geogrid Revenue (USD Million) By Applications (2023-2030)
Figure 45 Bottom-Up and Top-Down Approaches For This Report
Figure 46 Data Triangulation
