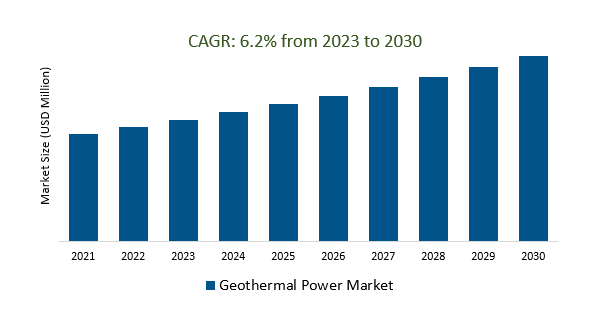
The Global Geothermal Power Market is estimated to register 6.2% growth over the forecast period from 2023 to 2030.
The Geothermal Power Market has seen significant growth and transformation in recent years due to various factors and trends. Key drivers include the renewable energy transition, the stability and reliability of geothermal power, its low greenhouse gas emissions, its energy security, technological advancements, and market competitiveness. The market is expanding beyond traditional hotspots like Iceland, the United States, and the Philippines, with new projects being developed in regions with untapped geothermal potential. Hybrid power plants, energy storage integration, and geothermal heating and cooling are also gaining popularity. Environmental considerations are also growing, with a focus on managing geothermal fluids, reinjection of water, and mitigation of subsurface effects. Geothermal power can be harnessed in oil and gas fields to improve energy efficiency and reduce emissions. Public and private investments in research, development, and infrastructure are driving innovation and growth in the industry.
Geothermal Power as The Stable and Reliable Energy Source is boosting the market.
Geothermal power, hailed as a stable and reliable energy source, is experiencing a significant surge in the energy market. This growth is primarily attributed to its unique advantage of round-the-clock availability, making it less susceptible to weather-related disruptions that often affect solar and wind energy. Moreover, geothermal power plants have a longer operational lifespan compared to many other renewable sources, ensuring consistent energy production for decades. As the world increasingly seeks sustainable alternatives to fossil fuels, the geothermal power market is attracting substantial investment and innovation, promising a greener and more dependable energy future. This upward trend aligns with global efforts to reduce carbon emissions and combat climate change, positioning geothermal energy as a critical player in the transition to cleaner and more sustainable energy systems.
Geothermal Hybrid Power Plants Boosting Renewable Energy Consistency and Flexibility which helps in attracting a wide customer base.
Geothermal hybrid power plants represent a groundbreaking advancement in the renewable energy sector. By integrating geothermal energy with other renewable sources like solar or wind, these innovative facilities enhance energy consistency and flexibility. This synergy ensures a continuous and reliable power supply, making geothermal energy a more attractive option for a diverse range of customers in the rapidly growing geothermal power market. This approach not only reduces dependence on fossil fuels but also addresses the intermittent nature of some renewable sources, ultimately bolstering the appeal and feasibility of geothermal power solutions. As a result, these hybrid power plants play a pivotal role in expanding the reach and impact of sustainable energy generation.
Geothermal Power as A Sustainable Solution with Low Greenhouse Gas Emissions.
Geothermal power is emerging as a highly sustainable and eco-friendly solution in the ever-evolving energy landscape. This renewable energy source taps into the Earth's natural heat reservoirs to generate electricity, offering several advantages. One of its key strengths is its minimal greenhouse gas emissions, as it produces significantly fewer carbon emissions compared to fossil fuels. Geothermal power plants have a small environmental footprint and operate around the clock, providing a consistent source of clean energy. As the world seeks alternatives to reduce its carbon footprint and combat climate change, geothermal power is gaining prominence in the global energy market, showcasing its potential to play a pivotal role in a more sustainable and greener future.
Flash steam is the most dominant power station type in the geothermal power market.
Flash steam power stations play a pivotal and dominant role within the geothermal power market. These power stations harness the Earth's internal heat by tapping into high-temperature underground reservoirs of hot water or steam. The dominance of flash steam technology is attributed to its efficiency and widespread applicability. When the geothermal fluid, usually at high pressure and temperature, is released to lower pressure through a separator, it undergoes a rapid phase change, resulting in the production of steam. This high-pressure steam is then used to drive turbines connected to generators, producing electricity. Flash steam power stations are particularly efficient in converting geothermal energy into electrical power, making them an economically attractive choice for harnessing the Earth's heat. Moreover, the technology is adaptable to various geothermal resources, making it a versatile option for geothermal power generation around the world. Its dominance highlights its critical role in providing clean, sustainable energy while reducing greenhouse gas emissions and contributing to a greener energy mix.
Industrial is the most dominant application in the geothermal power market.
The dominance of the industrial sector in the geothermal power market can be attributed to several key factors. Firstly, there is a significant demand for geothermal energy in industrial applications, particularly for heating and cooling purposes. This is further bolstered by the increasing adoption of geothermal energy in various industrial processes, such as food processing and papermaking, where it offers efficient and sustainable energy solutions. Additionally, the appeal of geothermal energy has been on the rise in emerging economies, contributing to its prevalence in the industrial sector. Some notable industrial applications of geothermal energy encompass food processing, papermaking, textile processing, chemical production, and metal processing, where it serves to power equipment and facilitate essential processes with its reliable and eco-friendly attributes.
Asia Pacific is emerging as the dominant region in the global geothermal power market.
The rising demand for electricity in the region, coupled with favorable government policies and incentives that encourage geothermal power development, plays a pivotal role in this growth. Moreover, Asia Pacific boasts abundant geothermal resources, further fuelling the industry's expansion. Key markets in the region, including Indonesia, the Philippines, China, and Japan, are capitalizing on their substantial geothermal potential by implementing supportive policies and incentives to drive the adoption and growth of geothermal power as a sustainable energy source.
Geothermal Power Market Segmentation
By Power Station Type
- Dry Steam
- Flash Steam
- Binary Cycle
By Application
- Industrial
- Commercial
- Residential
By Region
- North America (United States, Canada, Mexico)
- Europe (Germany, France, United Kingdom, Spain, Italy, Others)
- Asia Pacific (China, India, Japan, South Korea, Australia, Others)
- Latin America (Brazil, Argentina, Others)
- Middle East and Africa (Saudi Arabia, UAE, Kuwait, Other Middle East, South Africa, Nigeria, Other Africa)
Geothermal Power Market Companies
- Mitsubishi Hitachi Power Systems Inc
- Enel Green Power
- General Electric
- Ormat Technologies Inc
- Toshiba Energy Systems & Solutions Corporation
- Fuji Electric Co. Ltd.
- Alstom
- Chevron Corporation
- Star Energy Ltd
- Energy Development
- Terra-Gen LLC
- Contact Energy
- Orkuveita Reykjavikur
- Pertamina Geothermal Energy
- CalEnergy Generation
- Northern California Power Agency
- KenGen
- Calpine
*List not exhaustive
Geothermal Power Market Outlook 2023
1 Market Overview
1.1 Introduction to the Geothermal Power Market
1.2 Scope of the Study
1.3 Research Objective
1.3.1 Key Market Scope and Segments
1.3.2 Players Covered
1.3.3 Years Considered
2 Executive Summary
2.1 2023 Geothermal Power Industry- Market Statistics
3 Market Dynamics
3.1 Market Drivers
3.2 Market Challenges
3.3 Market Opportunities
3.4 Market Trends
4 Market Factor Analysis
4.1 Porter’s Five Forces
4.2 Market Entropy
4.2.1 Global Geothermal Power Market Companies with Area Served
4.2.2 Products Offerings Global Geothermal Power Market
5 COVID-19 Impact Analysis and Outlook Scenarios
5.1.1 Covid-19 Impact Analysis
5.1.2 Post-COVID-19 Scenario- Low Growth Case
5.1.3 Post-COVID-19 Scenario- Reference Growth Case
5.1.4 Post-COVID-19 Scenario- Low Growth Case
6 Global Geothermal Power Market Trends
6.1 Global Geothermal Power Revenue (USD Million) and CAGR (%) by Type (2018-2030)
6.2 Global Geothermal Power Revenue (USD Million) and CAGR (%) by Applications (2018-2030)
6.3 Global Geothermal Power Revenue (USD Million) and CAGR (%) by Regions (2018-2030)
7 Global Geothermal Power Market Revenue (USD Million) by Type, and Applications (2018-2022)
7.1 Global Geothermal Power Revenue (USD Million) by Type (2018-2022)
7.1.1 Global Geothermal Power Revenue (USD Million), Market Share (%) by Type (2018-2022)
7.2 Global Geothermal Power Revenue (USD Million) by Applications (2018-2022)
7.2.1 Global Geothermal Power Revenue (USD Million), Market Share (%) by Applications (2018-2022)
8 Global Geothermal Power Development Regional Status and Outlook
8.1 Global Geothermal Power Revenue (USD Million) By Regions (2018-2022)
8.2 North America Geothermal Power Revenue (USD Million) by Type, and Application (2018-2022)
8.2.1 North America Geothermal Power Revenue (USD Million) by Country (2018-2022)
8.2.2 North America Geothermal Power Revenue (USD Million) by Type (2018-2022)
8.2.3 North America Geothermal Power Revenue (USD Million) by Applications (2018-2022)
8.3 Europe Geothermal Power Revenue (USD Million), by Type, and Applications (USD Million) (2018-2022)
8.3.1 Europe Geothermal Power Revenue (USD Million), by Country (2018-2022)
8.3.2 Europe Geothermal Power Revenue (USD Million) by Type (2018-2022)
8.3.3 Europe Geothermal Power Revenue (USD Million) by Applications (2018-2022)
8.4 Asia Pacific Geothermal Power Revenue (USD Million), and Revenue (USD Million) by Type, and Applications (2018-2022)
8.4.1 Asia Pacific Geothermal Power Revenue (USD Million) by Country (2018-2022)
8.4.2 Asia Pacific Geothermal Power Revenue (USD Million) by Type (2018-2022)
8.4.3 Asia Pacific Geothermal Power Revenue (USD Million) by Applications (2018-2022)
8.5 South America Geothermal Power Revenue (USD Million), by Type, and Applications (2018-2022)
8.5.1 South America Geothermal Power Revenue (USD Million), by Country (2018-2022)
8.5.2 South America Geothermal Power Revenue (USD Million) by Type (2018-2022)
8.5.3 South America Geothermal Power Revenue (USD Million) by Applications (2018-2022)
8.6 Middle East and Africa Geothermal Power Revenue (USD Million), by Type, Technology, Application, Thickness (2018-2022)
8.6.1 Middle East and Africa Geothermal Power Revenue (USD Million) by Country (2018-2022)
8.6.2 Middle East and Africa Geothermal Power Revenue (USD Million) by Type (2018-2022)
8.6.3 Middle East and Africa Geothermal Power Revenue (USD Million) by Applications (2018-2022)
9 Company Profiles
10 Global Geothermal Power Market Revenue (USD Million), by Type, and Applications (2023-2030)
10.1 Global Geothermal Power Revenue (USD Million) and Market Share (%) by Type (2023-2030)
10.1.1 Global Geothermal Power Revenue (USD Million), and Market Share (%) by Type (2023-2030)
10.2 Global Geothermal Power Revenue (USD Million) and Market Share (%) by Applications (2023-2030)
10.2.1 Global Geothermal Power Revenue (USD Million), and Market Share (%) by Applications (2023-2030)
11 Global Geothermal Power Development Regional Status and Outlook Forecast
11.1 Global Geothermal Power Revenue (USD Million) By Regions (2023-2030)
11.2 North America Geothermal Power Revenue (USD Million) by Type, and Applications (2023-2030)
11.2.1 North America Geothermal Power Revenue (USD) Million by Country (2023-2030)
11.2.2 North America Geothermal Power Revenue (USD Million), by Type (2023-2030)
11.2.3 North America Geothermal Power Revenue (USD Million), Market Share (%) by Applications (2023-2030)
11.3 Europe Geothermal Power Revenue (USD Million), by Type, and Applications (2023-2030)
11.3.1 Europe Geothermal Power Revenue (USD Million), by Country (2023-2030)
11.3.2 Europe Geothermal Power Revenue (USD Million), by Type (2023-2030)
11.3.3 Europe Geothermal Power Revenue (USD Million), by Applications (2023-2030)
11.4 Asia Pacific Geothermal Power Revenue (USD Million) by Type, and Applications (2023-2030)
11.4.1 Asia Pacific Geothermal Power Revenue (USD Million), by Country (2023-2030)
11.4.2 Asia Pacific Geothermal Power Revenue (USD Million), by Type (2023-2030)
11.4.3 Asia Pacific Geothermal Power Revenue (USD Million), by Applications (2023-2030)
11.5 South America Geothermal Power Revenue (USD Million), by Type, and Applications (2023-2030)
11.5.1 South America Geothermal Power Revenue (USD Million), by Country (2023-2030)
11.5.2 South America Geothermal Power Revenue (USD Million), by Type (2023-2030)
11.5.3 South America Geothermal Power Revenue (USD Million), by Applications (2023-2030)
11.6 Middle East and Africa Geothermal Power Revenue (USD Million), by Type, and Applications (2023-2030)
11.6.1 Middle East and Africa Geothermal Power Revenue (USD Million), by Region (2023-2030)
11.6.2 Middle East and Africa Geothermal Power Revenue (USD Million), by Type (2023-2030)
11.6.3 Middle East and Africa Geothermal Power Revenue (USD Million), by Applications (2023-2030)
12 Methodology and Data Sources
12.1 Methodology/Research Approach
12.1.1 Research Programs/Design
12.1.2 Market Size Estimation
12.1.3 Market Breakdown and Data Triangulation
12.2 Data Sources
12.2.1 Secondary Sources
12.2.2 Primary Sources
12.3 Disclaimer
List of Tables
Table 1 Market Segmentation Analysis
Table 2 Global Geothermal Power Market Companies with Areas Served
Table 3 Products Offerings Global Geothermal Power Market
Table 4 Low Growth Scenario Forecasts
Table 5 Reference Case Growth Scenario
Table 6 High Growth Case Scenario
Table 7 Global Geothermal Power Revenue (USD Million) And CAGR (%) By Type (2018-2030)
Table 8 Global Geothermal Power Revenue (USD Million) And CAGR (%) By Applications (2018-2030)
Table 9 Global Geothermal Power Revenue (USD Million) And CAGR (%) By Regions (2018-2030)
Table 10 Global Geothermal Power Revenue (USD Million) By Type (2018-2022)
Table 11 Global Geothermal Power Revenue Market Share (%) By Type (2018-2022)
Table 12 Global Geothermal Power Revenue (USD Million) By Applications (2018-2022)
Table 13 Global Geothermal Power Revenue Market Share (%) By Applications (2018-2022)
Table 14 Global Geothermal Power Market Revenue (USD Million) By Regions (2018-2022)
Table 15 Global Geothermal Power Market Share (%) By Regions (2018-2022)
Table 16 North America Geothermal Power Revenue (USD Million) By Country (2018-2022)
Table 17 North America Geothermal Power Revenue (USD Million) By Type (2018-2022)
Table 18 North America Geothermal Power Revenue (USD Million) By Applications (2018-2022)
Table 19 Europe Geothermal Power Revenue (USD Million) By Country (2018-2022)
Table 20 Europe Geothermal Power Revenue (USD Million) By Type (2018-2022)
Table 21 Europe Geothermal Power Revenue (USD Million) By Applications (2018-2022)
Table 22 Asia Pacific Geothermal Power Revenue (USD Million) By Country (2018-2022)
Table 23 Asia Pacific Geothermal Power Revenue (USD Million) By Type (2018-2022)
Table 24 Asia Pacific Geothermal Power Revenue (USD Million) By Applications (2018-2022)
Table 25 South America Geothermal Power Revenue (USD Million) By Country (2018-2022)
Table 26 South America Geothermal Power Revenue (USD Million) By Type (2018-2022)
Table 27 South America Geothermal Power Revenue (USD Million) By Applications (2018-2022)
Table 28 Middle East and Africa Geothermal Power Revenue (USD Million) By Region (2018-2022)
Table 29 Middle East and Africa Geothermal Power Revenue (USD Million) By Type (2018-2022)
Table 30 Middle East and Africa Geothermal Power Revenue (USD Million) By Applications (2018-2022)
Table 31 Financial Analysis
Table 32 Global Geothermal Power Revenue (USD Million) By Type (2023-2030)
Table 33 Global Geothermal Power Revenue Market Share (%) By Type (2023-2030)
Table 34 Global Geothermal Power Revenue (USD Million) By Applications (2023-2030)
Table 35 Global Geothermal Power Revenue Market Share (%) By Applications (2023-2030)
Table 36 Global Geothermal Power Market Revenue (USD Million), And Revenue (USD Million) By Regions (2023-2030)
Table 37 North America Geothermal Power Revenue (USD)By Country (2023-2030)
Table 38 North America Geothermal Power Revenue (USD Million) By Type (2023-2030)
Table 39 North America Geothermal Power Revenue (USD Million) By Applications (2023-2030)
Table 40 Europe Geothermal Power Revenue (USD Million) By Country (2023-2030)
Table 41 Europe Geothermal Power Revenue (USD Million) By Type (2023-2030)
Table 42 Europe Geothermal Power Revenue (USD Million) By Applications (2023-2030)
Table 43 Asia Pacific Geothermal Power Revenue (USD Million) By Country (2023-2030)
Table 44 Asia Pacific Geothermal Power Revenue (USD Million) By Type (2023-2030)
Table 45 Asia Pacific Geothermal Power Revenue (USD Million) By Applications (2023-2030)
Table 46 South America Geothermal Power Revenue (USD Million) By Country (2023-2030)
Table 47 South America Geothermal Power Revenue (USD Million) By Type (2023-2030)
Table 48 South America Geothermal Power Revenue (USD Million) By Applications (2023-2030)
Table 49 Middle East and Africa Geothermal Power Revenue (USD Million) By Region (2023-2030)
Table 50 Middle East and Africa Geothermal Power Revenue (USD Million) By Region (2023-2030)
Table 51 Middle East and Africa Geothermal Power Revenue (USD Million) By Type (2023-2030)
Table 52 Middle East and Africa Geothermal Power Revenue (USD Million) By Applications (2023-2030)
Table 53 Research Programs/Design for This Report
Table 54 Key Data Information from Secondary Sources
Table 55 Key Data Information from Primary Sources
List of Figures
Figure 1 Market Scope
Figure 2 Porter’s Five Forces
Figure 3 Global Geothermal Power Revenue (USD Million) By Type (2018-2022)
Figure 4 Global Geothermal Power Revenue Market Share (%) By Type (2022)
Figure 5 Global Geothermal Power Revenue (USD Million) By Applications (2018-2022)
Figure 6 Global Geothermal Power Revenue Market Share (%) By Applications (2022)
Figure 7 Global Geothermal Power Market Revenue (USD Million) By Regions (2018-2022)
Figure 8 Global Geothermal Power Market Share (%) By Regions (2022)
Figure 9 North America Geothermal Power Revenue (USD Million) By Country (2018-2022)
Figure 10 North America Geothermal Power Revenue (USD Million) By Type (2018-2022)
Figure 11 North America Geothermal Power Revenue (USD Million) By Applications (2018-2022)
Figure 12 Europe Geothermal Power Revenue (USD Million) By Country (2018-2022)
Figure 13 Europe Geothermal Power Revenue (USD Million) By Type (2018-2022)
Figure 14 Europe Geothermal Power Revenue (USD Million) By Applications (2018-2022)
Figure 15 Asia Pacific Geothermal Power Revenue (USD Million) By Country (2018-2022)
Figure 16 Asia Pacific Geothermal Power Revenue (USD Million) By Type (2018-2022)
Figure 17 Asia Pacific Geothermal Power Revenue (USD Million) By Applications (2018-2022)
Figure 18 South America Geothermal Power Revenue (USD Million) By Country (2018-2022)
Figure 19 South America Geothermal Power Revenue (USD Million) By Type (2018-2022)
Figure 20 South America Geothermal Power Revenue (USD Million) By Applications (2018-2022)
Figure 21 Middle East and Africa Geothermal Power Revenue (USD Million) By Region (2018-2022)
Figure 22 Middle East and Africa Geothermal Power Revenue (USD Million) By Type (2018-2022)
Figure 23 Middle East and Africa Geothermal Power Revenue (USD Million) By Applications (2018-2022)
Figure 24 Global Geothermal Power Revenue (USD Million) By Type (2023-2030)
Figure 25 Global Geothermal Power Revenue Market Share (%) By Type (2030)
Figure 26 Global Geothermal Power Revenue (USD Million) By Applications (2023-2030)
Figure 27 Global Geothermal Power Revenue Market Share (%) By Applications (2030)
Figure 28 Global Geothermal Power Market Revenue (USD Million) By Regions (2023-2030)
Figure 29 North America Geothermal Power Revenue (USD Million) By Country (2023-2030)
Figure 30 North America Geothermal Power Revenue (USD Million) By Type (2023-2030)
Figure 31 North America Geothermal Power Revenue (USD Million) By Applications (2023-2030)
Figure 32 Europe Geothermal Power Revenue (USD Million) By Country (2023-2030)
Figure 33 Europe Geothermal Power Revenue (USD Million) By Type (2023-2030)
Figure 34 Europe Geothermal Power Revenue (USD Million) By Applications (2023-2030)
Figure 35 Asia Pacific Geothermal Power Revenue (USD Million) By Country (2023-2030)
Figure 36 Asia Pacific Geothermal Power Revenue (USD Million) By Type (2023-2030)
Figure 37 Asia Pacific Geothermal Power Revenue (USD Million) By Applications (2023-2030)
Figure 38 South America Geothermal Power Revenue (USD Million) By Country (2023-2030)
Figure 39 South America Geothermal Power Revenue (USD Million) By Type (2023-2030)
Figure 40 South America Geothermal Power Revenue (USD Million) By Applications (2023-2030)
Figure 41 Middle East and Africa Geothermal Power Revenue (USD Million) By Region (2023-2030)
Figure 42 Middle East and Africa Geothermal Power Revenue (USD Million) By Region (2023-2030)
Figure 43 Middle East and Africa Geothermal Power Revenue (USD Million) By Type (2023-2030)
Figure 44 Middle East and Africa Geothermal Power Revenue (USD Million) By Applications (2023-2030)
Figure 45 Bottom-Up and Top-Down Approaches For This Report
Figure 46 Data Triangulation
