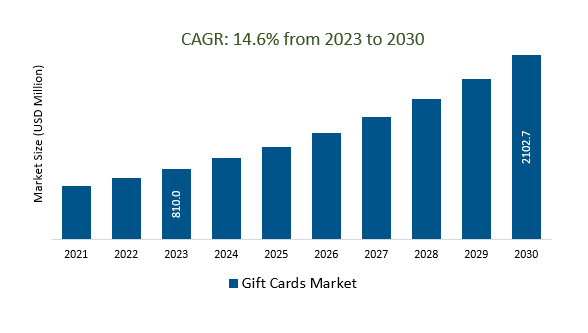
The Global Gift Cards Market Size is estimated to be US 810.0 Billion in 2023 and is poised to register 14.6% growth over the forecast period from 2023 to 2030 to reach US $ 2102.7 billion in 2030.
The market growth is driven by the increasing business use of gift cards for employee rewards, incentives, and customer appreciation, driving the B2B gift card market. Leading Companies that are focusing on Digital Domination, Personalization, AI and Machine Learning, Blockchain Technology, Cross-Border Gifting, Health and Wellness, Global Economic Factors, and others to boost market shares in the industry.
Market Overview
The global gift card market continues to grow steadily, with a focus on digital and e-gift cards for convenience. It encompasses retail and open-loop cards, offers customization options, serves corporate incentive programs, integrates with mobile wallets, and faces regulatory variations. Sustainability concerns prompt eco-friendly alternatives, while the industry explores blockchain and cryptocurrency integration for security. The pandemic accelerated the shift towards digital options, affecting physical stores. Major players include retailers, financial institutions, and payment processors, with the industry evolving rapidly.
Market Dynamics
Market Trends - The benefits of mobile wallet integration for gift cards
Mobile wallet integration for gift cards offers a myriad of advantages in the modern digital landscape, it enhances convenience for both consumers and businesses by eliminating the need for physical gift cards. Users can store and access their gift cards on their smartphones, streamlining the gifting process. Additionally, mobile wallets enable personalized and targeted marketing campaigns, allowing businesses to send tailored promotions and reminders to their customers, ultimately boosting sales and customer engagement.
Market Driver- The demand for gift card experiences is driving growth in the gift card market.
The surge in the gift card market can be attributed to the growing demand for gift card experiences. Traditionally, gift cards were seen as impersonal, but today, consumers are increasingly valuing the flexibility and choice they provide. Instead of traditional retail gift cards, people are now seeking experiences like spa treatments, gourmet dining, or adventure activities. This shift reflects a desire for memorable, personalized gifts that cater to individual preferences. Additionally, the convenience of digital gift cards and the rise of e-commerce platforms have made it easier than ever to purchase and redeem gift cards, further driving market growth.
Market Opportunity- The introduction of gift cards as gifts of choice has made it easier than ever for consumers to find the perfect gift for their loved ones
The advent of gift cards as preferred presents has revolutionized the art of gift-giving, simplifying the process for consumers to discover the ideal gift for their friends and family. This innovation addresses the perennial challenge of choosing gifts that align with individual tastes and preferences. Gift cards empower recipients with the flexibility to select their desired items from a wide array of options, spanning retail stores, restaurants, entertainment venues, and online shops. This not only saves time and effort but also ensures that the recipient receives a gift they genuinely appreciate.
Market Share Analysis- Open Loop Gift Cards the Gift Cards Market will register the fastest growth
The Global Gift Cards Market is analyzed across Open Loop Gift Cards, Closed Loop Gift Cards, and others. Open Loop Gift Cards is poised to register the fastest growth. Open-loop gift cards, issued by major credit card companies, are versatile and widely accepted in the gift card market, reflecting the demand for flexible gifting options.
Market Share Analysis- Restaurants held a significant market share in 2023
The Global Gift Cards Market is analyzed across various applications including Restaurant, Department Store, Coffee Shop, Entertainment, and others. Of these, Restaurants held a significant market share in 2023. Restaurant gift cards are a significant part of the gift card market, favored for their universal appeal and flexibility, making them ideal for various occasions and recipients. They embody the enduring popularity of dining experiences as thoughtful gifts.
Gift Cards Market Segmentation
By Type
- Open Loop Gift Cards
- Closed Loop Gift Cards
By Application
- Restaurant
- Department Store
- Coffee Shop
- Entertainment
- Others
By Region
- North America (United States, Canada, Mexico)
- Europe (Germany, France, United Kingdom, Spain, Italy, Others)
- Asia Pacific (China, India, Japan, South Korea, Australia, Others)
- Latin America (Brazil, Argentina, Others)
- Middle East and Africa (Saudi Arabia, UAE, Kuwait, Other Middle East, South Africa, Nigeria, Other Africa)
Gift Cards Market Companies
- Qwikcilver Solutions Pvt. Ltd (India)
- American Express (United States)
- Blackhawk Network Holdings Inc (United States)
- Givex Corporation (Canada)
- First Data Corporation (United States)
- National Gift Card Corp (United States)
- Paytronix Systems Inc (United States)
- Amazon (United States)
- Starbucks (United States)
- Walmart (United States)
- Google Play (United States)
- InComm, Inc (United States)
*List not exhaustive
Gift Cards Market Outlook 2023
1 Market Overview
1.1 Introduction to the Gift Cards Market
1.2 Scope of the Study
1.3 Research Objective
1.3.1 Key Market Scope and Segments
1.3.2 Players Covered
1.3.3 Years Considered
2 Executive Summary
2.1 2023 Gift Cards Industry- Market Statistics
3 Market Dynamics
3.1 Market Drivers
3.2 Market Challenges
3.3 Market Opportunities
3.4 Market Trends
4 Market Factor Analysis
4.1 Porter’s Five Forces
4.2 Market Entropy
4.2.1 Global Gift Cards Market Companies with Area Served
4.2.2 Products Offerings Global Gift Cards Market
5 COVID-19 Impact Analysis and Outlook Scenarios
5.1.1 Covid-19 Impact Analysis
5.1.2 Post-COVID-19 Scenario- Low Growth Case
5.1.3 Post-COVID-19 Scenario- Reference Growth Case
5.1.4 Post-COVID-19 Scenario- Low Growth Case
6 Global Gift Cards Market Trends
6.1 Global Gift Cards Revenue (USD Million) and CAGR (%) by Type (2018-2030)
6.2 Global Gift Cards Revenue (USD Million) and CAGR (%) by Applications (2018-2030)
6.3 Global Gift Cards Revenue (USD Million) and CAGR (%) by Regions (2018-2030)
7 Global Gift Cards Market Revenue (USD Million) by Type, and Applications (2018-2022)
7.1 Global Gift Cards Revenue (USD Million) by Type (2018-2022)
7.1.1 Global Gift Cards Revenue (USD Million), Market Share (%) by Type (2018-2022)
7.2 Global Gift Cards Revenue (USD Million) by Applications (2018-2022)
7.2.1 Global Gift Cards Revenue (USD Million), Market Share (%) by Applications (2018-2022)
8 Global Gift Cards Development Regional Status and Outlook
8.1 Global Gift Cards Revenue (USD Million) By Regions (2018-2022)
8.2 North America Gift Cards Revenue (USD Million) by Type, and Application (2018-2022)
8.2.1 North America Gift Cards Revenue (USD Million) by Country (2018-2022)
8.2.2 North America Gift Cards Revenue (USD Million) by Type (2018-2022)
8.2.3 North America Gift Cards Revenue (USD Million) by Applications (2018-2022)
8.3 Europe Gift Cards Revenue (USD Million), by Type, and Applications (USD Million) (2018-2022)
8.3.1 Europe Gift Cards Revenue (USD Million), by Country (2018-2022)
8.3.2 Europe Gift Cards Revenue (USD Million) by Type (2018-2022)
8.3.3 Europe Gift Cards Revenue (USD Million) by Applications (2018-2022)
8.4 Asia Pacific Gift Cards Revenue (USD Million), and Revenue (USD Million) by Type, and Applications (2018-2022)
8.4.1 Asia Pacific Gift Cards Revenue (USD Million) by Country (2018-2022)
8.4.2 Asia Pacific Gift Cards Revenue (USD Million) by Type (2018-2022)
8.4.3 Asia Pacific Gift Cards Revenue (USD Million) by Applications (2018-2022)
8.5 South America Gift Cards Revenue (USD Million), by Type, and Applications (2018-2022)
8.5.1 South America Gift Cards Revenue (USD Million), by Country (2018-2022)
8.5.2 South America Gift Cards Revenue (USD Million) by Type (2018-2022)
8.5.3 South America Gift Cards Revenue (USD Million) by Applications (2018-2022)
8.6 Middle East and Africa Gift Cards Revenue (USD Million), by Type, Technology, Application, Thickness (2018-2022)
8.6.1 Middle East and Africa Gift Cards Revenue (USD Million) by Country (2018-2022)
8.6.2 Middle East and Africa Gift Cards Revenue (USD Million) by Type (2018-2022)
8.6.3 Middle East and Africa Gift Cards Revenue (USD Million) by Applications (2018-2022)
9 Company Profiles
10 Global Gift Cards Market Revenue (USD Million), by Type, and Applications (2023-2030)
10.1 Global Gift Cards Revenue (USD Million) and Market Share (%) by Type (2023-2030)
10.1.1 Global Gift Cards Revenue (USD Million), and Market Share (%) by Type (2023-2030)
10.2 Global Gift Cards Revenue (USD Million) and Market Share (%) by Applications (2023-2030)
10.2.1 Global Gift Cards Revenue (USD Million), and Market Share (%) by Applications (2023-2030)
11 Global Gift Cards Development Regional Status and Outlook Forecast
11.1 Global Gift Cards Revenue (USD Million) By Regions (2023-2030)
11.2 North America Gift Cards Revenue (USD Million) by Type, and Applications (2023-2030)
11.2.1 North America Gift Cards Revenue (USD) Million by Country (2023-2030)
11.2.2 North America Gift Cards Revenue (USD Million), by Type (2023-2030)
11.2.3 North America Gift Cards Revenue (USD Million), Market Share (%) by Applications (2023-2030)
11.3 Europe Gift Cards Revenue (USD Million), by Type, and Applications (2023-2030)
11.3.1 Europe Gift Cards Revenue (USD Million), by Country (2023-2030)
11.3.2 Europe Gift Cards Revenue (USD Million), by Type (2023-2030)
11.3.3 Europe Gift Cards Revenue (USD Million), by Applications (2023-2030)
11.4 Asia Pacific Gift Cards Revenue (USD Million) by Type, and Applications (2023-2030)
11.4.1 Asia Pacific Gift Cards Revenue (USD Million), by Country (2023-2030)
11.4.2 Asia Pacific Gift Cards Revenue (USD Million), by Type (2023-2030)
11.4.3 Asia Pacific Gift Cards Revenue (USD Million), by Applications (2023-2030)
11.5 South America Gift Cards Revenue (USD Million), by Type, and Applications (2023-2030)
11.5.1 South America Gift Cards Revenue (USD Million), by Country (2023-2030)
11.5.2 South America Gift Cards Revenue (USD Million), by Type (2023-2030)
11.5.3 South America Gift Cards Revenue (USD Million), by Applications (2023-2030)
11.6 Middle East and Africa Gift Cards Revenue (USD Million), by Type, and Applications (2023-2030)
11.6.1 Middle East and Africa Gift Cards Revenue (USD Million), by Region (2023-2030)
11.6.2 Middle East and Africa Gift Cards Revenue (USD Million), by Type (2023-2030)
11.6.3 Middle East and Africa Gift Cards Revenue (USD Million), by Applications (2023-2030)
12 Methodology and Data Sources
12.1 Methodology/Research Approach
12.1.1 Research Programs/Design
12.1.2 Market Size Estimation
12.1.3 Market Breakdown and Data Triangulation
12.2 Data Sources
12.2.1 Secondary Sources
12.2.2 Primary Sources
12.3 Disclaimer
List of Tables
Table 1 Market Segmentation Analysis
Table 2 Global Gift Cards Market Companies with Areas Served
Table 3 Products Offerings Global Gift Cards Market
Table 4 Low Growth Scenario Forecasts
Table 5 Reference Case Growth Scenario
Table 6 High Growth Case Scenario
Table 7 Global Gift Cards Revenue (USD Million) And CAGR (%) By Type (2018-2030)
Table 8 Global Gift Cards Revenue (USD Million) And CAGR (%) By Applications (2018-2030)
Table 9 Global Gift Cards Revenue (USD Million) And CAGR (%) By Regions (2018-2030)
Table 10 Global Gift Cards Revenue (USD Million) By Type (2018-2022)
Table 11 Global Gift Cards Revenue Market Share (%) By Type (2018-2022)
Table 12 Global Gift Cards Revenue (USD Million) By Applications (2018-2022)
Table 13 Global Gift Cards Revenue Market Share (%) By Applications (2018-2022)
Table 14 Global Gift Cards Market Revenue (USD Million) By Regions (2018-2022)
Table 15 Global Gift Cards Market Share (%) By Regions (2018-2022)
Table 16 North America Gift Cards Revenue (USD Million) By Country (2018-2022)
Table 17 North America Gift Cards Revenue (USD Million) By Type (2018-2022)
Table 18 North America Gift Cards Revenue (USD Million) By Applications (2018-2022)
Table 19 Europe Gift Cards Revenue (USD Million) By Country (2018-2022)
Table 20 Europe Gift Cards Revenue (USD Million) By Type (2018-2022)
Table 21 Europe Gift Cards Revenue (USD Million) By Applications (2018-2022)
Table 22 Asia Pacific Gift Cards Revenue (USD Million) By Country (2018-2022)
Table 23 Asia Pacific Gift Cards Revenue (USD Million) By Type (2018-2022)
Table 24 Asia Pacific Gift Cards Revenue (USD Million) By Applications (2018-2022)
Table 25 South America Gift Cards Revenue (USD Million) By Country (2018-2022)
Table 26 South America Gift Cards Revenue (USD Million) By Type (2018-2022)
Table 27 South America Gift Cards Revenue (USD Million) By Applications (2018-2022)
Table 28 Middle East and Africa Gift Cards Revenue (USD Million) By Region (2018-2022)
Table 29 Middle East and Africa Gift Cards Revenue (USD Million) By Type (2018-2022)
Table 30 Middle East and Africa Gift Cards Revenue (USD Million) By Applications (2018-2022)
Table 31 Financial Analysis
Table 32 Global Gift Cards Revenue (USD Million) By Type (2023-2030)
Table 33 Global Gift Cards Revenue Market Share (%) By Type (2023-2030)
Table 34 Global Gift Cards Revenue (USD Million) By Applications (2023-2030)
Table 35 Global Gift Cards Revenue Market Share (%) By Applications (2023-2030)
Table 36 Global Gift Cards Market Revenue (USD Million), And Revenue (USD Million) By Regions (2023-2030)
Table 37 North America Gift Cards Revenue (USD)By Country (2023-2030)
Table 38 North America Gift Cards Revenue (USD Million) By Type (2023-2030)
Table 39 North America Gift Cards Revenue (USD Million) By Applications (2023-2030)
Table 40 Europe Gift Cards Revenue (USD Million) By Country (2023-2030)
Table 41 Europe Gift Cards Revenue (USD Million) By Type (2023-2030)
Table 42 Europe Gift Cards Revenue (USD Million) By Applications (2023-2030)
Table 43 Asia Pacific Gift Cards Revenue (USD Million) By Country (2023-2030)
Table 44 Asia Pacific Gift Cards Revenue (USD Million) By Type (2023-2030)
Table 45 Asia Pacific Gift Cards Revenue (USD Million) By Applications (2023-2030)
Table 46 South America Gift Cards Revenue (USD Million) By Country (2023-2030)
Table 47 South America Gift Cards Revenue (USD Million) By Type (2023-2030)
Table 48 South America Gift Cards Revenue (USD Million) By Applications (2023-2030)
Table 49 Middle East and Africa Gift Cards Revenue (USD Million) By Region (2023-2030)
Table 50 Middle East and Africa Gift Cards Revenue (USD Million) By Region (2023-2030)
Table 51 Middle East and Africa Gift Cards Revenue (USD Million) By Type (2023-2030)
Table 52 Middle East and Africa Gift Cards Revenue (USD Million) By Applications (2023-2030)
Table 53 Research Programs/Design for This Report
Table 54 Key Data Information from Secondary Sources
Table 55 Key Data Information from Primary Sources
List of Figures
Figure 1 Market Scope
Figure 2 Porter’s Five Forces
Figure 3 Global Gift Cards Revenue (USD Million) By Type (2018-2022)
Figure 4 Global Gift Cards Revenue Market Share (%) By Type (2022)
Figure 5 Global Gift Cards Revenue (USD Million) By Applications (2018-2022)
Figure 6 Global Gift Cards Revenue Market Share (%) By Applications (2022)
Figure 7 Global Gift Cards Market Revenue (USD Million) By Regions (2018-2022)
Figure 8 Global Gift Cards Market Share (%) By Regions (2022)
Figure 9 North America Gift Cards Revenue (USD Million) By Country (2018-2022)
Figure 10 North America Gift Cards Revenue (USD Million) By Type (2018-2022)
Figure 11 North America Gift Cards Revenue (USD Million) By Applications (2018-2022)
Figure 12 Europe Gift Cards Revenue (USD Million) By Country (2018-2022)
Figure 13 Europe Gift Cards Revenue (USD Million) By Type (2018-2022)
Figure 14 Europe Gift Cards Revenue (USD Million) By Applications (2018-2022)
Figure 15 Asia Pacific Gift Cards Revenue (USD Million) By Country (2018-2022)
Figure 16 Asia Pacific Gift Cards Revenue (USD Million) By Type (2018-2022)
Figure 17 Asia Pacific Gift Cards Revenue (USD Million) By Applications (2018-2022)
Figure 18 South America Gift Cards Revenue (USD Million) By Country (2018-2022)
Figure 19 South America Gift Cards Revenue (USD Million) By Type (2018-2022)
Figure 20 South America Gift Cards Revenue (USD Million) By Applications (2018-2022)
Figure 21 Middle East and Africa Gift Cards Revenue (USD Million) By Region (2018-2022)
Figure 22 Middle East and Africa Gift Cards Revenue (USD Million) By Type (2018-2022)
Figure 23 Middle East and Africa Gift Cards Revenue (USD Million) By Applications (2018-2022)
Figure 24 Global Gift Cards Revenue (USD Million) By Type (2023-2030)
Figure 25 Global Gift Cards Revenue Market Share (%) By Type (2030)
Figure 26 Global Gift Cards Revenue (USD Million) By Applications (2023-2030)
Figure 27 Global Gift Cards Revenue Market Share (%) By Applications (2030)
Figure 28 Global Gift Cards Market Revenue (USD Million) By Regions (2023-2030)
Figure 29 North America Gift Cards Revenue (USD Million) By Country (2023-2030)
Figure 30 North America Gift Cards Revenue (USD Million) By Type (2023-2030)
Figure 31 North America Gift Cards Revenue (USD Million) By Applications (2023-2030)
Figure 32 Europe Gift Cards Revenue (USD Million) By Country (2023-2030)
Figure 33 Europe Gift Cards Revenue (USD Million) By Type (2023-2030)
Figure 34 Europe Gift Cards Revenue (USD Million) By Applications (2023-2030)
Figure 35 Asia Pacific Gift Cards Revenue (USD Million) By Country (2023-2030)
Figure 36 Asia Pacific Gift Cards Revenue (USD Million) By Type (2023-2030)
Figure 37 Asia Pacific Gift Cards Revenue (USD Million) By Applications (2023-2030)
Figure 38 South America Gift Cards Revenue (USD Million) By Country (2023-2030)
Figure 39 South America Gift Cards Revenue (USD Million) By Type (2023-2030)
Figure 40 South America Gift Cards Revenue (USD Million) By Applications (2023-2030)
Figure 41 Middle East and Africa Gift Cards Revenue (USD Million) By Region (2023-2030)
Figure 42 Middle East and Africa Gift Cards Revenue (USD Million) By Region (2023-2030)
Figure 43 Middle East and Africa Gift Cards Revenue (USD Million) By Type (2023-2030)
Figure 44 Middle East and Africa Gift Cards Revenue (USD Million) By Applications (2023-2030)
Figure 45 Bottom-Up and Top-Down Approaches For This Report
Figure 46 Data Triangulation
