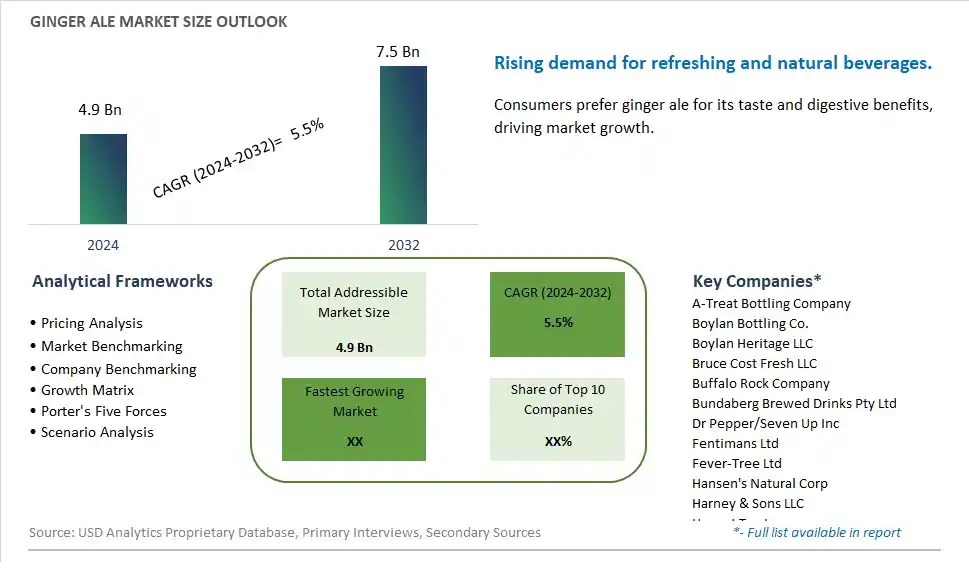
Global Ginger Ale Market Size is valued at $4.9 Billion in 2024 and is forecast to register a growth rate (CAGR) of 5.5% to reach $7.5 Billion by 2032.
The global Ginger Ale Market Comprehensive Study analyzes and forecasts the market size across 6 regions and 24 countries for diverse segments -By Type (Golden Ginger Ale, Dry Ginger Ale), By Distribution Channel (Convenience Stores, Hypermarkets/Supermarkets, Specialty Stores, Online, Others)
An Introduction to Ginger Ale Market
In 2024, ginger ale retains its status as a beloved and versatile beverage choice, offering consumers a refreshing blend of carbonation and ginger flavor with a hint of sweetness. Originating as a medicinal tonic, ginger ale has evolved into a popular soft drink enjoyed on its own or as a mixer in cocktails and mocktails. Its distinctive spicy-sweet profile and perceived digestive benefits have contributed to its enduring appeal across demographics and occasions. With health-conscious consumers seeking alternatives to traditional sodas and sugary beverages, ginger ale's natural ingredients and perceived wellness attributes position it favorably in the market. Moreover, the rise of craft and artisanal beverages has spurred innovation in ginger ale formulations, with variations including spicy ginger beer and botanical-infused blends capturing consumer interest. As beverage manufacturers respond to shifting preferences and dietary trends, ginger ale remains a timeless classic with a contemporary twist, poised for continued growth and innovation in the beverage landscape.
Ginger Ale Competitive Landscape
The market report analyses the leading companies in the industry including A-Treat Bottling Company, Boylan Bottling Co., Boylan Heritage LLC, Bruce Cost Fresh LLC, Buffalo Rock Company, Bundaberg Brewed Drinks Pty Ltd, Dr Pepper/Seven Up Inc, Fentimans Ltd, Fever-Tree Ltd, Hansen's Natural Corp, Harney & Sons LLC, Honest Tea Inc, Jones Soda Co., Polar Beverages, Red Rock Cola Inc, Reed's Inc, Schweppes International Ltd, Seagram Company Ltd, Thomas Henry GmbH & Co. KG, Vernors and Hansen Natural Corp, White Rock Beverages Inc, Zevia LLC, and Others.
Ginger Ale Market Dynamics
Ginger Ale Market Trend: Surge in Demand for Natural and Functional Beverages
One prominent trend in the ginger ale market is the surge in demand for natural and functional beverages. With increasing health consciousness among consumers and a shift towards cleaner ingredient labels, there's a growing preference for beverages made with natural ingredients and offering functional benefits. Ginger ale, traditionally known for its refreshing flavor, is gaining popularity for its potential health-promoting properties, including digestive health support and anti-inflammatory effects attributed to ginger. This trend is driving the development of ginger ale formulations that incorporate natural ginger extracts or real ginger root, positioning the beverage as a healthier alternative to conventional soft drinks.
Market Driver: Consumer Interest in Digestive Health and Wellness
A key driver in the ginger ale market is consumer interest in digestive health and wellness. As digestive issues such as bloating, indigestion, and nausea become increasingly common, consumers are seeking beverages that offer relief and support digestive well-being. Ginger ale, with its long-standing reputation as a digestive aid, is experiencing renewed interest among consumers looking for natural remedies to alleviate gastrointestinal discomfort. This driver fuels market growth as consumers seek out ginger ale products formulated with higher ginger concentrations or additional digestive-friendly ingredients such as probiotics or prebiotics, catering to the growing demand for beverages that promote gut health and overall wellness.
Market Opportunity: Innovation in Flavor Variations and Premium Offerings
An emerging opportunity in the ginger ale market is innovation in flavor variations and premium offerings. While traditional ginger ale is known for its distinct ginger flavor profile, there's potential to expand the market by introducing new flavor variations and premium formulations that appeal to diverse consumer preferences and occasions. Manufacturers can explore innovative flavor combinations such as ginger with citrus, berry, or herbal notes to create unique taste experiences and broaden the appeal of ginger ale beyond its traditional consumer base. Additionally, there's an opportunity to develop premium ginger ale offerings with higher-quality ingredients, such as organic ginger, natural sweeteners, and botanical extracts, targeting discerning consumers willing to pay a premium for artisanal, small-batch, or craft ginger ale products. By tapping into flavor innovation and premiumization trends, manufacturers can differentiate their ginger ale offerings and capture new market segments in the competitive beverage market landscape.
Ginger Ale Market Share Analysis: Dry Ginger Ale held the dominant market share in 2024
In the Ginger Ale Market, the Dry Ginger Ale segment is the largest, driven by its long-standing popularity, wide availability, and versatility in various beverage applications. Dry ginger ale, known for its distinctive spicy and refreshing flavor profile, has been a beloved choice among consumers for decades. It serves as a versatile mixer for cocktails and mocktails and is also enjoyed on its own as a standalone beverage. The classic appeal of dry ginger ale, coupled with its ability to complement a wide range of spirits and flavors, has cemented its position as a staple in bars, restaurants, and households worldwide. Further, dry ginger ale's crisp and effervescent nature makes it a refreshing option for consumers seeking a non-alcoholic beverage alternative. With its enduring popularity and widespread consumption, the Dry Ginger Ale segment continues to dominate the ginger ale market, catering to the diverse tastes and preferences of consumers globally.
Ginger Ale Market Share Analysis: Online market is poised to register the fastest growth rae over the forecast period to 2032
In the Ginger Ale Market, the Online segment is the fastest growing distribution channel, driven by the increasing adoption of e-commerce platforms, changing consumer shopping habits, and the convenience of online shopping. As consumers seek convenience and accessibility in their purchasing decisions, online shopping offers a convenient solution for acquiring ginger ale and other beverages from the comfort of their homes. Further, the COVID-19 pandemic has accelerated the shift towards online shopping, with consumers opting for contactless and hassle-free shopping experiences. Online platforms provide a wide selection of ginger ale brands and flavors, along with the convenience of doorstep delivery, making them an attractive option for busy consumers. Additionally, online retailers often offer competitive pricing, promotional discounts, and loyalty programs, further incentivizing consumers to purchase ginger ale online. As the online channel continues to gain traction and consumer confidence, the Online segment of the ginger ale market is poised for rapid growth, offering a convenient and efficient shopping experience for ginger ale enthusiasts.
Ginger Ale Market Segmentation
By Type
Golden Ginger Ale
Dry Ginger Ale
By Distribution Channel
Convenience Stores
Hypermarkets/Supermarkets
Specialty Stores
Online
Others
Countries Analyzed
North America (US, Canada, Mexico)
Europe (Germany, UK, France, Spain, Italy, Russia, Rest of Europe)
Asia Pacific (China, India, Japan, South Korea, Australia, South East Asia, Rest of Asia)
South America (Brazil, Argentina, Rest of South America)
Middle East and Africa (Saudi Arabia, UAE, Rest of Middle East, South Africa, Egypt, Rest of Africa)
Ginger Ale Companies Profiled in the Study
A-Treat Bottling Company
Boylan Bottling Co.
Boylan Heritage LLC
Bruce Cost Fresh LLC
Buffalo Rock Company
Bundaberg Brewed Drinks Pty Ltd
Dr Pepper/Seven Up Inc
Fentimans Ltd
Fever-Tree Ltd
Hansen's Natural Corp
Harney & Sons LLC
Honest Tea Inc
Jones Soda Co.
Polar Beverages
Red Rock Cola Inc
Reed's Inc
Schweppes International Ltd
Seagram Company Ltd
Thomas Henry GmbH & Co. KG
Vernors and Hansen Natural Corp
White Rock Beverages Inc
Zevia LLC
*- List Not Exhaustive
Chapter 1. TABLE OF CONTENTS
Chapter 2. Introduction to Ginger Ale Market
2.1. Market Overview
2.2. Key Statistics and Report Highlights
2.3. Scope of the Comprehensive Study
2.3.1. Market Definition
2.3.2 Countries and Regions Covered
2.3.3 Research Objective
2.3.4 Units, Currency, and Conversions
2.3.5 Industry Value Chain
2.4. Key Market Segments
2.5. Key Companies
2.6. Study Period
Chapter 3. Strategic Analysis Review
3.1. Ginger Ale Pricing Analysis and Forecast
3.2. Porter’s Five Forces
3.3. Market Ecosystem
3.4. SWOT Analysis
3.5. Regulatory Scenario
3.3. Effects of Inflation, Russia-Ukraine War, moderating economic growth, and other macroeconomic factors
Chapter 4. Competitive Landscape
4.1. Market Share Analysis
4.1.1. Global Ginger Ale Market Share by Company, 2023
4.1.2. Product Offerings of Leading Ginger Ale Companies
4.2. Market Entropy
4.2.1. New Product Launches in the Industry
4.2.2. Mergers, Acquisitions, Joint ventures, and Partnerships
4.3. Key Strategies and Best Practices
Chapter 5. Global Market Projections: Best, Reference, and Low Case Scenarios
5.1. Growth Analysis- Case Scenario Definitions
5.2. Low Growth Case Scenario Forecasts
5.3. Reference Growth Case Scenario Forecasts
5.4. High Growth Case Scenario Forecasts
Chapter 6. Market Dynamics
6.1. Ginger Ale Market Drivers
6.2. Ginger Ale Market Challenges
6.6. Ginger Ale Market Opportunities
6.4. Ginger Ale Market Trends
Chapter 7. Global Ginger Ale Market Outlook Trends
7.1. Global Ginger Ale Revenue (USD Million) and CAGR (%) by Type (2021-2032)
7.2. Global Ginger Ale Revenue (USD Million) and CAGR (%) by Application (2021-2032)
7.3. Global Ginger Ale Revenue (USD Million) and CAGR (%) by Product (2021-2032)
By Type
Golden Ginger Ale
Dry Ginger Ale
By Distribution Channel
Convenience Stores
Hypermarkets/Supermarkets
Specialty Stores
Online
Others
Chapter 8. Global Ginger Ale Regional Analysis and Outlook
8.1. Global Ginger Ale Revenue (USD Million) By Regions (2021- 2032)
8.2. North America Ginger Ale Revenue (USD Million) by Country (2021-2032)
8.2.1. United States Ginger Ale Regional Analysis and Outlook
8.2.2. Canada Ginger Ale Regional Analysis and Outlook
8.2.3. Mexico Ginger Ale Regional Analysis and Outlook
8.3. Europe Ginger Ale Revenue (USD Million), by Country (2021-2032)
8.3.1. Germany Ginger Ale Regional Analysis and Outlook
8.3.2. France Ginger Ale Regional Analysis and Outlook
8.3.3. United Kingdom Ginger Ale Regional Analysis and Outlook
8.3.4. Spain Ginger Ale Regional Analysis and Outlook
8.3.5. Italy Ginger Ale Regional Analysis and Outlook
8.3.6. Russia Ginger Ale Regional Analysis and Outlook
8.3.7. Rest of Europe Ginger Ale Regional Analysis and Outlook
8.4. Asia Pacific Ginger Ale Revenue (USD Million) by Country (2021-2032)
8.4.1. China Ginger Ale Regional Analysis and Outlook
8.4.2. Japan Ginger Ale Regional Analysis and Outlook
8.4.3. India Ginger Ale Regional Analysis and Outlook
8.4.4. South Korea Ginger Ale Regional Analysis and Outlook
8.4.5. Australia Ginger Ale Regional Analysis and Outlook
8.4.6. South East Asia Ginger Ale Regional Analysis and Outlook
8.4.7. Rest of Asia Pacific Ginger Ale Regional Analysis and Outlook
8.5. South America Ginger Ale Revenue (USD Million), by Country (2021-2032)
8.5.1. Brazil Ginger Ale Regional Analysis and Outlook
8.5.2. Argentina Ginger Ale Regional Analysis and Outlook
8.5.3. Rest of South America Ginger Ale Regional Analysis and Outlook
8.6. Middle East and Africa Ginger Ale Revenue (USD Million) by Country (2021-2032)
8.6.1. Middle East Ginger Ale Regional Analysis and Outlook
8.6.2. Africa Ginger Ale Regional Analysis and Outlook
Chapter 9. North America Ginger Ale Analysis and Outlook
9.1. North America Ginger Ale Revenue (USD Million) by Segments (2021-2032)
9.1.1. North America Ginger Ale Revenue (USD Million) by Type (2021-2032)
9.1.2. North America Ginger Ale Revenue (USD Million) by Application (2021-2032)
9.1.3. North America Ginger Ale Revenue (USD Million) by Product (2021-2032)
By Type
Golden Ginger Ale
Dry Ginger Ale
By Distribution Channel
Convenience Stores
Hypermarkets/Supermarkets
Specialty Stores
Online
Others
Chapter 10. Europe Ginger Ale Analysis and Outlook
10.1. Europe Ginger Ale Revenue (USD Million), by Segments (USD Million) (2021-2032)
10.1.1. Europe Ginger Ale Revenue (USD Million) by Type (2021-2032)
10.1.2. Europe Ginger Ale Revenue (USD Million) by Application (2021-2032)
10.1.3. Europe Ginger Ale Revenue (USD Million) by Product (2021-2032)
By Type
Golden Ginger Ale
Dry Ginger Ale
By Distribution Channel
Convenience Stores
Hypermarkets/Supermarkets
Specialty Stores
Online
Others
Chapter 11. Asia Pacific Ginger Ale Analysis and Outlook
11.1. Asia Pacific Ginger Ale Revenue (USD Million), and Revenue (USD Million) by Segments (2021-2032)
11.1.1. Asia Pacific Ginger Ale Revenue (USD Million) by Type (2021-2032)
11.1.2. Asia Pacific Ginger Ale Revenue (USD Million) by Application (2021-2032)
11.1.3. Asia Pacific Ginger Ale Revenue (USD Million) by Product (2021-2032)
By Type
Golden Ginger Ale
Dry Ginger Ale
By Distribution Channel
Convenience Stores
Hypermarkets/Supermarkets
Specialty Stores
Online
Others
Chapter 12. South America Ginger Ale Analysis and Outlook
12.1. South America Ginger Ale Revenue (USD Million), by Segments (2021-2032)
12.1.1. South America Ginger Ale Revenue (USD Million) by Type (2021-2032)
12.1.2. South America Ginger Ale Revenue (USD Million) by Application (2021-2032)
12.1.3. South America Ginger Ale Revenue (USD Million) by Product (2021-2032)
By Type
Golden Ginger Ale
Dry Ginger Ale
By Distribution Channel
Convenience Stores
Hypermarkets/Supermarkets
Specialty Stores
Online
Others
Chapter 13. Middle East and Africa Ginger Ale Analysis and Outlook
13.1. Middle East and Africa Ginger Ale Revenue (USD Million), by Segments (2021-2032)
13.1.1. Middle East and Africa Ginger Ale Revenue (USD Million) by Type (2021-2032)
13.1.2. Middle East and Africa Ginger Ale Revenue (USD Million) by Application (2021-2032)
13.1.3. Middle East and Africa Ginger Ale Revenue (USD Million) by Product (2021-2032)
By Type
Golden Ginger Ale
Dry Ginger Ale
By Distribution Channel
Convenience Stores
Hypermarkets/Supermarkets
Specialty Stores
Online
Others
Chapter 14. Ginger Ale Company Profiles
14.1 Business Overview
14.2 Product Profiles
14.3 SWOT Profiles
14.5 Recent Developments
14.6 Financial Profile
List of Companies
A-Treat Bottling Company
Boylan Bottling Co.
Boylan Heritage LLC
Bruce Cost Fresh LLC
Buffalo Rock Company
Bundaberg Brewed Drinks Pty Ltd
Dr Pepper/Seven Up Inc
Fentimans Ltd
Fever-Tree Ltd
Hansen's Natural Corp
Harney & Sons LLC
Honest Tea Inc
Jones Soda Co.
Polar Beverages
Red Rock Cola Inc
Reed's Inc
Schweppes International Ltd
Seagram Company Ltd
Thomas Henry GmbH & Co. KG
Vernors and Hansen Natural Corp
White Rock Beverages Inc
Zevia LLC
15. Methodology and Data Sources
15.1 Customization Offerings
15.2 Subscription Services
15.3 Related Reports
15.4 Publisher Expertise
LIST OF TABLES
Table 1 Market Segmentation Analysis
Table 2 Global Ginger Ale Market Share of Leading Companies, 2023
Table 3 Product Offerings of Leading Companies
Table 4 Low Growth Scenario Forecasts
Table 5 Reference Case Growth Scenario
Table 6 High Growth Case Scenario
Table 7 Global Ginger Ale Revenue (USD Million) And CAGR (%) By Type (2021-2032)
Table 8 Global Ginger Ale Revenue (USD Million) And CAGR (%) By Application (2021-2032)
Table 9 Global Ginger Ale Revenue (USD Million) And CAGR (%) By Product (2021-2032)
Table 10 Global Ginger Ale Market Revenue (USD Million) By Regions (2021-2032)
Table 11 Global Ginger Ale Market Share (%) By Regions (2021-2032)
Table 12 North America Ginger Ale Revenue (USD Million) By Country (2021-2032)
Table 13 Europe Ginger Ale Revenue (USD Million) By Country (2021-2032)
Table 14 Asia Pacific Ginger Ale Revenue (USD Million) By Country (2021-2032)
Table 15 South America Ginger Ale Revenue (USD Million) By Country (2021-2032)
Table 16 Middle East and Africa Ginger Ale Revenue (USD Million) By Region (2021-2032)
Table 17 North America Ginger Ale Revenue (USD Million) By Type (2021-2032)
Table 18 North America Ginger Ale Revenue (USD Million) By Application (2021-2032)
Table 19 North America Ginger Ale Revenue (USD Million) By Product (2021-2032)
Table 20 Europe Ginger Ale Revenue (USD Million) By Type (2021-2032)
Table 21 Europe Ginger Ale Revenue (USD Million) By Application (2021-2032)
Table 22 Europe Ginger Ale Revenue (USD Million) By Product (2021-2032)
Table 23 Asia Pacific Ginger Ale Revenue (USD Million) By Type (2021-2032)
Table 24 Asia Pacific Ginger Ale Revenue (USD Million) By Application (2021-2032)
Table 25 Asia Pacific Ginger Ale Revenue (USD Million) By Product (2021-2032)
Table 26 South America Ginger Ale Revenue (USD Million) By Type (2021-2032)
Table 27 South America Ginger Ale Revenue (USD Million) By Application (2021-2032)
Table 28 South America Ginger Ale Revenue (USD Million) By Product (2021-2032)
Table 29 Middle East and Africa Ginger Ale Revenue (USD Million) By Type (2021-2032)
Table 30 Middle East and Africa Ginger Ale Revenue (USD Million) By Application (2021-2032)
Table 31 Middle East and Africa Ginger Ale Revenue (USD Million) By Product (2021-2032)
LIST OF FIGURES
Figure 1. Market Scope
Figure 2. Pricing Forecasts Per Unit, 2023- 2032
Figure 3. Porter’s Five Forces
Figure 4. Global Ginger Ale Market Revenue (USD Million) By Regions (2021-2032)
Figure 5. Global Ginger Ale Market Share (%) By Regions (2023)
Figure 6. North America Ginger Ale Revenue (USD Million) By Country (2021-2032)
Figure 7. United States Ginger Ale Revenue (USD Million) By Country (2021-2032)
Figure 8. Canada Ginger Ale Revenue (USD Million) By Country (2021-2032)
Figure 9. Mexico Ginger Ale Revenue (USD Million) By Country (2021-2032)
Figure 10. Europe Ginger Ale Revenue (USD Million) By Country (2021-2032)
Figure 11. Germany Ginger Ale Revenue (USD Million) By Country (2021-2032)
Figure 12. France Ginger Ale Revenue (USD Million) By Country (2021-2032)
Figure 13. United Kingdom Ginger Ale Revenue (USD Million) By Country (2021-2032)
Figure 14. Spain Ginger Ale Revenue (USD Million) By Country (2021-2032)
Figure 15. Italy Ginger Ale Revenue (USD Million) By Country (2021-2032)
Figure 16. Russia Ginger Ale Revenue (USD Million) By Country (2021-2032)
Figure 17. Rest of Europe Ginger Ale Revenue (USD Million) By Country (2021-2032)
Figure 11. Asia Pacific Ginger Ale Revenue (USD Million) By Country (2021-2032)
Figure 12. China Ginger Ale Revenue (USD Million) By Country (2021-2032)
Figure 13. Japan Ginger Ale Revenue (USD Million) By Country (2021-2032)
Figure 14. India Ginger Ale Revenue (USD Million) By Country (2021-2032)
Figure 15. South Korea Ginger Ale Revenue (USD Million) By Country (2021-2032)
Figure 16. Australia Ginger Ale Revenue (USD Million) By Country (2021-2032)
Figure 17. South East Asia Ginger Ale Revenue (USD Million) By Country (2021-2032)
Figure 18. South America Ginger Ale Revenue (USD Million) By Country (2021-2032)
Figure 19. Brazil Ginger Ale Revenue (USD Million) By Country (2021-2032)
Figure 20. Argentina Ginger Ale Revenue (USD Million) By Country (2021-2032)
Figure 21. Rest of Asia Pacific Ginger Ale Revenue (USD Million) By Country (2021-2032)
Figure 22. Middle East and Africa Ginger Ale Revenue (USD Million) By Region (2021-2032)
Figure 23. Saudi Arabia Ginger Ale Revenue (USD Million) By Region (2021-2032)
Figure 24. The UAE Ginger Ale Revenue (USD Million) By Region (2021-2032)
Figure 25. Rest of Middle East Ginger Ale Revenue (USD Million) By Region (2021-2032)
Figure 26. South Africa Ginger Ale Revenue (USD Million) By Region (2021-2032)
Figure 27. Africa Ginger Ale Revenue (USD Million) By Region (2021-2032)
Figure 28. North America Ginger Ale Revenue (USD Million) By Type (2021-2032)
Figure 29. North America Ginger Ale Revenue (USD Million) By Application (2021-2032)
Figure 30. North America Ginger Ale Revenue (USD Million) By Product (2021-2032)
Figure 31. Europe Ginger Ale Revenue (USD Million) By Type (2021-2032)
Figure 32. Europe Ginger Ale Revenue (USD Million) By Application (2021-2032)
Figure 33. Europe Ginger Ale Revenue (USD Million) By Product (2021-2032)
Figure 34. Asia Pacific Ginger Ale Revenue (USD Million) By Type (2021-2032)
Figure 35. Asia Pacific Ginger Ale Revenue (USD Million) By Application (2021-2032)
Figure 36. Asia Pacific Ginger Ale Revenue (USD Million) By Product (2021-2032)
Figure 37. South America Ginger Ale Revenue (USD Million) By Type (2021-2032)
Figure 38. South America Ginger Ale Revenue (USD Million) By Application (2021-2032)
Figure 39. South America Ginger Ale Revenue (USD Million) By Product (2021-2032)
Figure 40. Middle East and Africa Ginger Ale Revenue (USD Million) By Type (2021-2032)
Figure 41. Middle East and Africa Ginger Ale Revenue (USD Million) By Application (2021-2032)
Figure 42. Middle East and Africa Ginger Ale Revenue (USD Million) By Product (2021-2032)
By Type
Golden Ginger Ale
Dry Ginger Ale
By Distribution Channel
Convenience Stores
Hypermarkets/Supermarkets
Specialty Stores
Online
Others
Countries Analyzed
North America (US, Canada, Mexico)
Europe (Germany, UK, France, Spain, Italy, Russia, Rest of Europe)
Asia Pacific (China, India, Japan, South Korea, Australia, South East Asia, Rest of Asia)
South America (Brazil, Argentina, Rest of South America)
Middle East and Africa (Saudi Arabia, UAE, Rest of Middle East, South Africa, Egypt, Rest of Africa)
