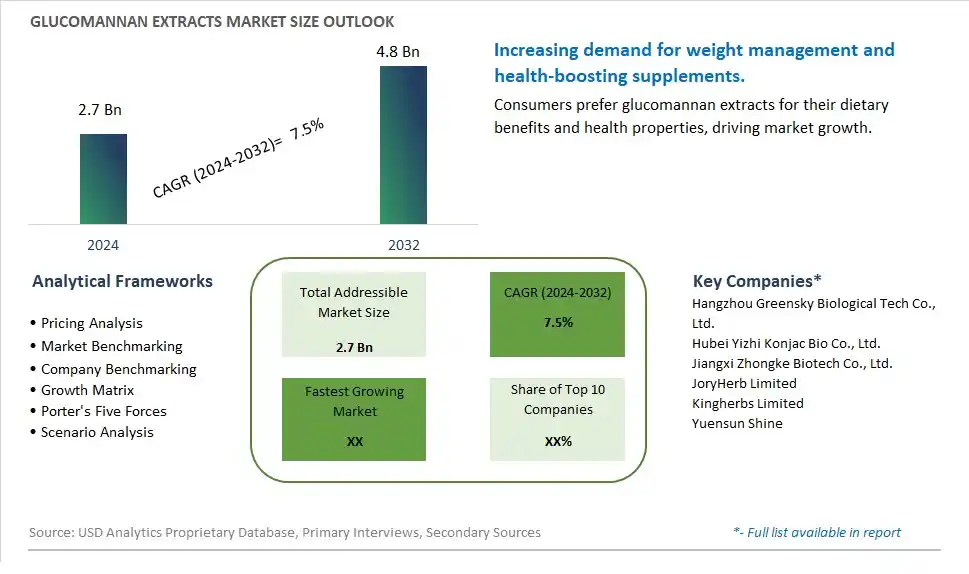
Global Glucomannan Extracts Market Size is valued at $2.7 Billion in 2024 and is forecast to register a growth rate (CAGR) of 7.5% to reach $4.8 Billion by 2032.
The global Glucomannan Extracts Market Comprehensive Study analyzes and forecasts the market size across 6 regions and 24 countries for diverse segments -By Product (Glucomannan 75%, Glucomannan 80%, Glucomannan 90%), By Application (Foods, Pharmaceuticals, Healthy Products)
An Introduction to Glucomannan Extracts Market
The Glucomannan Extracts market in 2024 is experiencing significant growth, driven by the rising demand for natural dietary fibers and weight management supplements. Glucomannan, derived from the root of the konjac plant, is known for its high fiber content and water-absorbing properties. The market benefits from advancements in extraction and formulation technologies, the growing trend of health and wellness, and the expansion of the functional food and dietary supplement sectors. Additionally, the increasing awareness of the benefits of glucomannan for digestive health and weight management is contributing to market growth.
Glucomannan Extracts Competitive Landscape
The market report analyses the leading companies in the industry including Hangzhou Greensky Biological Tech Co., Ltd., Hubei Yizhi Konjac Bio Co., Ltd., Jiangxi Zhongke Biotech Co., Ltd., JoryHerb Limited, Kingherbs Limited, Yuensun Shine, and Others.
Glucomannan Extracts Market Dynamics
Glucomannan Extracts Market Trend: Rising Demand for Natural Weight Management Solutions
The most prominent trend in the Glucomannan Extracts Market is the rising demand for natural weight management solutions. As consumers seek safe and effective ways to manage their weight, glucomannan extracts, derived from the konjac plant, are gaining popularity for their ability to promote satiety and support digestive health. This trend is driven by the growing interest in natural and holistic approaches to weight management.
Glucomannan Extracts Market Driver: Increase in Health and Wellness Consciousness
The key driver of the Glucomannan Extracts Market is the increase in health and wellness consciousness. As more consumers focus on maintaining a healthy lifestyle and managing their weight, there is a higher demand for supplements and foods that incorporate glucomannan extracts. This driver is supported by the trend towards functional foods and dietary supplements that offer specific health benefits, driving market growth for glucomannan extracts.
Glucomannan Extracts Market Opportunity: Expansion into Functional Foods and Beverages
A significant opportunity in the Glucomannan Extracts Market lies in the expansion into functional foods and beverages. By developing products that combine glucomannan extracts with other health-promoting ingredients, companies can attract health-conscious consumers looking for convenient ways to support their weight management goals. Offering innovative glucomannan-infused products, such as snacks, meal replacements, and beverages, can help expand market reach and drive growth in the functional food sector.
Glucomannan Extracts Market Share Analysis: Glucomannan 80% segment generated the highest revenue share in the industry
Glucomannan 80% emerges as the largest segment within the Glucomannan Extracts market. This particular concentration of glucomannan extract is highly sought after due to its balance between potency and usability in various applications. Glucomannan, derived from the konjac root, is renowned for its water-absorbing properties and its role as a dietary fiber supplement. The 80% concentration offers optimal viscosity and gel-forming capabilities, making it ideal for use in food products, dietary supplements, and pharmaceutical formulations aimed at promoting weight loss, digestive health, and cholesterol management. The segment's growth is driven by increasing consumer awareness of glucomannan's health benefits, including its ability to aid in weight management by promoting feelings of fullness and supporting regular bowel movements. Manufacturers are investing in research and development to innovate new products incorporating Glucomannan 80%, ensuring compliance with regulatory standards and meeting the growing demand for natural, functional ingredients in the health and wellness sector. As dietary trends continue to emphasize fiber-rich diets and holistic approaches to wellness, Glucomannan 80% remains pivotal in driving market growth and meeting consumer preferences for effective dietary supplements and functional foods.
Glucomannan Extracts Market Share Analysis: Healthy Products is the fastest growing segment over the forecast period to 2032
The Healthy Products segment is anticipated to be the fastest-growing application within the Glucomannan Extracts market through 2032. This growth is driven by increasing consumer demand for natural and functional ingredients that promote overall health and wellness. Glucomannan extracts, known for their soluble fiber content and beneficial effects on digestion and weight management, are increasingly incorporated into a wide range of healthy products. These include dietary supplements, meal replacements, functional beverages, and organic snacks aimed at supporting weight loss, digestive health, and blood sugar control. The segment's expansion is further fueled by shifting consumer preferences towards clean label products and sustainable lifestyles, driving innovation in product formulations that include Glucomannan extracts. Manufacturers are focusing on enhancing product efficacy, taste, and texture while ensuring compliance with regulatory standards and addressing consumer concerns about ingredient transparency. As the global health and wellness trend continues to grow, the Healthy Products segment in the Glucomannan Extracts market presents significant opportunities for market players to capitalize on the increasing demand for natural, functional ingredients that contribute to overall well-being.
Glucomannan Extracts Market Segmentation
By Product
Glucomannan 75%
Glucomannan 80%
Glucomannan 90%
By Application
Foods
Pharmaceuticals
Healthy Products
Countries Analyzed
North America (US, Canada, Mexico)
Europe (Germany, UK, France, Spain, Italy, Russia, Rest of Europe)
Asia Pacific (China, India, Japan, South Korea, Australia, South East Asia, Rest of Asia)
South America (Brazil, Argentina, Rest of South America)
Middle East and Africa (Saudi Arabia, UAE, Rest of Middle East, South Africa, Egypt, Rest of Africa)
Glucomannan Extracts Companies Profiled in the Study
Hangzhou Greensky Biological Tech Co., Ltd.
Hubei Yizhi Konjac Bio Co., Ltd.
Jiangxi Zhongke Biotech Co., Ltd.
JoryHerb Limited
Kingherbs Limited
Yuensun Shine
*- List Not Exhaustive
Chapter 1. TABLE OF CONTENTS
Chapter 2. Introduction to Glucomannan Extracts Market
2.1. Market Overview
2.2. Key Statistics and Report Highlights
2.3. Scope of the Comprehensive Study
2.3.1. Market Definition
2.3.2 Countries and Regions Covered
2.3.3 Research Objective
2.3.4 Units, Currency, and Conversions
2.3.5 Industry Value Chain
2.4. Key Market Segments
2.5. Key Companies
2.6. Study Period
Chapter 3. Strategic Analysis Review
3.1. Glucomannan Extracts Pricing Analysis and Forecast
3.2. Porter’s Five Forces
3.3. Market Ecosystem
3.4. SWOT Analysis
3.5. Regulatory Scenario
3.3. Effects of Inflation, Russia-Ukraine War, moderating economic growth, and other macroeconomic factors
Chapter 4. Competitive Landscape
4.1. Market Share Analysis
4.1.1. Global Glucomannan Extracts Market Share by Company, 2023
4.1.2. Product Offerings of Leading Glucomannan Extracts Companies
4.2. Market Entropy
4.2.1. New Product Launches in the Industry
4.2.2. Mergers, Acquisitions, Joint ventures, and Partnerships
4.3. Key Strategies and Best Practices
Chapter 5. Global Market Projections: Best, Reference, and Low Case Scenarios
5.1. Growth Analysis- Case Scenario Definitions
5.2. Low Growth Case Scenario Forecasts
5.3. Reference Growth Case Scenario Forecasts
5.4. High Growth Case Scenario Forecasts
Chapter 6. Market Dynamics
6.1. Glucomannan Extracts Market Drivers
6.2. Glucomannan Extracts Market Challenges
6.6. Glucomannan Extracts Market Opportunities
6.4. Glucomannan Extracts Market Trends
Chapter 7. Global Glucomannan Extracts Market Outlook Trends
7.1. Global Glucomannan Extracts Revenue (USD Million) and CAGR (%) by Type (2021-2032)
7.2. Global Glucomannan Extracts Revenue (USD Million) and CAGR (%) by Application (2021-2032)
7.3. Global Glucomannan Extracts Revenue (USD Million) and CAGR (%) by Product (2021-2032)
By Product
Glucomannan 75%
Glucomannan 80%
Glucomannan 90%
By Application
Foods
Pharmaceuticals
Healthy Products
Chapter 8. Global Glucomannan Extracts Regional Analysis and Outlook
8.1. Global Glucomannan Extracts Revenue (USD Million) By Regions (2021- 2032)
8.2. North America Glucomannan Extracts Revenue (USD Million) by Country (2021-2032)
8.2.1. United States Glucomannan Extracts Regional Analysis and Outlook
8.2.2. Canada Glucomannan Extracts Regional Analysis and Outlook
8.2.3. Mexico Glucomannan Extracts Regional Analysis and Outlook
8.3. Europe Glucomannan Extracts Revenue (USD Million), by Country (2021-2032)
8.3.1. Germany Glucomannan Extracts Regional Analysis and Outlook
8.3.2. France Glucomannan Extracts Regional Analysis and Outlook
8.3.3. United Kingdom Glucomannan Extracts Regional Analysis and Outlook
8.3.4. Spain Glucomannan Extracts Regional Analysis and Outlook
8.3.5. Italy Glucomannan Extracts Regional Analysis and Outlook
8.3.6. Russia Glucomannan Extracts Regional Analysis and Outlook
8.3.7. Rest of Europe Glucomannan Extracts Regional Analysis and Outlook
8.4. Asia Pacific Glucomannan Extracts Revenue (USD Million) by Country (2021-2032)
8.4.1. China Glucomannan Extracts Regional Analysis and Outlook
8.4.2. Japan Glucomannan Extracts Regional Analysis and Outlook
8.4.3. India Glucomannan Extracts Regional Analysis and Outlook
8.4.4. South Korea Glucomannan Extracts Regional Analysis and Outlook
8.4.5. Australia Glucomannan Extracts Regional Analysis and Outlook
8.4.6. South East Asia Glucomannan Extracts Regional Analysis and Outlook
8.4.7. Rest of Asia Pacific Glucomannan Extracts Regional Analysis and Outlook
8.5. South America Glucomannan Extracts Revenue (USD Million), by Country (2021-2032)
8.5.1. Brazil Glucomannan Extracts Regional Analysis and Outlook
8.5.2. Argentina Glucomannan Extracts Regional Analysis and Outlook
8.5.3. Rest of South America Glucomannan Extracts Regional Analysis and Outlook
8.6. Middle East and Africa Glucomannan Extracts Revenue (USD Million) by Country (2021-2032)
8.6.1. Middle East Glucomannan Extracts Regional Analysis and Outlook
8.6.2. Africa Glucomannan Extracts Regional Analysis and Outlook
Chapter 9. North America Glucomannan Extracts Analysis and Outlook
9.1. North America Glucomannan Extracts Revenue (USD Million) by Segments (2021-2032)
9.1.1. North America Glucomannan Extracts Revenue (USD Million) by Type (2021-2032)
9.1.2. North America Glucomannan Extracts Revenue (USD Million) by Application (2021-2032)
9.1.3. North America Glucomannan Extracts Revenue (USD Million) by Product (2021-2032)
By Product
Glucomannan 75%
Glucomannan 80%
Glucomannan 90%
By Application
Foods
Pharmaceuticals
Healthy Products
Chapter 10. Europe Glucomannan Extracts Analysis and Outlook
10.1. Europe Glucomannan Extracts Revenue (USD Million), by Segments (USD Million) (2021-2032)
10.1.1. Europe Glucomannan Extracts Revenue (USD Million) by Type (2021-2032)
10.1.2. Europe Glucomannan Extracts Revenue (USD Million) by Application (2021-2032)
10.1.3. Europe Glucomannan Extracts Revenue (USD Million) by Product (2021-2032)
By Product
Glucomannan 75%
Glucomannan 80%
Glucomannan 90%
By Application
Foods
Pharmaceuticals
Healthy Products
Chapter 11. Asia Pacific Glucomannan Extracts Analysis and Outlook
11.1. Asia Pacific Glucomannan Extracts Revenue (USD Million), and Revenue (USD Million) by Segments (2021-2032)
11.1.1. Asia Pacific Glucomannan Extracts Revenue (USD Million) by Type (2021-2032)
11.1.2. Asia Pacific Glucomannan Extracts Revenue (USD Million) by Application (2021-2032)
11.1.3. Asia Pacific Glucomannan Extracts Revenue (USD Million) by Product (2021-2032)
By Product
Glucomannan 75%
Glucomannan 80%
Glucomannan 90%
By Application
Foods
Pharmaceuticals
Healthy Products
Chapter 12. South America Glucomannan Extracts Analysis and Outlook
12.1. South America Glucomannan Extracts Revenue (USD Million), by Segments (2021-2032)
12.1.1. South America Glucomannan Extracts Revenue (USD Million) by Type (2021-2032)
12.1.2. South America Glucomannan Extracts Revenue (USD Million) by Application (2021-2032)
12.1.3. South America Glucomannan Extracts Revenue (USD Million) by Product (2021-2032)
By Product
Glucomannan 75%
Glucomannan 80%
Glucomannan 90%
By Application
Foods
Pharmaceuticals
Healthy Products
Chapter 13. Middle East and Africa Glucomannan Extracts Analysis and Outlook
13.1. Middle East and Africa Glucomannan Extracts Revenue (USD Million), by Segments (2021-2032)
13.1.1. Middle East and Africa Glucomannan Extracts Revenue (USD Million) by Type (2021-2032)
13.1.2. Middle East and Africa Glucomannan Extracts Revenue (USD Million) by Application (2021-2032)
13.1.3. Middle East and Africa Glucomannan Extracts Revenue (USD Million) by Product (2021-2032)
By Product
Glucomannan 75%
Glucomannan 80%
Glucomannan 90%
By Application
Foods
Pharmaceuticals
Healthy Products
Chapter 14. Glucomannan Extracts Company Profiles
14.1 Business Overview
14.2 Product Profiles
14.3 SWOT Profiles
14.5 Recent Developments
14.6 Financial Profile
List of Companies
Hangzhou Greensky Biological Tech Co., Ltd.
Hubei Yizhi Konjac Bio Co., Ltd.
Jiangxi Zhongke Biotech Co., Ltd.
JoryHerb Limited
Kingherbs Limited
Yuensun Shine
15. Methodology and Data Sources
15.1 Customization Offerings
15.2 Subscription Services
15.3 Related Reports
15.4 Publisher Expertise
LIST OF TABLES
Table 1 Market Segmentation Analysis
Table 2 Global Glucomannan Extracts Market Share of Leading Companies, 2023
Table 3 Product Offerings of Leading Companies
Table 4 Low Growth Scenario Forecasts
Table 5 Reference Case Growth Scenario
Table 6 High Growth Case Scenario
Table 7 Global Glucomannan Extracts Revenue (USD Million) And CAGR (%) By Type (2021-2032)
Table 8 Global Glucomannan Extracts Revenue (USD Million) And CAGR (%) By Application (2021-2032)
Table 9 Global Glucomannan Extracts Revenue (USD Million) And CAGR (%) By Product (2021-2032)
Table 10 Global Glucomannan Extracts Market Revenue (USD Million) By Regions (2021-2032)
Table 11 Global Glucomannan Extracts Market Share (%) By Regions (2021-2032)
Table 12 North America Glucomannan Extracts Revenue (USD Million) By Country (2021-2032)
Table 13 Europe Glucomannan Extracts Revenue (USD Million) By Country (2021-2032)
Table 14 Asia Pacific Glucomannan Extracts Revenue (USD Million) By Country (2021-2032)
Table 15 South America Glucomannan Extracts Revenue (USD Million) By Country (2021-2032)
Table 16 Middle East and Africa Glucomannan Extracts Revenue (USD Million) By Region (2021-2032)
Table 17 North America Glucomannan Extracts Revenue (USD Million) By Type (2021-2032)
Table 18 North America Glucomannan Extracts Revenue (USD Million) By Application (2021-2032)
Table 19 North America Glucomannan Extracts Revenue (USD Million) By Product (2021-2032)
Table 20 Europe Glucomannan Extracts Revenue (USD Million) By Type (2021-2032)
Table 21 Europe Glucomannan Extracts Revenue (USD Million) By Application (2021-2032)
Table 22 Europe Glucomannan Extracts Revenue (USD Million) By Product (2021-2032)
Table 23 Asia Pacific Glucomannan Extracts Revenue (USD Million) By Type (2021-2032)
Table 24 Asia Pacific Glucomannan Extracts Revenue (USD Million) By Application (2021-2032)
Table 25 Asia Pacific Glucomannan Extracts Revenue (USD Million) By Product (2021-2032)
Table 26 South America Glucomannan Extracts Revenue (USD Million) By Type (2021-2032)
Table 27 South America Glucomannan Extracts Revenue (USD Million) By Application (2021-2032)
Table 28 South America Glucomannan Extracts Revenue (USD Million) By Product (2021-2032)
Table 29 Middle East and Africa Glucomannan Extracts Revenue (USD Million) By Type (2021-2032)
Table 30 Middle East and Africa Glucomannan Extracts Revenue (USD Million) By Application (2021-2032)
Table 31 Middle East and Africa Glucomannan Extracts Revenue (USD Million) By Product (2021-2032)
LIST OF FIGURES
Figure 1. Market Scope
Figure 2. Pricing Forecasts Per Unit, 2023- 2032
Figure 3. Porter’s Five Forces
Figure 4. Global Glucomannan Extracts Market Revenue (USD Million) By Regions (2021-2032)
Figure 5. Global Glucomannan Extracts Market Share (%) By Regions (2023)
Figure 6. North America Glucomannan Extracts Revenue (USD Million) By Country (2021-2032)
Figure 7. United States Glucomannan Extracts Revenue (USD Million) By Country (2021-2032)
Figure 8. Canada Glucomannan Extracts Revenue (USD Million) By Country (2021-2032)
Figure 9. Mexico Glucomannan Extracts Revenue (USD Million) By Country (2021-2032)
Figure 10. Europe Glucomannan Extracts Revenue (USD Million) By Country (2021-2032)
Figure 11. Germany Glucomannan Extracts Revenue (USD Million) By Country (2021-2032)
Figure 12. France Glucomannan Extracts Revenue (USD Million) By Country (2021-2032)
Figure 13. United Kingdom Glucomannan Extracts Revenue (USD Million) By Country (2021-2032)
Figure 14. Spain Glucomannan Extracts Revenue (USD Million) By Country (2021-2032)
Figure 15. Italy Glucomannan Extracts Revenue (USD Million) By Country (2021-2032)
Figure 16. Russia Glucomannan Extracts Revenue (USD Million) By Country (2021-2032)
Figure 17. Rest of Europe Glucomannan Extracts Revenue (USD Million) By Country (2021-2032)
Figure 11. Asia Pacific Glucomannan Extracts Revenue (USD Million) By Country (2021-2032)
Figure 12. China Glucomannan Extracts Revenue (USD Million) By Country (2021-2032)
Figure 13. Japan Glucomannan Extracts Revenue (USD Million) By Country (2021-2032)
Figure 14. India Glucomannan Extracts Revenue (USD Million) By Country (2021-2032)
Figure 15. South Korea Glucomannan Extracts Revenue (USD Million) By Country (2021-2032)
Figure 16. Australia Glucomannan Extracts Revenue (USD Million) By Country (2021-2032)
Figure 17. South East Asia Glucomannan Extracts Revenue (USD Million) By Country (2021-2032)
Figure 18. South America Glucomannan Extracts Revenue (USD Million) By Country (2021-2032)
Figure 19. Brazil Glucomannan Extracts Revenue (USD Million) By Country (2021-2032)
Figure 20. Argentina Glucomannan Extracts Revenue (USD Million) By Country (2021-2032)
Figure 21. Rest of Asia Pacific Glucomannan Extracts Revenue (USD Million) By Country (2021-2032)
Figure 22. Middle East and Africa Glucomannan Extracts Revenue (USD Million) By Region (2021-2032)
Figure 23. Saudi Arabia Glucomannan Extracts Revenue (USD Million) By Region (2021-2032)
Figure 24. The UAE Glucomannan Extracts Revenue (USD Million) By Region (2021-2032)
Figure 25. Rest of Middle East Glucomannan Extracts Revenue (USD Million) By Region (2021-2032)
Figure 26. South Africa Glucomannan Extracts Revenue (USD Million) By Region (2021-2032)
Figure 27. Africa Glucomannan Extracts Revenue (USD Million) By Region (2021-2032)
Figure 28. North America Glucomannan Extracts Revenue (USD Million) By Type (2021-2032)
Figure 29. North America Glucomannan Extracts Revenue (USD Million) By Application (2021-2032)
Figure 30. North America Glucomannan Extracts Revenue (USD Million) By Product (2021-2032)
Figure 31. Europe Glucomannan Extracts Revenue (USD Million) By Type (2021-2032)
Figure 32. Europe Glucomannan Extracts Revenue (USD Million) By Application (2021-2032)
Figure 33. Europe Glucomannan Extracts Revenue (USD Million) By Product (2021-2032)
Figure 34. Asia Pacific Glucomannan Extracts Revenue (USD Million) By Type (2021-2032)
Figure 35. Asia Pacific Glucomannan Extracts Revenue (USD Million) By Application (2021-2032)
Figure 36. Asia Pacific Glucomannan Extracts Revenue (USD Million) By Product (2021-2032)
Figure 37. South America Glucomannan Extracts Revenue (USD Million) By Type (2021-2032)
Figure 38. South America Glucomannan Extracts Revenue (USD Million) By Application (2021-2032)
Figure 39. South America Glucomannan Extracts Revenue (USD Million) By Product (2021-2032)
Figure 40. Middle East and Africa Glucomannan Extracts Revenue (USD Million) By Type (2021-2032)
Figure 41. Middle East and Africa Glucomannan Extracts Revenue (USD Million) By Application (2021-2032)
Figure 42. Middle East and Africa Glucomannan Extracts Revenue (USD Million) By Product (2021-2032)
By Product
Glucomannan 75%
Glucomannan 80%
Glucomannan 90%
By Application
Foods
Pharmaceuticals
Healthy Products
Countries Analyzed
North America (US, Canada, Mexico)
Europe (Germany, UK, France, Spain, Italy, Russia, Rest of Europe)
Asia Pacific (China, India, Japan, South Korea, Australia, South East Asia, Rest of Asia)
South America (Brazil, Argentina, Rest of South America)
Middle East and Africa (Saudi Arabia, UAE, Rest of Middle East, South Africa, Egypt, Rest of Africa)
