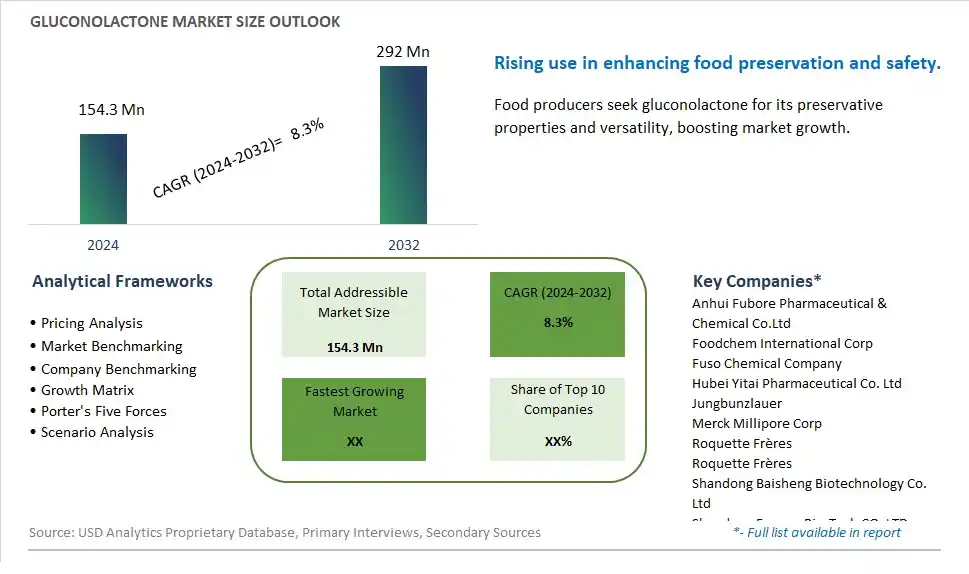
Global Gluconolactone Market Size is valued at $154.3 Million in 2024 and is forecast to register a growth rate (CAGR) of 8.3% to reach $292 Million by 2032.
The global Gluconolactone Market Comprehensive Study analyzes and forecasts the market size across 6 regions and 24 countries for diverse segments -By Source (Synthetic, Non- Synthetic), By Grade (97 to 100%, 100 to 102%), By End-User (Dietary Supplements, Pharmaceutical, Cosmetics, Energy Drinks, Food)
An Introduction to Gluconolactone Market
In 2024, the Gluconolactone market is thriving, fueled by the rising demand for multifunctional ingredients in food, cosmetics, and pharmaceuticals. Gluconolactone, known for its mild exfoliating and moisturizing properties, is used in skincare products, food preservation, and pharmaceuticals. The market benefits from advancements in chemical synthesis and formulation technologies, the growing trend of clean label and natural ingredients, and the expansion of the global cosmetics and food sectors. Additionally, the increasing awareness of the benefits of gluconolactone for skin health and food safety is driving market growth.
Gluconolactone Competitive Landscape
The market report analyses the leading companies in the industry including Anhui Fubore Pharmaceutical & Chemical Co.Ltd, Foodchem International Corp, Fuso Chemical Company, Hubei Yitai Pharmaceutical Co. Ltd, Jungbunzlauer, Merck Millipore Corp, Roquette Frères, Roquette Frères, Shandong Baisheng Biotechnology Co. Ltd, Shandong Fuyuan Bio-Tech CO. LTD, Shaoxing Marina Biotechnology Co. Ltd, Sigma Aldrich, Xinhong Pharmaceutical, Yuanming Group, and Others.
Gluconolactone Market Dynamics
Gluconolactone Market Trend: Increasing Use of Natural Preservatives in Food and Cosmetics
The most prominent trend in the Gluconolactone Market is the increasing use of natural preservatives in food and cosmetics. As consumers become more aware of the potential health risks associated with synthetic additives, there is a growing demand for natural alternatives like gluconolactone, which offers antimicrobial and preservative properties. This trend is driven by the desire for clean-label products that are safe and effective.
Gluconolactone Market Driver: Growth in Natural and Organic Products
The key driver of the Gluconolactone Market is the growth in natural and organic products. As more consumers seek out products that are free from synthetic chemicals and additives, there is a higher demand for natural preservatives like gluconolactone. This driver is supported by the trend towards natural and organic foods and cosmetics, driving market growth for gluconolactone as a preferred preservative ingredient.
Gluconolactone Market Opportunity: Development of Multifunctional Ingredient Applications
A significant opportunity in the Gluconolactone Market lies in the development of multifunctional ingredient applications. By exploring new ways to incorporate gluconolactone into various food and cosmetic products, companies can enhance product quality and functionality. Offering gluconolactone as a multifunctional ingredient that provides preservation, pH regulation, and skin conditioning benefits can help expand market reach and drive growth in multiple sectors.
Gluconolactone Market Share Analysis: Synthetic segment generated the highest revenue share in the industry
The Synthetic Gluconolactone segment is identified as the largest within the Gluconolactone market. This segment's dominance is primarily attributed to its widespread use in various industrial and pharmaceutical applications. Synthetic gluconolactone is chemically produced through the oxidation of glucose and is valued for its versatility as a chelating agent, acidulant, and skin conditioning agent in cosmetics and personal care products. It is also utilized in the food industry as a sequestrant and preservative due to its ability to stabilize and enhance the shelf life of food and beverage products. The segment's growth is bolstered by advancements in chemical synthesis technologies, which ensure consistent quality and purity of synthetic gluconolactone for diverse industrial applications. Manufacturers benefit from the scalability and cost-effectiveness of synthetic production methods, meeting the growing demand from industries seeking reliable ingredients that offer functional benefits and regulatory compliance. As consumer preferences shift towards sustainable and eco-friendly alternatives, there is ongoing research and development in biotechnological processes to produce gluconolactone from non-synthetic sources, presenting future growth opportunities in the market.
Gluconolactone Market Share Analysis: 100 to 102% Grade is the fastest growing segment over the forecast period to 2032
The 100 to 102% Grade segment is projected to be the fastest-growing within the Gluconolactone market through 2032. This high-grade category of gluconolactone is favored for its exceptional purity and performance in various pharmaceutical and cosmetic applications. Grades ranging from 100% to 102% purity are crucial in formulations requiring stringent quality standards, such as pharmaceutical preparations, where gluconolactone serves as an excipient in drug delivery systems and as a stabilizer in parenteral formulations. The segment's growth is driven by increasing demand for premium quality ingredients that ensure efficacy, safety, and regulatory compliance in pharmaceutical and personal care products. Manufacturers are investing in advanced production technologies to achieve higher purity levels and enhance the functional properties of gluconolactone, meeting the evolving needs of the healthcare and cosmetic industries. As global healthcare expenditures rise and consumer awareness of skin health and cosmetic formulations expands, the 100 to 102% Grade segment presents lucrative opportunities for market players to innovate and capitalize on the growing market demand for high-performance gluconolactone grades.
Gluconolactone Market Share Analysis: Cosmetics segment generated the highest revenue share in the industry
The Cosmetics segment emerges as the largest within the Gluconolactone market, driven by its versatile applications in skincare, haircare, and personal care products. Gluconolactone is valued in cosmetics for its gentle exfoliating properties, ability to hydrate and condition the skin without irritation, and antioxidant benefits that help in combating signs of aging. It is commonly used in formulations such as moisturizers, anti-aging creams, serums, and facial cleansers, where it contributes to improving skin texture, enhancing skin barrier function, and promoting overall skin health. The segment's growth is bolstered by increasing consumer preference for skincare products that offer multiple benefits, including hydration, anti-aging effects, and skin renewal properties. Cosmetic manufacturers are incorporating gluconolactone into their formulations to meet these demands while ensuring product safety and efficacy. Furthermore, the rise in global beauty consciousness and the shift towards natural and sustainable skincare solutions drive the adoption of gluconolactone in cosmetic applications. As the cosmetics industry continues to innovate with new formulations and product offerings, the Cosmetics segment of the Gluconolactone market remains pivotal in shaping trends and meeting evolving consumer expectations for effective and safe skincare solutions.
Gluconolactone Market Segmentation
By Source
Synthetic
Non- Synthetic
By Grade
97 to 100%
100 to 102%
By End-User
Dietary Supplements
Pharmaceutical
Cosmetics
Energy Drinks
Food
Countries Analyzed
North America (US, Canada, Mexico)
Europe (Germany, UK, France, Spain, Italy, Russia, Rest of Europe)
Asia Pacific (China, India, Japan, South Korea, Australia, South East Asia, Rest of Asia)
South America (Brazil, Argentina, Rest of South America)
Middle East and Africa (Saudi Arabia, UAE, Rest of Middle East, South Africa, Egypt, Rest of Africa)
Gluconolactone Companies Profiled in the Study
Anhui Fubore Pharmaceutical & Chemical Co.Ltd
Foodchem International Corp
Fuso Chemical Company
Hubei Yitai Pharmaceutical Co. Ltd
Jungbunzlauer
Merck Millipore Corp
Roquette Frères
Roquette Frères
Shandong Baisheng Biotechnology Co. Ltd
Shandong Fuyuan Bio-Tech CO. LTD
Shaoxing Marina Biotechnology Co. Ltd
Sigma Aldrich
Xinhong Pharmaceutical
Yuanming Group
*- List Not Exhaustive
Chapter 1. TABLE OF CONTENTS
Chapter 2. Introduction to Gluconolactone Market
2.1. Market Overview
2.2. Key Statistics and Report Highlights
2.3. Scope of the Comprehensive Study
2.3.1. Market Definition
2.3.2 Countries and Regions Covered
2.3.3 Research Objective
2.3.4 Units, Currency, and Conversions
2.3.5 Industry Value Chain
2.4. Key Market Segments
2.5. Key Companies
2.6. Study Period
Chapter 3. Strategic Analysis Review
3.1. Gluconolactone Pricing Analysis and Forecast
3.2. Porter’s Five Forces
3.3. Market Ecosystem
3.4. SWOT Analysis
3.5. Regulatory Scenario
3.3. Effects of Inflation, Russia-Ukraine War, moderating economic growth, and other macroeconomic factors
Chapter 4. Competitive Landscape
4.1. Market Share Analysis
4.1.1. Global Gluconolactone Market Share by Company, 2023
4.1.2. Product Offerings of Leading Gluconolactone Companies
4.2. Market Entropy
4.2.1. New Product Launches in the Industry
4.2.2. Mergers, Acquisitions, Joint ventures, and Partnerships
4.3. Key Strategies and Best Practices
Chapter 5. Global Market Projections: Best, Reference, and Low Case Scenarios
5.1. Growth Analysis- Case Scenario Definitions
5.2. Low Growth Case Scenario Forecasts
5.3. Reference Growth Case Scenario Forecasts
5.4. High Growth Case Scenario Forecasts
Chapter 6. Market Dynamics
6.1. Gluconolactone Market Drivers
6.2. Gluconolactone Market Challenges
6.6. Gluconolactone Market Opportunities
6.4. Gluconolactone Market Trends
Chapter 7. Global Gluconolactone Market Outlook Trends
7.1. Global Gluconolactone Revenue (USD Million) and CAGR (%) by Type (2021-2032)
7.2. Global Gluconolactone Revenue (USD Million) and CAGR (%) by Application (2021-2032)
7.3. Global Gluconolactone Revenue (USD Million) and CAGR (%) by Product (2021-2032)
By Source
Synthetic
Non- Synthetic
By Grade
97 to 100%
100 to 102%
By End-User
Dietary Supplements
Pharmaceutical
Cosmetics
Energy Drinks
Food
Chapter 8. Global Gluconolactone Regional Analysis and Outlook
8.1. Global Gluconolactone Revenue (USD Million) By Regions (2021- 2032)
8.2. North America Gluconolactone Revenue (USD Million) by Country (2021-2032)
8.2.1. United States Gluconolactone Regional Analysis and Outlook
8.2.2. Canada Gluconolactone Regional Analysis and Outlook
8.2.3. Mexico Gluconolactone Regional Analysis and Outlook
8.3. Europe Gluconolactone Revenue (USD Million), by Country (2021-2032)
8.3.1. Germany Gluconolactone Regional Analysis and Outlook
8.3.2. France Gluconolactone Regional Analysis and Outlook
8.3.3. United Kingdom Gluconolactone Regional Analysis and Outlook
8.3.4. Spain Gluconolactone Regional Analysis and Outlook
8.3.5. Italy Gluconolactone Regional Analysis and Outlook
8.3.6. Russia Gluconolactone Regional Analysis and Outlook
8.3.7. Rest of Europe Gluconolactone Regional Analysis and Outlook
8.4. Asia Pacific Gluconolactone Revenue (USD Million) by Country (2021-2032)
8.4.1. China Gluconolactone Regional Analysis and Outlook
8.4.2. Japan Gluconolactone Regional Analysis and Outlook
8.4.3. India Gluconolactone Regional Analysis and Outlook
8.4.4. South Korea Gluconolactone Regional Analysis and Outlook
8.4.5. Australia Gluconolactone Regional Analysis and Outlook
8.4.6. South East Asia Gluconolactone Regional Analysis and Outlook
8.4.7. Rest of Asia Pacific Gluconolactone Regional Analysis and Outlook
8.5. South America Gluconolactone Revenue (USD Million), by Country (2021-2032)
8.5.1. Brazil Gluconolactone Regional Analysis and Outlook
8.5.2. Argentina Gluconolactone Regional Analysis and Outlook
8.5.3. Rest of South America Gluconolactone Regional Analysis and Outlook
8.6. Middle East and Africa Gluconolactone Revenue (USD Million) by Country (2021-2032)
8.6.1. Middle East Gluconolactone Regional Analysis and Outlook
8.6.2. Africa Gluconolactone Regional Analysis and Outlook
Chapter 9. North America Gluconolactone Analysis and Outlook
9.1. North America Gluconolactone Revenue (USD Million) by Segments (2021-2032)
9.1.1. North America Gluconolactone Revenue (USD Million) by Type (2021-2032)
9.1.2. North America Gluconolactone Revenue (USD Million) by Application (2021-2032)
9.1.3. North America Gluconolactone Revenue (USD Million) by Product (2021-2032)
By Source
Synthetic
Non- Synthetic
By Grade
97 to 100%
100 to 102%
By End-User
Dietary Supplements
Pharmaceutical
Cosmetics
Energy Drinks
Food
Chapter 10. Europe Gluconolactone Analysis and Outlook
10.1. Europe Gluconolactone Revenue (USD Million), by Segments (USD Million) (2021-2032)
10.1.1. Europe Gluconolactone Revenue (USD Million) by Type (2021-2032)
10.1.2. Europe Gluconolactone Revenue (USD Million) by Application (2021-2032)
10.1.3. Europe Gluconolactone Revenue (USD Million) by Product (2021-2032)
By Source
Synthetic
Non- Synthetic
By Grade
97 to 100%
100 to 102%
By End-User
Dietary Supplements
Pharmaceutical
Cosmetics
Energy Drinks
Food
Chapter 11. Asia Pacific Gluconolactone Analysis and Outlook
11.1. Asia Pacific Gluconolactone Revenue (USD Million), and Revenue (USD Million) by Segments (2021-2032)
11.1.1. Asia Pacific Gluconolactone Revenue (USD Million) by Type (2021-2032)
11.1.2. Asia Pacific Gluconolactone Revenue (USD Million) by Application (2021-2032)
11.1.3. Asia Pacific Gluconolactone Revenue (USD Million) by Product (2021-2032)
By Source
Synthetic
Non- Synthetic
By Grade
97 to 100%
100 to 102%
By End-User
Dietary Supplements
Pharmaceutical
Cosmetics
Energy Drinks
Food
Chapter 12. South America Gluconolactone Analysis and Outlook
12.1. South America Gluconolactone Revenue (USD Million), by Segments (2021-2032)
12.1.1. South America Gluconolactone Revenue (USD Million) by Type (2021-2032)
12.1.2. South America Gluconolactone Revenue (USD Million) by Application (2021-2032)
12.1.3. South America Gluconolactone Revenue (USD Million) by Product (2021-2032)
By Source
Synthetic
Non- Synthetic
By Grade
97 to 100%
100 to 102%
By End-User
Dietary Supplements
Pharmaceutical
Cosmetics
Energy Drinks
Food
Chapter 13. Middle East and Africa Gluconolactone Analysis and Outlook
13.1. Middle East and Africa Gluconolactone Revenue (USD Million), by Segments (2021-2032)
13.1.1. Middle East and Africa Gluconolactone Revenue (USD Million) by Type (2021-2032)
13.1.2. Middle East and Africa Gluconolactone Revenue (USD Million) by Application (2021-2032)
13.1.3. Middle East and Africa Gluconolactone Revenue (USD Million) by Product (2021-2032)
By Source
Synthetic
Non- Synthetic
By Grade
97 to 100%
100 to 102%
By End-User
Dietary Supplements
Pharmaceutical
Cosmetics
Energy Drinks
Food
Chapter 14. Gluconolactone Company Profiles
14.1 Business Overview
14.2 Product Profiles
14.3 SWOT Profiles
14.5 Recent Developments
14.6 Financial Profile
List of Companies
Anhui Fubore Pharmaceutical & Chemical Co.Ltd
Foodchem International Corp
Fuso Chemical Company
Hubei Yitai Pharmaceutical Co. Ltd
Jungbunzlauer
Merck Millipore Corp
Roquette Frères
Roquette Frères
Shandong Baisheng Biotechnology Co. Ltd
Shandong Fuyuan Bio-Tech CO. LTD
Shaoxing Marina Biotechnology Co. Ltd
Sigma Aldrich
Xinhong Pharmaceutical
Yuanming Group
15. Methodology and Data Sources
15.1 Customization Offerings
15.2 Subscription Services
15.3 Related Reports
15.4 Publisher Expertise
LIST OF TABLES
Table 1 Market Segmentation Analysis
Table 2 Global Gluconolactone Market Share of Leading Companies, 2023
Table 3 Product Offerings of Leading Companies
Table 4 Low Growth Scenario Forecasts
Table 5 Reference Case Growth Scenario
Table 6 High Growth Case Scenario
Table 7 Global Gluconolactone Revenue (USD Million) And CAGR (%) By Type (2021-2032)
Table 8 Global Gluconolactone Revenue (USD Million) And CAGR (%) By Application (2021-2032)
Table 9 Global Gluconolactone Revenue (USD Million) And CAGR (%) By Product (2021-2032)
Table 10 Global Gluconolactone Market Revenue (USD Million) By Regions (2021-2032)
Table 11 Global Gluconolactone Market Share (%) By Regions (2021-2032)
Table 12 North America Gluconolactone Revenue (USD Million) By Country (2021-2032)
Table 13 Europe Gluconolactone Revenue (USD Million) By Country (2021-2032)
Table 14 Asia Pacific Gluconolactone Revenue (USD Million) By Country (2021-2032)
Table 15 South America Gluconolactone Revenue (USD Million) By Country (2021-2032)
Table 16 Middle East and Africa Gluconolactone Revenue (USD Million) By Region (2021-2032)
Table 17 North America Gluconolactone Revenue (USD Million) By Type (2021-2032)
Table 18 North America Gluconolactone Revenue (USD Million) By Application (2021-2032)
Table 19 North America Gluconolactone Revenue (USD Million) By Product (2021-2032)
Table 20 Europe Gluconolactone Revenue (USD Million) By Type (2021-2032)
Table 21 Europe Gluconolactone Revenue (USD Million) By Application (2021-2032)
Table 22 Europe Gluconolactone Revenue (USD Million) By Product (2021-2032)
Table 23 Asia Pacific Gluconolactone Revenue (USD Million) By Type (2021-2032)
Table 24 Asia Pacific Gluconolactone Revenue (USD Million) By Application (2021-2032)
Table 25 Asia Pacific Gluconolactone Revenue (USD Million) By Product (2021-2032)
Table 26 South America Gluconolactone Revenue (USD Million) By Type (2021-2032)
Table 27 South America Gluconolactone Revenue (USD Million) By Application (2021-2032)
Table 28 South America Gluconolactone Revenue (USD Million) By Product (2021-2032)
Table 29 Middle East and Africa Gluconolactone Revenue (USD Million) By Type (2021-2032)
Table 30 Middle East and Africa Gluconolactone Revenue (USD Million) By Application (2021-2032)
Table 31 Middle East and Africa Gluconolactone Revenue (USD Million) By Product (2021-2032)
LIST OF FIGURES
Figure 1. Market Scope
Figure 2. Pricing Forecasts Per Unit, 2023- 2032
Figure 3. Porter’s Five Forces
Figure 4. Global Gluconolactone Market Revenue (USD Million) By Regions (2021-2032)
Figure 5. Global Gluconolactone Market Share (%) By Regions (2023)
Figure 6. North America Gluconolactone Revenue (USD Million) By Country (2021-2032)
Figure 7. United States Gluconolactone Revenue (USD Million) By Country (2021-2032)
Figure 8. Canada Gluconolactone Revenue (USD Million) By Country (2021-2032)
Figure 9. Mexico Gluconolactone Revenue (USD Million) By Country (2021-2032)
Figure 10. Europe Gluconolactone Revenue (USD Million) By Country (2021-2032)
Figure 11. Germany Gluconolactone Revenue (USD Million) By Country (2021-2032)
Figure 12. France Gluconolactone Revenue (USD Million) By Country (2021-2032)
Figure 13. United Kingdom Gluconolactone Revenue (USD Million) By Country (2021-2032)
Figure 14. Spain Gluconolactone Revenue (USD Million) By Country (2021-2032)
Figure 15. Italy Gluconolactone Revenue (USD Million) By Country (2021-2032)
Figure 16. Russia Gluconolactone Revenue (USD Million) By Country (2021-2032)
Figure 17. Rest of Europe Gluconolactone Revenue (USD Million) By Country (2021-2032)
Figure 11. Asia Pacific Gluconolactone Revenue (USD Million) By Country (2021-2032)
Figure 12. China Gluconolactone Revenue (USD Million) By Country (2021-2032)
Figure 13. Japan Gluconolactone Revenue (USD Million) By Country (2021-2032)
Figure 14. India Gluconolactone Revenue (USD Million) By Country (2021-2032)
Figure 15. South Korea Gluconolactone Revenue (USD Million) By Country (2021-2032)
Figure 16. Australia Gluconolactone Revenue (USD Million) By Country (2021-2032)
Figure 17. South East Asia Gluconolactone Revenue (USD Million) By Country (2021-2032)
Figure 18. South America Gluconolactone Revenue (USD Million) By Country (2021-2032)
Figure 19. Brazil Gluconolactone Revenue (USD Million) By Country (2021-2032)
Figure 20. Argentina Gluconolactone Revenue (USD Million) By Country (2021-2032)
Figure 21. Rest of Asia Pacific Gluconolactone Revenue (USD Million) By Country (2021-2032)
Figure 22. Middle East and Africa Gluconolactone Revenue (USD Million) By Region (2021-2032)
Figure 23. Saudi Arabia Gluconolactone Revenue (USD Million) By Region (2021-2032)
Figure 24. The UAE Gluconolactone Revenue (USD Million) By Region (2021-2032)
Figure 25. Rest of Middle East Gluconolactone Revenue (USD Million) By Region (2021-2032)
Figure 26. South Africa Gluconolactone Revenue (USD Million) By Region (2021-2032)
Figure 27. Africa Gluconolactone Revenue (USD Million) By Region (2021-2032)
Figure 28. North America Gluconolactone Revenue (USD Million) By Type (2021-2032)
Figure 29. North America Gluconolactone Revenue (USD Million) By Application (2021-2032)
Figure 30. North America Gluconolactone Revenue (USD Million) By Product (2021-2032)
Figure 31. Europe Gluconolactone Revenue (USD Million) By Type (2021-2032)
Figure 32. Europe Gluconolactone Revenue (USD Million) By Application (2021-2032)
Figure 33. Europe Gluconolactone Revenue (USD Million) By Product (2021-2032)
Figure 34. Asia Pacific Gluconolactone Revenue (USD Million) By Type (2021-2032)
Figure 35. Asia Pacific Gluconolactone Revenue (USD Million) By Application (2021-2032)
Figure 36. Asia Pacific Gluconolactone Revenue (USD Million) By Product (2021-2032)
Figure 37. South America Gluconolactone Revenue (USD Million) By Type (2021-2032)
Figure 38. South America Gluconolactone Revenue (USD Million) By Application (2021-2032)
Figure 39. South America Gluconolactone Revenue (USD Million) By Product (2021-2032)
Figure 40. Middle East and Africa Gluconolactone Revenue (USD Million) By Type (2021-2032)
Figure 41. Middle East and Africa Gluconolactone Revenue (USD Million) By Application (2021-2032)
Figure 42. Middle East and Africa Gluconolactone Revenue (USD Million) By Product (2021-2032)
By Source
Synthetic
Non- Synthetic
By Grade
97 to 100%
100 to 102%
By End-User
Dietary Supplements
Pharmaceutical
Cosmetics
Energy Drinks
Food
Countries Analyzed
North America (US, Canada, Mexico)
Europe (Germany, UK, France, Spain, Italy, Russia, Rest of Europe)
Asia Pacific (China, India, Japan, South Korea, Australia, South East Asia, Rest of Asia)
South America (Brazil, Argentina, Rest of South America)
Middle East and Africa (Saudi Arabia, UAE, Rest of Middle East, South Africa, Egypt, Rest of Africa)
