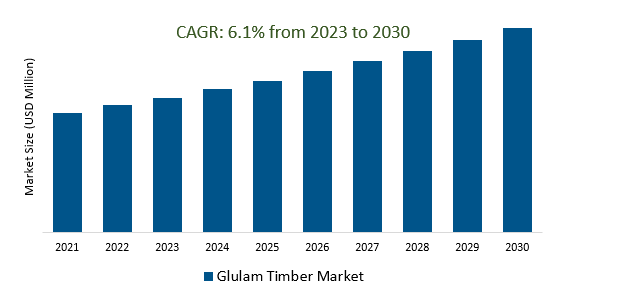
The Global Glulam Timber Market Size is estimated to register 6.1% growth over the forecast period from 2023 to 2030.
The market growth is driven by increasing emphasis on sustainability in construction and building materials has driven demand for Glulam timber, which is a renewable and environmentally friendly building material. Leading Companies focusing on Sustainable Construction, Urbanization and Population Growth, Technological Advancements, Architectural Innovation, Circular Economy and Recycling, Resilience and Disaster-Resistant Construction, and others to boost market shares in the industry.
Market Overview
The Glulam Timber Market involves the use of glued laminated timber, renowned for its sustainability, strength, and aesthetic appeal. It finds applications in diverse construction projects, driven by a growing demand for eco-friendly materials, architectural innovation, and adherence to green building standards. Despite challenges like price fluctuations and competition, the market has seen global growth and continuous technological advancements, making it a significant player in the construction industry, while consumer awareness of sustainability further fuels its adoption.
Market Dynamics
Market Trends- Glulam timber provides a sustainable solution for urban green spaces.
Glulam timber serves as a sustainable and versatile choice for developing urban green spaces. Its eco-friendly characteristics, such as renewability and low environmental impact, align perfectly with the growing emphasis on green and sustainable urban design. Glulam's structural strength and aesthetic appeal make it an ideal material for crafting bridges, walkways, and other green infrastructure in cities, creating a harmonious blend of nature and modern architecture.
Market Driver- International trade drives demand for glulam timber in the market.
International trade plays a pivotal role in propelling demand for Glulam timber within the market. Glulam timber is sought after worldwide for its sustainability, structural strength, and aesthetic appeal. As countries with abundant timber resources export Glulam products to regions with higher demand, it fosters market growth. Furthermore, the global marketplace encourages technological advancements, leading to innovations in Glulam production and applications.
Market Opportunity- Climate change and carbon sequestration are driving demand for glulam timber in the market.
Climate change concerns and the need for carbon sequestration are becoming significant drivers for the demand for Glulam timber in the market. Glulam's ability to sequester carbon during its growth and subsequent use in construction positions it as a vital contributor to reducing carbon emissions in the building industry. This aligns with the broader sustainability goals and green building initiatives, where architects, builders, and governments are increasingly recognizing the value of materials that not only have a low environmental footprint but actively assist in mitigating climate change.
Market Share Analysis- The modified Melamine-resin Type Glulam Timber Market will register the fastest growth
The Global Glulam Timber Market is analyzed across. Modified Melamine-resin Type, Phenol Resorcinol-resin Type, Polyurethane Type, and Modified Melamine-resin type, and others. Modified Melamine-resin types are poised to register the fastest growth. The modified Melamine-resin type Glulam Timber Market is a niche segment within the broader Glulam Timber Market, known for its adhesive properties that enhance durability, fire resistance, and weather resistance in Glulam timber. This segment addresses specific construction needs, particularly those requiring increased resilience to environmental factors and improved fire safety measures, although for the most current and detailed market information, consulting specialized sources or industry reports is advisable.
Market Share Analysis- Roof trusses held a significant market share in 2023
The Global Glulam Timber Market is analyzed across various types Roof truss, Support & columns, Furniture, Stairs, Ceiling structures, and others. Of these, Roof trusses held a significant market share in 2023. The Roof Truss Glulam Timber Market is a specialized segment within the broader Glulam Timber Market, centered around the use of Glulam timber in the construction of roof trusses, popular for their structural efficiency and aesthetics in residential, commercial, and industrial building applications.
Glulam Timber Market Segmentation
By Type
- Modified Melamine-resin Type
- Phenol Resorcinol-resin Type
- Polyurethane Type
By End-User
- Roof truss
- Support & columns
- Furniture
- Stairs
- Ceiling structures
- Others
By Application
- Commercial
- Residential
- Others
By Region
- North America (United States, Canada, Mexico)
- Europe (Germany, France, United Kingdom, Spain, Italy, Others)
- Asia Pacific (China, India, Japan, South Korea, Australia, Others)
- Latin America (Brazil, Argentina, Others)
- Middle East and Africa (Saudi Arabia, UAE, Kuwait, Other Middle East, South Africa, Nigeria, Other Africa)
Glulam Timber Market Companies
- Canfor Corporation
- Calvert Glulam
- Pfeifer Group
- Setra Group
- Schilliger Holz
- Boise Cascade
- Structurlam
- Mayr-Melnhof Holz
- Binderholz GmbH
- B&K Structures
- Eugen Decker
- Meiken Lamwood Corp
- Swedish Wood
- Glulam Ltd
- CWC
- Buckland Timber
- Hasslacher
*List not exhaustive
Glulam Timber Market Outlook 2023
1 Market Overview
1.1 Introduction to the Glulam Timber Market
1.2 Scope of the Study
1.3 Research Objective
1.3.1 Key Market Scope and Segments
1.3.2 Players Covered
1.3.3 Years Considered
2 Executive Summary
2.1 2023 Glulam Timber Industry- Market Statistics
3 Market Dynamics
3.1 Market Drivers
3.2 Market Challenges
3.3 Market Opportunities
3.4 Market Trends
4 Market Factor Analysis
4.1 Porter’s Five Forces
4.2 Market Entropy
4.2.1 Global Glulam Timber Market Companies with Area Served
4.2.2 Products Offerings Global Glulam Timber Market
5 COVID-19 Impact Analysis and Outlook Scenarios
5.1.1 Covid-19 Impact Analysis
5.1.2 Post-COVID-19 Scenario- Low Growth Case
5.1.3 Post-COVID-19 Scenario- Reference Growth Case
5.1.4 Post-COVID-19 Scenario- Low Growth Case
6 Global Glulam Timber Market Trends
6.1 Global Glulam Timber Revenue (USD Million) and CAGR (%) by Type (2018-2030)
6.2 Global Glulam Timber Revenue (USD Million) and CAGR (%) by Applications (2018-2030)
6.3 Global Glulam Timber Revenue (USD Million) and CAGR (%) by Regions (2018-2030)
7 Global Glulam Timber Market Revenue (USD Million) by Type, and Applications (2018-2022)
7.1 Global Glulam Timber Revenue (USD Million) by Type (2018-2022)
7.1.1 Global Glulam Timber Revenue (USD Million), Market Share (%) by Type (2018-2022)
7.2 Global Glulam Timber Revenue (USD Million) by Applications (2018-2022)
7.2.1 Global Glulam Timber Revenue (USD Million), Market Share (%) by Applications (2018-2022)
8 Global Glulam Timber Development Regional Status and Outlook
8.1 Global Glulam Timber Revenue (USD Million) By Regions (2018-2022)
8.2 North America Glulam Timber Revenue (USD Million) by Type, and Application (2018-2022)
8.2.1 North America Glulam Timber Revenue (USD Million) by Country (2018-2022)
8.2.2 North America Glulam Timber Revenue (USD Million) by Type (2018-2022)
8.2.3 North America Glulam Timber Revenue (USD Million) by Applications (2018-2022)
8.3 Europe Glulam Timber Revenue (USD Million), by Type, and Applications (USD Million) (2018-2022)
8.3.1 Europe Glulam Timber Revenue (USD Million), by Country (2018-2022)
8.3.2 Europe Glulam Timber Revenue (USD Million) by Type (2018-2022)
8.3.3 Europe Glulam Timber Revenue (USD Million) by Applications (2018-2022)
8.4 Asia Pacific Glulam Timber Revenue (USD Million), and Revenue (USD Million) by Type, and Applications (2018-2022)
8.4.1 Asia Pacific Glulam Timber Revenue (USD Million) by Country (2018-2022)
8.4.2 Asia Pacific Glulam Timber Revenue (USD Million) by Type (2018-2022)
8.4.3 Asia Pacific Glulam Timber Revenue (USD Million) by Applications (2018-2022)
8.5 South America Glulam Timber Revenue (USD Million), by Type, and Applications (2018-2022)
8.5.1 South America Glulam Timber Revenue (USD Million), by Country (2018-2022)
8.5.2 South America Glulam Timber Revenue (USD Million) by Type (2018-2022)
8.5.3 South America Glulam Timber Revenue (USD Million) by Applications (2018-2022)
8.6 Middle East and Africa Glulam Timber Revenue (USD Million), by Type, Technology, Application, Thickness (2018-2022)
8.6.1 Middle East and Africa Glulam Timber Revenue (USD Million) by Country (2018-2022)
8.6.2 Middle East and Africa Glulam Timber Revenue (USD Million) by Type (2018-2022)
8.6.3 Middle East and Africa Glulam Timber Revenue (USD Million) by Applications (2018-2022)
9 Company Profiles
10 Global Glulam Timber Market Revenue (USD Million), by Type, and Applications (2023-2030)
10.1 Global Glulam Timber Revenue (USD Million) and Market Share (%) by Type (2023-2030)
10.1.1 Global Glulam Timber Revenue (USD Million), and Market Share (%) by Type (2023-2030)
10.2 Global Glulam Timber Revenue (USD Million) and Market Share (%) by Applications (2023-2030)
10.2.1 Global Glulam Timber Revenue (USD Million), and Market Share (%) by Applications (2023-2030)
11 Global Glulam Timber Development Regional Status and Outlook Forecast
11.1 Global Glulam Timber Revenue (USD Million) By Regions (2023-2030)
11.2 North America Glulam Timber Revenue (USD Million) by Type, and Applications (2023-2030)
11.2.1 North America Glulam Timber Revenue (USD) Million by Country (2023-2030)
11.2.2 North America Glulam Timber Revenue (USD Million), by Type (2023-2030)
11.2.3 North America Glulam Timber Revenue (USD Million), Market Share (%) by Applications (2023-2030)
11.3 Europe Glulam Timber Revenue (USD Million), by Type, and Applications (2023-2030)
11.3.1 Europe Glulam Timber Revenue (USD Million), by Country (2023-2030)
11.3.2 Europe Glulam Timber Revenue (USD Million), by Type (2023-2030)
11.3.3 Europe Glulam Timber Revenue (USD Million), by Applications (2023-2030)
11.4 Asia Pacific Glulam Timber Revenue (USD Million) by Type, and Applications (2023-2030)
11.4.1 Asia Pacific Glulam Timber Revenue (USD Million), by Country (2023-2030)
11.4.2 Asia Pacific Glulam Timber Revenue (USD Million), by Type (2023-2030)
11.4.3 Asia Pacific Glulam Timber Revenue (USD Million), by Applications (2023-2030)
11.5 South America Glulam Timber Revenue (USD Million), by Type, and Applications (2023-2030)
11.5.1 South America Glulam Timber Revenue (USD Million), by Country (2023-2030)
11.5.2 South America Glulam Timber Revenue (USD Million), by Type (2023-2030)
11.5.3 South America Glulam Timber Revenue (USD Million), by Applications (2023-2030)
11.6 Middle East and Africa Glulam Timber Revenue (USD Million), by Type, and Applications (2023-2030)
11.6.1 Middle East and Africa Glulam Timber Revenue (USD Million), by Region (2023-2030)
11.6.2 Middle East and Africa Glulam Timber Revenue (USD Million), by Type (2023-2030)
11.6.3 Middle East and Africa Glulam Timber Revenue (USD Million), by Applications (2023-2030)
12 Methodology and Data Sources
12.1 Methodology/Research Approach
12.1.1 Research Programs/Design
12.1.2 Market Size Estimation
12.1.3 Market Breakdown and Data Triangulation
12.2 Data Sources
12.2.1 Secondary Sources
12.2.2 Primary Sources
12.3 Disclaimer
List of Tables
Table 1 Market Segmentation Analysis
Table 2 Global Glulam Timber Market Companies with Areas Served
Table 3 Products Offerings Global Glulam Timber Market
Table 4 Low Growth Scenario Forecasts
Table 5 Reference Case Growth Scenario
Table 6 High Growth Case Scenario
Table 7 Global Glulam Timber Revenue (USD Million) And CAGR (%) By Type (2018-2030)
Table 8 Global Glulam Timber Revenue (USD Million) And CAGR (%) By Applications (2018-2030)
Table 9 Global Glulam Timber Revenue (USD Million) And CAGR (%) By Regions (2018-2030)
Table 10 Global Glulam Timber Revenue (USD Million) By Type (2018-2022)
Table 11 Global Glulam Timber Revenue Market Share (%) By Type (2018-2022)
Table 12 Global Glulam Timber Revenue (USD Million) By Applications (2018-2022)
Table 13 Global Glulam Timber Revenue Market Share (%) By Applications (2018-2022)
Table 14 Global Glulam Timber Market Revenue (USD Million) By Regions (2018-2022)
Table 15 Global Glulam Timber Market Share (%) By Regions (2018-2022)
Table 16 North America Glulam Timber Revenue (USD Million) By Country (2018-2022)
Table 17 North America Glulam Timber Revenue (USD Million) By Type (2018-2022)
Table 18 North America Glulam Timber Revenue (USD Million) By Applications (2018-2022)
Table 19 Europe Glulam Timber Revenue (USD Million) By Country (2018-2022)
Table 20 Europe Glulam Timber Revenue (USD Million) By Type (2018-2022)
Table 21 Europe Glulam Timber Revenue (USD Million) By Applications (2018-2022)
Table 22 Asia Pacific Glulam Timber Revenue (USD Million) By Country (2018-2022)
Table 23 Asia Pacific Glulam Timber Revenue (USD Million) By Type (2018-2022)
Table 24 Asia Pacific Glulam Timber Revenue (USD Million) By Applications (2018-2022)
Table 25 South America Glulam Timber Revenue (USD Million) By Country (2018-2022)
Table 26 South America Glulam Timber Revenue (USD Million) By Type (2018-2022)
Table 27 South America Glulam Timber Revenue (USD Million) By Applications (2018-2022)
Table 28 Middle East and Africa Glulam Timber Revenue (USD Million) By Region (2018-2022)
Table 29 Middle East and Africa Glulam Timber Revenue (USD Million) By Type (2018-2022)
Table 30 Middle East and Africa Glulam Timber Revenue (USD Million) By Applications (2018-2022)
Table 31 Financial Analysis
Table 32 Global Glulam Timber Revenue (USD Million) By Type (2023-2030)
Table 33 Global Glulam Timber Revenue Market Share (%) By Type (2023-2030)
Table 34 Global Glulam Timber Revenue (USD Million) By Applications (2023-2030)
Table 35 Global Glulam Timber Revenue Market Share (%) By Applications (2023-2030)
Table 36 Global Glulam Timber Market Revenue (USD Million), And Revenue (USD Million) By Regions (2023-2030)
Table 37 North America Glulam Timber Revenue (USD)By Country (2023-2030)
Table 38 North America Glulam Timber Revenue (USD Million) By Type (2023-2030)
Table 39 North America Glulam Timber Revenue (USD Million) By Applications (2023-2030)
Table 40 Europe Glulam Timber Revenue (USD Million) By Country (2023-2030)
Table 41 Europe Glulam Timber Revenue (USD Million) By Type (2023-2030)
Table 42 Europe Glulam Timber Revenue (USD Million) By Applications (2023-2030)
Table 43 Asia Pacific Glulam Timber Revenue (USD Million) By Country (2023-2030)
Table 44 Asia Pacific Glulam Timber Revenue (USD Million) By Type (2023-2030)
Table 45 Asia Pacific Glulam Timber Revenue (USD Million) By Applications (2023-2030)
Table 46 South America Glulam Timber Revenue (USD Million) By Country (2023-2030)
Table 47 South America Glulam Timber Revenue (USD Million) By Type (2023-2030)
Table 48 South America Glulam Timber Revenue (USD Million) By Applications (2023-2030)
Table 49 Middle East and Africa Glulam Timber Revenue (USD Million) By Region (2023-2030)
Table 50 Middle East and Africa Glulam Timber Revenue (USD Million) By Region (2023-2030)
Table 51 Middle East and Africa Glulam Timber Revenue (USD Million) By Type (2023-2030)
Table 52 Middle East and Africa Glulam Timber Revenue (USD Million) By Applications (2023-2030)
Table 53 Research Programs/Design for This Report
Table 54 Key Data Information from Secondary Sources
Table 55 Key Data Information from Primary Sources
List of Figures
Figure 1 Market Scope
Figure 2 Porter’s Five Forces
Figure 3 Global Glulam Timber Revenue (USD Million) By Type (2018-2022)
Figure 4 Global Glulam Timber Revenue Market Share (%) By Type (2022)
Figure 5 Global Glulam Timber Revenue (USD Million) By Applications (2018-2022)
Figure 6 Global Glulam Timber Revenue Market Share (%) By Applications (2022)
Figure 7 Global Glulam Timber Market Revenue (USD Million) By Regions (2018-2022)
Figure 8 Global Glulam Timber Market Share (%) By Regions (2022)
Figure 9 North America Glulam Timber Revenue (USD Million) By Country (2018-2022)
Figure 10 North America Glulam Timber Revenue (USD Million) By Type (2018-2022)
Figure 11 North America Glulam Timber Revenue (USD Million) By Applications (2018-2022)
Figure 12 Europe Glulam Timber Revenue (USD Million) By Country (2018-2022)
Figure 13 Europe Glulam Timber Revenue (USD Million) By Type (2018-2022)
Figure 14 Europe Glulam Timber Revenue (USD Million) By Applications (2018-2022)
Figure 15 Asia Pacific Glulam Timber Revenue (USD Million) By Country (2018-2022)
Figure 16 Asia Pacific Glulam Timber Revenue (USD Million) By Type (2018-2022)
Figure 17 Asia Pacific Glulam Timber Revenue (USD Million) By Applications (2018-2022)
Figure 18 South America Glulam Timber Revenue (USD Million) By Country (2018-2022)
Figure 19 South America Glulam Timber Revenue (USD Million) By Type (2018-2022)
Figure 20 South America Glulam Timber Revenue (USD Million) By Applications (2018-2022)
Figure 21 Middle East and Africa Glulam Timber Revenue (USD Million) By Region (2018-2022)
Figure 22 Middle East and Africa Glulam Timber Revenue (USD Million) By Type (2018-2022)
Figure 23 Middle East and Africa Glulam Timber Revenue (USD Million) By Applications (2018-2022)
Figure 24 Global Glulam Timber Revenue (USD Million) By Type (2023-2030)
Figure 25 Global Glulam Timber Revenue Market Share (%) By Type (2030)
Figure 26 Global Glulam Timber Revenue (USD Million) By Applications (2023-2030)
Figure 27 Global Glulam Timber Revenue Market Share (%) By Applications (2030)
Figure 28 Global Glulam Timber Market Revenue (USD Million) By Regions (2023-2030)
Figure 29 North America Glulam Timber Revenue (USD Million) By Country (2023-2030)
Figure 30 North America Glulam Timber Revenue (USD Million) By Type (2023-2030)
Figure 31 North America Glulam Timber Revenue (USD Million) By Applications (2023-2030)
Figure 32 Europe Glulam Timber Revenue (USD Million) By Country (2023-2030)
Figure 33 Europe Glulam Timber Revenue (USD Million) By Type (2023-2030)
Figure 34 Europe Glulam Timber Revenue (USD Million) By Applications (2023-2030)
Figure 35 Asia Pacific Glulam Timber Revenue (USD Million) By Country (2023-2030)
Figure 36 Asia Pacific Glulam Timber Revenue (USD Million) By Type (2023-2030)
Figure 37 Asia Pacific Glulam Timber Revenue (USD Million) By Applications (2023-2030)
Figure 38 South America Glulam Timber Revenue (USD Million) By Country (2023-2030)
Figure 39 South America Glulam Timber Revenue (USD Million) By Type (2023-2030)
Figure 40 South America Glulam Timber Revenue (USD Million) By Applications (2023-2030)
Figure 41 Middle East and Africa Glulam Timber Revenue (USD Million) By Region (2023-2030)
Figure 42 Middle East and Africa Glulam Timber Revenue (USD Million) By Region (2023-2030)
Figure 43 Middle East and Africa Glulam Timber Revenue (USD Million) By Type (2023-2030)
Figure 44 Middle East and Africa Glulam Timber Revenue (USD Million) By Applications (2023-2030)
Figure 45 Bottom-Up and Top-Down Approaches For This Report
Figure 46 Data Triangulation
