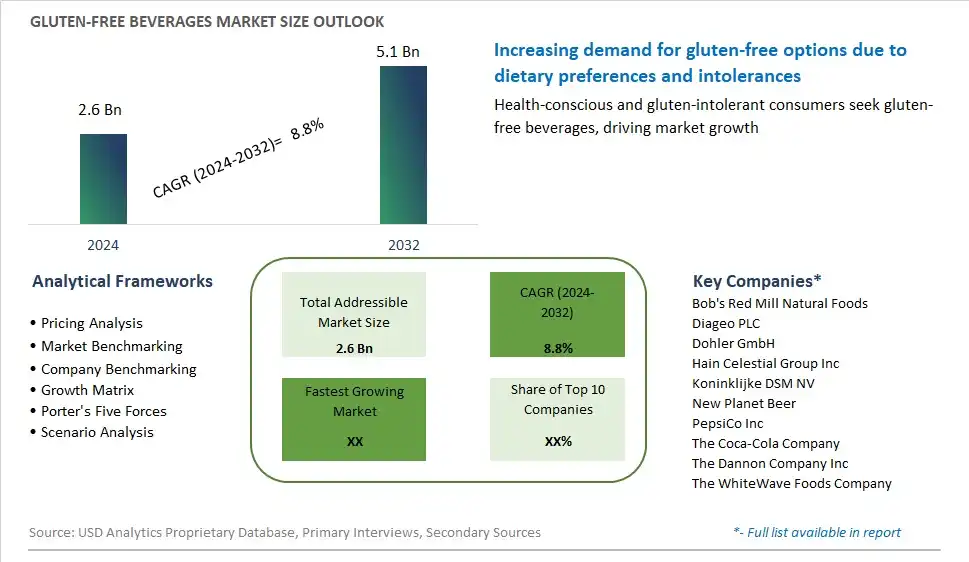
Global Gluten-free Beverages Market Size is valued at $2.6 Billion in 2024 and is forecast to register a growth rate (CAGR) of 8.8% to reach $5.1 Billion by 2032.
The global Gluten-free Beverages Market Comprehensive Study analyzes and forecasts the market size across 6 regions and 24 countries for diverse segments -By Type (Alcoholic beverage, Non-alcoholic beverage), By Distribution Channel (Health stores, Convenience Stores, Supermarkets/ Hypermarkets, Online retailers, Others)
An Introduction to Gluten-free Beverages Market
The market for gluten-free beverages in 2024 reflects a burgeoning segment within the broader beverage industry, driven by the growing prevalence of gluten intolerance, celiac disease, and shifting consumer dietary preferences. With an increasing emphasis on health and wellness, consumers are actively seeking alternative beverage options that cater to their dietary restrictions without compromising on taste or quality. This has led to the proliferation of gluten-free variants across various beverage categories including juices, soft drinks, dairy alternatives, and functional beverages. Additionally, advancements in food technology and formulation techniques have enabled manufacturers to create innovative gluten-free beverage offerings, utilizing a diverse range of ingredients such as fruits, vegetables, grains, and plant-based proteins. As consumers continue to prioritize transparency and clean label products, manufacturers are focusing on enhancing product formulations, fortifying nutritional profiles, and expanding distribution channels to capitalize on the growing demand for gluten-free beverages globally.
Gluten free Beverages Competitive Landscape
The market report analyses the leading companies in the industry including Bob's Red Mill Natural Foods, Diageo PLC, Dohler GmbH, Hain Celestial Group Inc, Koninklijke DSM NV, New Planet Beer, PepsiCo Inc, The Coca-Cola Company, The Dannon Company Inc, The WhiteWave Foods Company, and Others.
Gluten free Beverages Market Dynamics
Market Trend: Rising Demand for Healthy and Functional Beverages
The most prominent trend in the Gluten-Free Beverages Market is the rising demand for healthy and functional beverages. Consumers are increasingly seeking gluten-free options that offer additional health benefits, such as improved digestion, enhanced nutrition, and better overall well-being. This trend is driven by a growing awareness of gluten sensitivity and the broader health and wellness movement, leading to an increased preference for beverages that support a healthy lifestyle​(1)​.
Market Driver: Growing Awareness of Gluten Intolerance
A major driver of the Gluten-Free Beverages Market is the growing awareness of gluten intolerance and celiac disease. As more individuals are diagnosed with gluten-related disorders, there is a higher demand for gluten-free beverage options that cater to their dietary needs. This increased awareness is also influencing the general population to reduce gluten intake as a preventive measure, further driving the market for gluten-free beverages​(1)​.
Market Opportunity: Innovation in Product Development
A significant opportunity in the Gluten-Free Beverages Market lies in innovation in product development. Companies can capitalize on this by creating unique and diverse gluten-free beverage options, such as fortified drinks, probiotic-infused beverages, and plant-based alternatives. By introducing innovative products that appeal to health-conscious consumers and those with specific dietary needs, companies can differentiate themselves in the market and attract a larger customer base​(1)​.
Gluten-Free Beverages Market Share Analysis: Type (Alcoholic Beverage, Non-Alcoholic Beverage)
The non-alcoholic beverage segment is anticipated to be the fastest-growing in the Gluten-Free Beverages Market by type to 2032. The demand for gluten-free non-alcoholic beverages is driven by the increasing awareness of gluten intolerance and celiac disease, as well as the growing preference for healthier and functional drink options. Gluten-free non-alcoholic beverages, including juices, flavored waters, and functional drinks, appeal to a wide range of consumers seeking safe and nutritious options. Additionally, advancements in beverage formulations and the development of high-quality, gluten-free ingredients contribute to the segment's rapid growth. The expansion of product offerings and the increasing availability of gluten-free non-alcoholic beverages in various retail channels support the growth of this segment.
Gluten-Free Beverages Market Share Analysis: Distribution Channel (Health Stores, Convenience Stores, Supermarkets/Hypermarkets, Online Retailers, Others)
The online retailers segment is expected to be the fastest-growing in the Gluten-Free Beverages Market by distribution channel to 2032. The convenience and accessibility of online shopping, combined with the growing consumer preference for e-commerce, drive the rapid growth of this segment. Online platforms offer a wide variety of gluten-free beverages, detailed product descriptions, and customer reviews, making it easier for consumers to make informed purchasing decisions. The COVID-19 pandemic has further accelerated the shift towards online shopping, as consumers seek contactless and convenient ways to purchase their favorite beverages. Subscription services and direct-to-consumer models also contribute to the segment's expansion, providing consumers with regular deliveries of their preferred gluten-free beverages.
Gluten free Beverages Market Segmentation
By Type
Alcoholic beverage
-Fermented
-Distilled
-Others
Non-alcoholic beverage
-Carbonated
-Non-carbonated
By Distribution Channel
Health stores
Convenience Stores
Supermarkets/ Hypermarkets
Online retailers
Others
Countries Analyzed
North America (US, Canada, Mexico)
Europe (Germany, UK, France, Spain, Italy, Russia, Rest of Europe)
Asia Pacific (China, India, Japan, South Korea, Australia, South East Asia, Rest of Asia)
South America (Brazil, Argentina, Rest of South America)
Middle East and Africa (Saudi Arabia, UAE, Rest of Middle East, South Africa, Egypt, Rest of Africa)
Gluten free Beverages Companies Profiled in the Study
Bob's Red Mill Natural Foods
Diageo PLC
Dohler GmbH
Hain Celestial Group Inc
Koninklijke DSM NV
New Planet Beer
PepsiCo Inc
The Coca-Cola Company
The Dannon Company Inc
The WhiteWave Foods Company
*- List Not Exhaustive
Chapter 1. TABLE OF CONTENTS
Chapter 2. Introduction to Gluten free Beverages Market
2.1. Market Overview
2.2. Key Statistics and Report Highlights
2.3. Scope of the Comprehensive Study
2.3.1. Market Definition
2.3.2 Countries and Regions Covered
2.3.3 Research Objective
2.3.4 Units, Currency, and Conversions
2.3.5 Industry Value Chain
2.4. Key Market Segments
2.5. Key Companies
2.6. Study Period
Chapter 3. Strategic Analysis Review
3.1. Gluten free Beverages Pricing Analysis and Forecast
3.2. Porter’s Five Forces
3.3. Market Ecosystem
3.4. SWOT Analysis
3.5. Regulatory Scenario
3.3. Effects of Inflation, Russia-Ukraine War, moderating economic growth, and other macroeconomic factors
Chapter 4. Competitive Landscape
4.1. Market Share Analysis
4.1.1. Global Gluten free Beverages Market Share by Company, 2023
4.1.2. Product Offerings of Leading Gluten free Beverages Companies
4.2. Market Entropy
4.2.1. New Product Launches in the Industry
4.2.2. Mergers, Acquisitions, Joint ventures, and Partnerships
4.3. Key Strategies and Best Practices
Chapter 5. Global Market Projections: Best, Reference, and Low Case Scenarios
5.1. Growth Analysis- Case Scenario Definitions
5.2. Low Growth Case Scenario Forecasts
5.3. Reference Growth Case Scenario Forecasts
5.4. High Growth Case Scenario Forecasts
Chapter 6. Market Dynamics
6.1. Gluten free Beverages Market Drivers
6.2. Gluten free Beverages Market Challenges
6.6. Gluten free Beverages Market Opportunities
6.4. Gluten free Beverages Market Trends
Chapter 7. Global Gluten free Beverages Market Outlook Trends
7.1. Global Gluten free Beverages Revenue (USD Million) and CAGR (%) by Type (2021-2032)
7.2. Global Gluten free Beverages Revenue (USD Million) and CAGR (%) by Application (2021-2032)
7.3. Global Gluten free Beverages Revenue (USD Million) and CAGR (%) by Product (2021-2032)
By Type
Alcoholic beverage
-Fermented
-Distilled
-Others
Non-alcoholic beverage
-Carbonated
-Non-carbonated
By Distribution Channel
Health stores
Convenience Stores
Supermarkets/ Hypermarkets
Online retailers
Others
Chapter 8. Global Gluten free Beverages Regional Analysis and Outlook
8.1. Global Gluten free Beverages Revenue (USD Million) By Regions (2021- 2032)
8.2. North America Gluten free Beverages Revenue (USD Million) by Country (2021-2032)
8.2.1. United States Gluten free Beverages Regional Analysis and Outlook
8.2.2. Canada Gluten free Beverages Regional Analysis and Outlook
8.2.3. Mexico Gluten free Beverages Regional Analysis and Outlook
8.3. Europe Gluten free Beverages Revenue (USD Million), by Country (2021-2032)
8.3.1. Germany Gluten free Beverages Regional Analysis and Outlook
8.3.2. France Gluten free Beverages Regional Analysis and Outlook
8.3.3. United Kingdom Gluten free Beverages Regional Analysis and Outlook
8.3.4. Spain Gluten free Beverages Regional Analysis and Outlook
8.3.5. Italy Gluten free Beverages Regional Analysis and Outlook
8.3.6. Russia Gluten free Beverages Regional Analysis and Outlook
8.3.7. Rest of Europe Gluten free Beverages Regional Analysis and Outlook
8.4. Asia Pacific Gluten free Beverages Revenue (USD Million) by Country (2021-2032)
8.4.1. China Gluten free Beverages Regional Analysis and Outlook
8.4.2. Japan Gluten free Beverages Regional Analysis and Outlook
8.4.3. India Gluten free Beverages Regional Analysis and Outlook
8.4.4. South Korea Gluten free Beverages Regional Analysis and Outlook
8.4.5. Australia Gluten free Beverages Regional Analysis and Outlook
8.4.6. South East Asia Gluten free Beverages Regional Analysis and Outlook
8.4.7. Rest of Asia Pacific Gluten free Beverages Regional Analysis and Outlook
8.5. South America Gluten free Beverages Revenue (USD Million), by Country (2021-2032)
8.5.1. Brazil Gluten free Beverages Regional Analysis and Outlook
8.5.2. Argentina Gluten free Beverages Regional Analysis and Outlook
8.5.3. Rest of South America Gluten free Beverages Regional Analysis and Outlook
8.6. Middle East and Africa Gluten free Beverages Revenue (USD Million) by Country (2021-2032)
8.6.1. Middle East Gluten free Beverages Regional Analysis and Outlook
8.6.2. Africa Gluten free Beverages Regional Analysis and Outlook
Chapter 9. North America Gluten free Beverages Analysis and Outlook
9.1. North America Gluten free Beverages Revenue (USD Million) by Segments (2021-2032)
9.1.1. North America Gluten free Beverages Revenue (USD Million) by Type (2021-2032)
9.1.2. North America Gluten free Beverages Revenue (USD Million) by Application (2021-2032)
9.1.3. North America Gluten free Beverages Revenue (USD Million) by Product (2021-2032)
By Type
Alcoholic beverage
-Fermented
-Distilled
-Others
Non-alcoholic beverage
-Carbonated
-Non-carbonated
By Distribution Channel
Health stores
Convenience Stores
Supermarkets/ Hypermarkets
Online retailers
Others
Chapter 10. Europe Gluten free Beverages Analysis and Outlook
10.1. Europe Gluten free Beverages Revenue (USD Million), by Segments (USD Million) (2021-2032)
10.1.1. Europe Gluten free Beverages Revenue (USD Million) by Type (2021-2032)
10.1.2. Europe Gluten free Beverages Revenue (USD Million) by Application (2021-2032)
10.1.3. Europe Gluten free Beverages Revenue (USD Million) by Product (2021-2032)
By Type
Alcoholic beverage
-Fermented
-Distilled
-Others
Non-alcoholic beverage
-Carbonated
-Non-carbonated
By Distribution Channel
Health stores
Convenience Stores
Supermarkets/ Hypermarkets
Online retailers
Others
Chapter 11. Asia Pacific Gluten free Beverages Analysis and Outlook
11.1. Asia Pacific Gluten free Beverages Revenue (USD Million), and Revenue (USD Million) by Segments (2021-2032)
11.1.1. Asia Pacific Gluten free Beverages Revenue (USD Million) by Type (2021-2032)
11.1.2. Asia Pacific Gluten free Beverages Revenue (USD Million) by Application (2021-2032)
11.1.3. Asia Pacific Gluten free Beverages Revenue (USD Million) by Product (2021-2032)
By Type
Alcoholic beverage
-Fermented
-Distilled
-Others
Non-alcoholic beverage
-Carbonated
-Non-carbonated
By Distribution Channel
Health stores
Convenience Stores
Supermarkets/ Hypermarkets
Online retailers
Others
Chapter 12. South America Gluten free Beverages Analysis and Outlook
12.1. South America Gluten free Beverages Revenue (USD Million), by Segments (2021-2032)
12.1.1. South America Gluten free Beverages Revenue (USD Million) by Type (2021-2032)
12.1.2. South America Gluten free Beverages Revenue (USD Million) by Application (2021-2032)
12.1.3. South America Gluten free Beverages Revenue (USD Million) by Product (2021-2032)
By Type
Alcoholic beverage
-Fermented
-Distilled
-Others
Non-alcoholic beverage
-Carbonated
-Non-carbonated
By Distribution Channel
Health stores
Convenience Stores
Supermarkets/ Hypermarkets
Online retailers
Others
Chapter 13. Middle East and Africa Gluten free Beverages Analysis and Outlook
13.1. Middle East and Africa Gluten free Beverages Revenue (USD Million), by Segments (2021-2032)
13.1.1. Middle East and Africa Gluten free Beverages Revenue (USD Million) by Type (2021-2032)
13.1.2. Middle East and Africa Gluten free Beverages Revenue (USD Million) by Application (2021-2032)
13.1.3. Middle East and Africa Gluten free Beverages Revenue (USD Million) by Product (2021-2032)
By Type
Alcoholic beverage
-Fermented
-Distilled
-Others
Non-alcoholic beverage
-Carbonated
-Non-carbonated
By Distribution Channel
Health stores
Convenience Stores
Supermarkets/ Hypermarkets
Online retailers
Others
Chapter 14. Gluten free Beverages Company Profiles
14.1 Business Overview
14.2 Product Profiles
14.3 SWOT Profiles
14.5 Recent Developments
14.6 Financial Profile
List of Companies
Bob's Red Mill Natural Foods
Diageo PLC
Dohler GmbH
Hain Celestial Group Inc
Koninklijke DSM NV
New Planet Beer
PepsiCo Inc
The Coca-Cola Company
The Dannon Company Inc
The WhiteWave Foods Company
15. Methodology and Data Sources
15.1 Customization Offerings
15.2 Subscription Services
15.3 Related Reports
15.4 Publisher Expertise
LIST OF TABLES
Table 1 Market Segmentation Analysis
Table 2 Global Gluten free Beverages Market Share of Leading Companies, 2023
Table 3 Product Offerings of Leading Companies
Table 4 Low Growth Scenario Forecasts
Table 5 Reference Case Growth Scenario
Table 6 High Growth Case Scenario
Table 7 Global Gluten free Beverages Revenue (USD Million) And CAGR (%) By Type (2021-2032)
Table 8 Global Gluten free Beverages Revenue (USD Million) And CAGR (%) By Application (2021-2032)
Table 9 Global Gluten free Beverages Revenue (USD Million) And CAGR (%) By Product (2021-2032)
Table 10 Global Gluten free Beverages Market Revenue (USD Million) By Regions (2021-2032)
Table 11 Global Gluten free Beverages Market Share (%) By Regions (2021-2032)
Table 12 North America Gluten free Beverages Revenue (USD Million) By Country (2021-2032)
Table 13 Europe Gluten free Beverages Revenue (USD Million) By Country (2021-2032)
Table 14 Asia Pacific Gluten free Beverages Revenue (USD Million) By Country (2021-2032)
Table 15 South America Gluten free Beverages Revenue (USD Million) By Country (2021-2032)
Table 16 Middle East and Africa Gluten free Beverages Revenue (USD Million) By Region (2021-2032)
Table 17 North America Gluten free Beverages Revenue (USD Million) By Type (2021-2032)
Table 18 North America Gluten free Beverages Revenue (USD Million) By Application (2021-2032)
Table 19 North America Gluten free Beverages Revenue (USD Million) By Product (2021-2032)
Table 20 Europe Gluten free Beverages Revenue (USD Million) By Type (2021-2032)
Table 21 Europe Gluten free Beverages Revenue (USD Million) By Application (2021-2032)
Table 22 Europe Gluten free Beverages Revenue (USD Million) By Product (2021-2032)
Table 23 Asia Pacific Gluten free Beverages Revenue (USD Million) By Type (2021-2032)
Table 24 Asia Pacific Gluten free Beverages Revenue (USD Million) By Application (2021-2032)
Table 25 Asia Pacific Gluten free Beverages Revenue (USD Million) By Product (2021-2032)
Table 26 South America Gluten free Beverages Revenue (USD Million) By Type (2021-2032)
Table 27 South America Gluten free Beverages Revenue (USD Million) By Application (2021-2032)
Table 28 South America Gluten free Beverages Revenue (USD Million) By Product (2021-2032)
Table 29 Middle East and Africa Gluten free Beverages Revenue (USD Million) By Type (2021-2032)
Table 30 Middle East and Africa Gluten free Beverages Revenue (USD Million) By Application (2021-2032)
Table 31 Middle East and Africa Gluten free Beverages Revenue (USD Million) By Product (2021-2032)
LIST OF FIGURES
Figure 1. Market Scope
Figure 2. Pricing Forecasts Per Unit, 2023- 2032
Figure 3. Porter’s Five Forces
Figure 4. Global Gluten free Beverages Market Revenue (USD Million) By Regions (2021-2032)
Figure 5. Global Gluten free Beverages Market Share (%) By Regions (2023)
Figure 6. North America Gluten free Beverages Revenue (USD Million) By Country (2021-2032)
Figure 7. United States Gluten free Beverages Revenue (USD Million) By Country (2021-2032)
Figure 8. Canada Gluten free Beverages Revenue (USD Million) By Country (2021-2032)
Figure 9. Mexico Gluten free Beverages Revenue (USD Million) By Country (2021-2032)
Figure 10. Europe Gluten free Beverages Revenue (USD Million) By Country (2021-2032)
Figure 11. Germany Gluten free Beverages Revenue (USD Million) By Country (2021-2032)
Figure 12. France Gluten free Beverages Revenue (USD Million) By Country (2021-2032)
Figure 13. United Kingdom Gluten free Beverages Revenue (USD Million) By Country (2021-2032)
Figure 14. Spain Gluten free Beverages Revenue (USD Million) By Country (2021-2032)
Figure 15. Italy Gluten free Beverages Revenue (USD Million) By Country (2021-2032)
Figure 16. Russia Gluten free Beverages Revenue (USD Million) By Country (2021-2032)
Figure 17. Rest of Europe Gluten free Beverages Revenue (USD Million) By Country (2021-2032)
Figure 11. Asia Pacific Gluten free Beverages Revenue (USD Million) By Country (2021-2032)
Figure 12. China Gluten free Beverages Revenue (USD Million) By Country (2021-2032)
Figure 13. Japan Gluten free Beverages Revenue (USD Million) By Country (2021-2032)
Figure 14. India Gluten free Beverages Revenue (USD Million) By Country (2021-2032)
Figure 15. South Korea Gluten free Beverages Revenue (USD Million) By Country (2021-2032)
Figure 16. Australia Gluten free Beverages Revenue (USD Million) By Country (2021-2032)
Figure 17. South East Asia Gluten free Beverages Revenue (USD Million) By Country (2021-2032)
Figure 18. South America Gluten free Beverages Revenue (USD Million) By Country (2021-2032)
Figure 19. Brazil Gluten free Beverages Revenue (USD Million) By Country (2021-2032)
Figure 20. Argentina Gluten free Beverages Revenue (USD Million) By Country (2021-2032)
Figure 21. Rest of Asia Pacific Gluten free Beverages Revenue (USD Million) By Country (2021-2032)
Figure 22. Middle East and Africa Gluten free Beverages Revenue (USD Million) By Region (2021-2032)
Figure 23. Saudi Arabia Gluten free Beverages Revenue (USD Million) By Region (2021-2032)
Figure 24. The UAE Gluten free Beverages Revenue (USD Million) By Region (2021-2032)
Figure 25. Rest of Middle East Gluten free Beverages Revenue (USD Million) By Region (2021-2032)
Figure 26. South Africa Gluten free Beverages Revenue (USD Million) By Region (2021-2032)
Figure 27. Africa Gluten free Beverages Revenue (USD Million) By Region (2021-2032)
Figure 28. North America Gluten free Beverages Revenue (USD Million) By Type (2021-2032)
Figure 29. North America Gluten free Beverages Revenue (USD Million) By Application (2021-2032)
Figure 30. North America Gluten free Beverages Revenue (USD Million) By Product (2021-2032)
Figure 31. Europe Gluten free Beverages Revenue (USD Million) By Type (2021-2032)
Figure 32. Europe Gluten free Beverages Revenue (USD Million) By Application (2021-2032)
Figure 33. Europe Gluten free Beverages Revenue (USD Million) By Product (2021-2032)
Figure 34. Asia Pacific Gluten free Beverages Revenue (USD Million) By Type (2021-2032)
Figure 35. Asia Pacific Gluten free Beverages Revenue (USD Million) By Application (2021-2032)
Figure 36. Asia Pacific Gluten free Beverages Revenue (USD Million) By Product (2021-2032)
Figure 37. South America Gluten free Beverages Revenue (USD Million) By Type (2021-2032)
Figure 38. South America Gluten free Beverages Revenue (USD Million) By Application (2021-2032)
Figure 39. South America Gluten free Beverages Revenue (USD Million) By Product (2021-2032)
Figure 40. Middle East and Africa Gluten free Beverages Revenue (USD Million) By Type (2021-2032)
Figure 41. Middle East and Africa Gluten free Beverages Revenue (USD Million) By Application (2021-2032)
Figure 42. Middle East and Africa Gluten free Beverages Revenue (USD Million) By Product (2021-2032)
By Type
Alcoholic beverage
-Fermented
-Distilled
-Others
Non-alcoholic beverage
-Carbonated
-Non-carbonated
By Distribution Channel
Health stores
Convenience Stores
Supermarkets/ Hypermarkets
Online retailers
Others
Countries Analyzed
North America (US, Canada, Mexico)
Europe (Germany, UK, France, Spain, Italy, Russia, Rest of Europe)
Asia Pacific (China, India, Japan, South Korea, Australia, South East Asia, Rest of Asia)
South America (Brazil, Argentina, Rest of South America)
Middle East and Africa (Saudi Arabia, UAE, Rest of Middle East, South Africa, Egypt, Rest of Africa)
