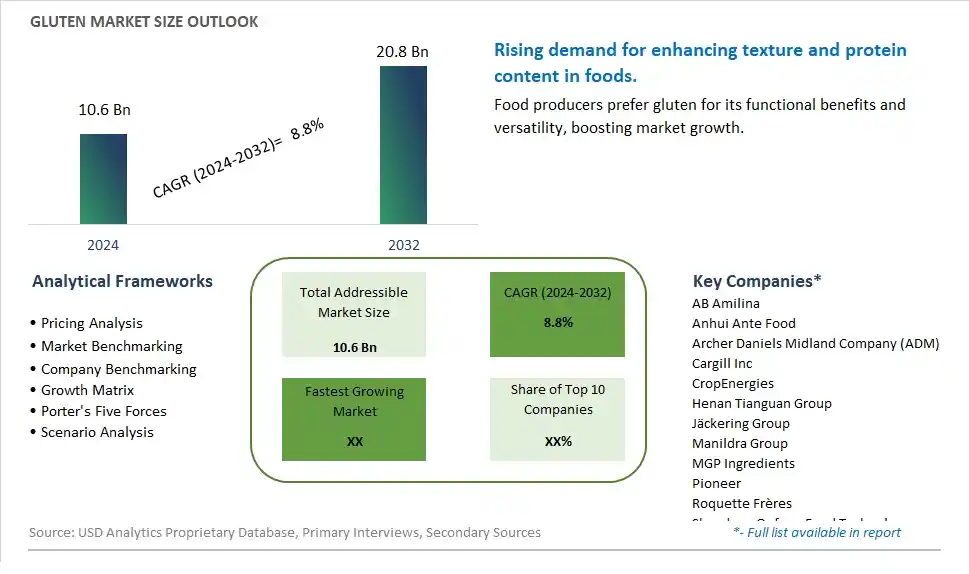
Global Gluten Market Size is valued at $10.6 Billion in 2024 and is forecast to register a growth rate (CAGR) of 8.8% to reach $20.8 Billion by 2032.
The global Gluten Market Comprehensive Study analyzes and forecasts the market size across 6 regions and 24 countries for diverse segments -By Type (Wheat Gluten, Corn Gluten, Others), By Application (Baking, Flour, Meat, Pet Food, Others)
An Introduction to Gluten Market
The Gluten market in 2024 is thriving, fueled by the rising demand for high-protein and functional ingredients in baking and food processing. Gluten, known for its viscoelastic properties, is essential in bread making and meat analogs. The market benefits from advancements in gluten extraction and processing technologies, the growing trend of high-protein and plant-based foods, and the expansion of the global bakery sector. Additionally, the increasing focus on clean label and natural ingredients is contributing to market growth.
Gluten Competitive Landscape
The market report analyses the leading companies in the industry including AB Amilina, Anhui Ante Food, Archer Daniels Midland Company (ADM), Cargill Inc, CropEnergies, Henan Tianguan Group, Jäckering Group, Manildra Group, MGP Ingredients, Pioneer, Roquette Frères, Shandong Qufeng Food Technology, Tereos Syral, White Energy, Zhonghe Group, and Others.
Gluten Market Dynamics
Gluten Market Trend: Increasing Demand for High-Quality Gluten in Food Production
The most prominent trend in the Gluten Market is the increasing demand for high-quality gluten in food production. As the food industry focuses on improving the texture and consistency of various products, gluten is gaining popularity for its functional properties. This trend is driven by the need for ingredients that enhance the quality of baked goods, meat substitutes, and other processed foods.
Gluten Market Driver: Growth in Bakery and Confectionery Industry
The key driver of the Gluten Market is the growth in the bakery and confectionery industry. As more consumers enjoy baked goods and desserts, there is a higher demand for gluten that can improve dough elasticity and product texture. This driver is supported by the trend towards artisanal and high-quality baked products, driving market growth for gluten as a key ingredient.
Gluten Market Opportunity: Development of Specialty Gluten Products
A significant opportunity in the Gluten Market lies in the development of specialty gluten products. By creating gluten variants that cater to specific culinary needs, such as high-protein or low-sodium options, companies can attract both commercial producers and home bakers. Offering innovative gluten products that enhance the quality and nutritional profile of food items can help expand market reach and drive growth in the food industry.
Gluten Market Share Analysis: Wheat Gluten segment generated the highest revenue share in the industry
Among the types listed in the Gluten market segmentation, Wheat Gluten emerges as the largest segment. Wheat gluten, also known as wheat protein, is a vital component in the food industry, particularly in baking and as a protein additive in various processed foods. It is extracted from wheat flour after starch and other components are washed away, leaving a cohesive mass of gluten protein. Wheat gluten's popularity stems from its unique viscoelastic properties, which contribute to dough elasticity, texture improvement, and moisture retention in baked goods such as bread, cakes, and pastries. Additionally, wheat gluten serves as a key ingredient in vegetarian and vegan food products, offering a protein-rich alternative to meat. The segment's dominance is bolstered by the widespread consumption of wheat-based products globally and the growing demand for plant-based protein sources. As dietary trends shift towards healthier and sustainable food choices, wheat gluten continues to play a crucial role in meeting nutritional needs and enhancing product quality across various food applications.
Gluten Market Share Analysis: Pet Food is the fastest growing segment over the forecast period to 2032
The Pet Food segment is expected to be the fastest-growing within the Gluten market through 2032. This growth is driven by increasing pet ownership globally and rising consumer awareness of pet health and nutrition. Gluten, particularly from sources like wheat and corn, serves as a valuable ingredient in pet food formulations due to its protein content and binding properties, which contribute to the texture and palatability of pet foods. As pet owners seek high-quality and nutritious diets for their pets, gluten is incorporated into dry and wet pet foods, treats, and supplements to meet protein requirements and enhance digestibility. Further, the trend towards natural and grain-inclusive pet foods further supports the demand for gluten as a functional ingredient in premium and specialty pet diets. Manufacturers are innovating with gluten-based formulations to cater to specific dietary needs, including hypoallergenic and grain-free options, thereby driving growth in the Pet Food segment of the Gluten market. As the pet food industry continues to evolve with advancements in nutrition science and pet care, gluten remains integral to meeting the diverse dietary preferences and health considerations of pets worldwide.
Gluten Market Segmentation
By Type
Wheat Gluten
Corn Gluten
Others
By Application
Baking
Flour
Meat
Pet Food
Others
Countries Analyzed
North America (US, Canada, Mexico)
Europe (Germany, UK, France, Spain, Italy, Russia, Rest of Europe)
Asia Pacific (China, India, Japan, South Korea, Australia, South East Asia, Rest of Asia)
South America (Brazil, Argentina, Rest of South America)
Middle East and Africa (Saudi Arabia, UAE, Rest of Middle East, South Africa, Egypt, Rest of Africa)
Gluten Companies Profiled in the Study
AB Amilina
Anhui Ante Food
Archer Daniels Midland Company (ADM)
Cargill Inc
CropEnergies
Henan Tianguan Group
Jäckering Group
Manildra Group
MGP Ingredients
Pioneer
Roquette Frères
Shandong Qufeng Food Technology
Tereos Syral
White Energy
Zhonghe Group
*- List Not Exhaustive
Chapter 1. TABLE OF CONTENTS
Chapter 2. Introduction to Gluten Market
2.1. Market Overview
2.2. Key Statistics and Report Highlights
2.3. Scope of the Comprehensive Study
2.3.1. Market Definition
2.3.2 Countries and Regions Covered
2.3.3 Research Objective
2.3.4 Units, Currency, and Conversions
2.3.5 Industry Value Chain
2.4. Key Market Segments
2.5. Key Companies
2.6. Study Period
Chapter 3. Strategic Analysis Review
3.1. Gluten Pricing Analysis and Forecast
3.2. Porter’s Five Forces
3.3. Market Ecosystem
3.4. SWOT Analysis
3.5. Regulatory Scenario
3.3. Effects of Inflation, Russia-Ukraine War, moderating economic growth, and other macroeconomic factors
Chapter 4. Competitive Landscape
4.1. Market Share Analysis
4.1.1. Global Gluten Market Share by Company, 2023
4.1.2. Product Offerings of Leading Gluten Companies
4.2. Market Entropy
4.2.1. New Product Launches in the Industry
4.2.2. Mergers, Acquisitions, Joint ventures, and Partnerships
4.3. Key Strategies and Best Practices
Chapter 5. Global Market Projections: Best, Reference, and Low Case Scenarios
5.1. Growth Analysis- Case Scenario Definitions
5.2. Low Growth Case Scenario Forecasts
5.3. Reference Growth Case Scenario Forecasts
5.4. High Growth Case Scenario Forecasts
Chapter 6. Market Dynamics
6.1. Gluten Market Drivers
6.2. Gluten Market Challenges
6.6. Gluten Market Opportunities
6.4. Gluten Market Trends
Chapter 7. Global Gluten Market Outlook Trends
7.1. Global Gluten Revenue (USD Million) and CAGR (%) by Type (2021-2032)
7.2. Global Gluten Revenue (USD Million) and CAGR (%) by Application (2021-2032)
7.3. Global Gluten Revenue (USD Million) and CAGR (%) by Product (2021-2032)
By Type
Wheat Gluten
Corn Gluten
Others
By Application
Baking
Flour
Meat
Pet Food
Others
Chapter 8. Global Gluten Regional Analysis and Outlook
8.1. Global Gluten Revenue (USD Million) By Regions (2021- 2032)
8.2. North America Gluten Revenue (USD Million) by Country (2021-2032)
8.2.1. United States Gluten Regional Analysis and Outlook
8.2.2. Canada Gluten Regional Analysis and Outlook
8.2.3. Mexico Gluten Regional Analysis and Outlook
8.3. Europe Gluten Revenue (USD Million), by Country (2021-2032)
8.3.1. Germany Gluten Regional Analysis and Outlook
8.3.2. France Gluten Regional Analysis and Outlook
8.3.3. United Kingdom Gluten Regional Analysis and Outlook
8.3.4. Spain Gluten Regional Analysis and Outlook
8.3.5. Italy Gluten Regional Analysis and Outlook
8.3.6. Russia Gluten Regional Analysis and Outlook
8.3.7. Rest of Europe Gluten Regional Analysis and Outlook
8.4. Asia Pacific Gluten Revenue (USD Million) by Country (2021-2032)
8.4.1. China Gluten Regional Analysis and Outlook
8.4.2. Japan Gluten Regional Analysis and Outlook
8.4.3. India Gluten Regional Analysis and Outlook
8.4.4. South Korea Gluten Regional Analysis and Outlook
8.4.5. Australia Gluten Regional Analysis and Outlook
8.4.6. South East Asia Gluten Regional Analysis and Outlook
8.4.7. Rest of Asia Pacific Gluten Regional Analysis and Outlook
8.5. South America Gluten Revenue (USD Million), by Country (2021-2032)
8.5.1. Brazil Gluten Regional Analysis and Outlook
8.5.2. Argentina Gluten Regional Analysis and Outlook
8.5.3. Rest of South America Gluten Regional Analysis and Outlook
8.6. Middle East and Africa Gluten Revenue (USD Million) by Country (2021-2032)
8.6.1. Middle East Gluten Regional Analysis and Outlook
8.6.2. Africa Gluten Regional Analysis and Outlook
Chapter 9. North America Gluten Analysis and Outlook
9.1. North America Gluten Revenue (USD Million) by Segments (2021-2032)
9.1.1. North America Gluten Revenue (USD Million) by Type (2021-2032)
9.1.2. North America Gluten Revenue (USD Million) by Application (2021-2032)
9.1.3. North America Gluten Revenue (USD Million) by Product (2021-2032)
By Type
Wheat Gluten
Corn Gluten
Others
By Application
Baking
Flour
Meat
Pet Food
Others
Chapter 10. Europe Gluten Analysis and Outlook
10.1. Europe Gluten Revenue (USD Million), by Segments (USD Million) (2021-2032)
10.1.1. Europe Gluten Revenue (USD Million) by Type (2021-2032)
10.1.2. Europe Gluten Revenue (USD Million) by Application (2021-2032)
10.1.3. Europe Gluten Revenue (USD Million) by Product (2021-2032)
By Type
Wheat Gluten
Corn Gluten
Others
By Application
Baking
Flour
Meat
Pet Food
Others
Chapter 11. Asia Pacific Gluten Analysis and Outlook
11.1. Asia Pacific Gluten Revenue (USD Million), and Revenue (USD Million) by Segments (2021-2032)
11.1.1. Asia Pacific Gluten Revenue (USD Million) by Type (2021-2032)
11.1.2. Asia Pacific Gluten Revenue (USD Million) by Application (2021-2032)
11.1.3. Asia Pacific Gluten Revenue (USD Million) by Product (2021-2032)
By Type
Wheat Gluten
Corn Gluten
Others
By Application
Baking
Flour
Meat
Pet Food
Others
Chapter 12. South America Gluten Analysis and Outlook
12.1. South America Gluten Revenue (USD Million), by Segments (2021-2032)
12.1.1. South America Gluten Revenue (USD Million) by Type (2021-2032)
12.1.2. South America Gluten Revenue (USD Million) by Application (2021-2032)
12.1.3. South America Gluten Revenue (USD Million) by Product (2021-2032)
By Type
Wheat Gluten
Corn Gluten
Others
By Application
Baking
Flour
Meat
Pet Food
Others
Chapter 13. Middle East and Africa Gluten Analysis and Outlook
13.1. Middle East and Africa Gluten Revenue (USD Million), by Segments (2021-2032)
13.1.1. Middle East and Africa Gluten Revenue (USD Million) by Type (2021-2032)
13.1.2. Middle East and Africa Gluten Revenue (USD Million) by Application (2021-2032)
13.1.3. Middle East and Africa Gluten Revenue (USD Million) by Product (2021-2032)
By Type
Wheat Gluten
Corn Gluten
Others
By Application
Baking
Flour
Meat
Pet Food
Others
Chapter 14. Gluten Company Profiles
14.1 Business Overview
14.2 Product Profiles
14.3 SWOT Profiles
14.5 Recent Developments
14.6 Financial Profile
List of Companies
AB Amilina
Anhui Ante Food
Archer Daniels Midland Company (ADM)
Cargill Inc
CropEnergies
Henan Tianguan Group
Jäckering Group
Manildra Group
MGP Ingredients
Pioneer
Roquette Frères
Shandong Qufeng Food Technology
Tereos Syral
White Energy
Zhonghe Group
15. Methodology and Data Sources
15.1 Customization Offerings
15.2 Subscription Services
15.3 Related Reports
15.4 Publisher Expertise
LIST OF TABLES
Table 1 Market Segmentation Analysis
Table 2 Global Gluten Market Share of Leading Companies, 2023
Table 3 Product Offerings of Leading Companies
Table 4 Low Growth Scenario Forecasts
Table 5 Reference Case Growth Scenario
Table 6 High Growth Case Scenario
Table 7 Global Gluten Revenue (USD Million) And CAGR (%) By Type (2021-2032)
Table 8 Global Gluten Revenue (USD Million) And CAGR (%) By Application (2021-2032)
Table 9 Global Gluten Revenue (USD Million) And CAGR (%) By Product (2021-2032)
Table 10 Global Gluten Market Revenue (USD Million) By Regions (2021-2032)
Table 11 Global Gluten Market Share (%) By Regions (2021-2032)
Table 12 North America Gluten Revenue (USD Million) By Country (2021-2032)
Table 13 Europe Gluten Revenue (USD Million) By Country (2021-2032)
Table 14 Asia Pacific Gluten Revenue (USD Million) By Country (2021-2032)
Table 15 South America Gluten Revenue (USD Million) By Country (2021-2032)
Table 16 Middle East and Africa Gluten Revenue (USD Million) By Region (2021-2032)
Table 17 North America Gluten Revenue (USD Million) By Type (2021-2032)
Table 18 North America Gluten Revenue (USD Million) By Application (2021-2032)
Table 19 North America Gluten Revenue (USD Million) By Product (2021-2032)
Table 20 Europe Gluten Revenue (USD Million) By Type (2021-2032)
Table 21 Europe Gluten Revenue (USD Million) By Application (2021-2032)
Table 22 Europe Gluten Revenue (USD Million) By Product (2021-2032)
Table 23 Asia Pacific Gluten Revenue (USD Million) By Type (2021-2032)
Table 24 Asia Pacific Gluten Revenue (USD Million) By Application (2021-2032)
Table 25 Asia Pacific Gluten Revenue (USD Million) By Product (2021-2032)
Table 26 South America Gluten Revenue (USD Million) By Type (2021-2032)
Table 27 South America Gluten Revenue (USD Million) By Application (2021-2032)
Table 28 South America Gluten Revenue (USD Million) By Product (2021-2032)
Table 29 Middle East and Africa Gluten Revenue (USD Million) By Type (2021-2032)
Table 30 Middle East and Africa Gluten Revenue (USD Million) By Application (2021-2032)
Table 31 Middle East and Africa Gluten Revenue (USD Million) By Product (2021-2032)
LIST OF FIGURES
Figure 1. Market Scope
Figure 2. Pricing Forecasts Per Unit, 2023- 2032
Figure 3. Porter’s Five Forces
Figure 4. Global Gluten Market Revenue (USD Million) By Regions (2021-2032)
Figure 5. Global Gluten Market Share (%) By Regions (2023)
Figure 6. North America Gluten Revenue (USD Million) By Country (2021-2032)
Figure 7. United States Gluten Revenue (USD Million) By Country (2021-2032)
Figure 8. Canada Gluten Revenue (USD Million) By Country (2021-2032)
Figure 9. Mexico Gluten Revenue (USD Million) By Country (2021-2032)
Figure 10. Europe Gluten Revenue (USD Million) By Country (2021-2032)
Figure 11. Germany Gluten Revenue (USD Million) By Country (2021-2032)
Figure 12. France Gluten Revenue (USD Million) By Country (2021-2032)
Figure 13. United Kingdom Gluten Revenue (USD Million) By Country (2021-2032)
Figure 14. Spain Gluten Revenue (USD Million) By Country (2021-2032)
Figure 15. Italy Gluten Revenue (USD Million) By Country (2021-2032)
Figure 16. Russia Gluten Revenue (USD Million) By Country (2021-2032)
Figure 17. Rest of Europe Gluten Revenue (USD Million) By Country (2021-2032)
Figure 11. Asia Pacific Gluten Revenue (USD Million) By Country (2021-2032)
Figure 12. China Gluten Revenue (USD Million) By Country (2021-2032)
Figure 13. Japan Gluten Revenue (USD Million) By Country (2021-2032)
Figure 14. India Gluten Revenue (USD Million) By Country (2021-2032)
Figure 15. South Korea Gluten Revenue (USD Million) By Country (2021-2032)
Figure 16. Australia Gluten Revenue (USD Million) By Country (2021-2032)
Figure 17. South East Asia Gluten Revenue (USD Million) By Country (2021-2032)
Figure 18. South America Gluten Revenue (USD Million) By Country (2021-2032)
Figure 19. Brazil Gluten Revenue (USD Million) By Country (2021-2032)
Figure 20. Argentina Gluten Revenue (USD Million) By Country (2021-2032)
Figure 21. Rest of Asia Pacific Gluten Revenue (USD Million) By Country (2021-2032)
Figure 22. Middle East and Africa Gluten Revenue (USD Million) By Region (2021-2032)
Figure 23. Saudi Arabia Gluten Revenue (USD Million) By Region (2021-2032)
Figure 24. The UAE Gluten Revenue (USD Million) By Region (2021-2032)
Figure 25. Rest of Middle East Gluten Revenue (USD Million) By Region (2021-2032)
Figure 26. South Africa Gluten Revenue (USD Million) By Region (2021-2032)
Figure 27. Africa Gluten Revenue (USD Million) By Region (2021-2032)
Figure 28. North America Gluten Revenue (USD Million) By Type (2021-2032)
Figure 29. North America Gluten Revenue (USD Million) By Application (2021-2032)
Figure 30. North America Gluten Revenue (USD Million) By Product (2021-2032)
Figure 31. Europe Gluten Revenue (USD Million) By Type (2021-2032)
Figure 32. Europe Gluten Revenue (USD Million) By Application (2021-2032)
Figure 33. Europe Gluten Revenue (USD Million) By Product (2021-2032)
Figure 34. Asia Pacific Gluten Revenue (USD Million) By Type (2021-2032)
Figure 35. Asia Pacific Gluten Revenue (USD Million) By Application (2021-2032)
Figure 36. Asia Pacific Gluten Revenue (USD Million) By Product (2021-2032)
Figure 37. South America Gluten Revenue (USD Million) By Type (2021-2032)
Figure 38. South America Gluten Revenue (USD Million) By Application (2021-2032)
Figure 39. South America Gluten Revenue (USD Million) By Product (2021-2032)
Figure 40. Middle East and Africa Gluten Revenue (USD Million) By Type (2021-2032)
Figure 41. Middle East and Africa Gluten Revenue (USD Million) By Application (2021-2032)
Figure 42. Middle East and Africa Gluten Revenue (USD Million) By Product (2021-2032)
By Type
Wheat Gluten
Corn Gluten
Others
By Application
Baking
Flour
Meat
Pet Food
Others
Countries Analyzed
North America (US, Canada, Mexico)
Europe (Germany, UK, France, Spain, Italy, Russia, Rest of Europe)
Asia Pacific (China, India, Japan, South Korea, Australia, South East Asia, Rest of Asia)
South America (Brazil, Argentina, Rest of South America)
Middle East and Africa (Saudi Arabia, UAE, Rest of Middle East, South Africa, Egypt, Rest of Africa)
