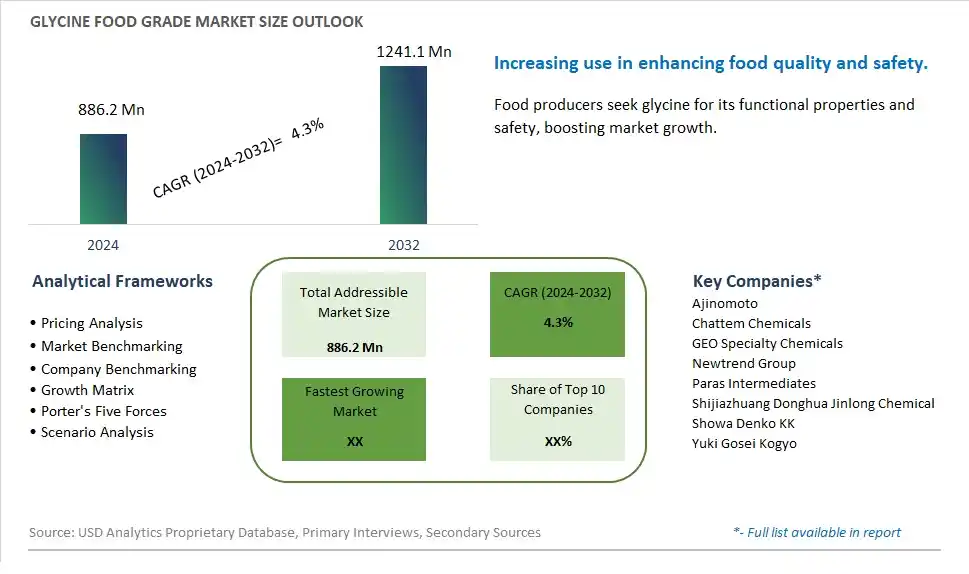
Global Glycine Food Grade Market Size is valued at $886.2 Million in 2024 and is forecast to register a growth rate (CAGR) of 4.3% to reach $1241.1 Million by 2032.
The global Glycine Food Grade Market Comprehensive Study analyzes and forecasts the market size across 6 regions and 24 countries for diverse segments -By Type (Content>0.99, Content>0.995, Content>0.998), By Application (Food, Feed)
An Introduction to Glycine Food Grade Market
In 2024, the Glycine Food Grade market is thriving, fueled by the rising demand for amino acids in food and beverage applications. Food-grade glycine, used as a sweetener, flavor enhancer, and nutritional supplement, is essential in various products, including dietary supplements and processed foods. The market benefits from advancements in amino acid production and formulation technologies, the growing trend of health-conscious and functional foods, and the expansion of the global food processing sector. Additionally, the increasing awareness of the health benefits of glycine, such as its role in protein synthesis and metabolic function, is contributing to market growth.
Glycine Food Grade Competitive Landscape
The market report analyses the leading companies in the industry including Ajinomoto, Chattem Chemicals, GEO Specialty Chemicals, Newtrend Group, Paras Intermediates, Shijiazhuang Donghua Jinlong Chemical, Showa Denko KK, Yuki Gosei Kogyo, and Others.
Glycine Food Grade Market Dynamics
Glycine Food Grade Market Trend: Increasing Use of Amino Acids in Food Fortification
The most prominent trend in the Glycine Food Grade Market is the increasing use of amino acids in food fortification. As consumers seek to enhance the nutritional value of their diets, glycine, an essential amino acid, is gaining popularity for its role in improving protein content and overall health benefits in food products. This trend is driven by the growing demand for functional foods that offer targeted health benefits.
Glycine Food Grade Market Driver: Growth in Health and Wellness Products
The key driver of the Glycine Food Grade Market is the growth in health and wellness products. As more consumers focus on maintaining a healthy lifestyle, there is a higher demand for food products that incorporate essential amino acids like glycine to enhance nutritional value. This driver is supported by the trend towards functional foods and beverages that provide specific health benefits, driving market growth for glycine food grade.
Glycine Food Grade Market Opportunity: Expansion into Functional Food and Beverage Applications
A significant opportunity in the Glycine Food Grade Market lies in the expansion into functional food and beverage applications. By developing innovative products that incorporate glycine to enhance taste, texture, and nutritional content, companies can cater to the evolving preferences of health-conscious consumers. Offering glycine-enriched products in various formats, such as protein shakes, energy bars, and dietary supplements, can help expand market reach and drive growth in the functional food sector.
Glycine Food Grade Market Share Analysis: Content > 0.99 segment generated the highest revenue share in the industry
In the Glycine Food Grade Market, the segment with glycine content greater than 99% (Content > 0.99) emerges as the largest. Glycine, a non-essential amino acid, finds extensive application across various industries due to its role as a building block in proteins and its versatile properties in food and pharmaceutical formulations. The Content > 0.99 grade of glycine is highly sought after for its purity and consistency, making it suitable for food applications where quality and safety standards are paramount. This segment dominates the market due to its widespread use in food processing, particularly in enhancing flavors, stabilizing textures, and acting as a nutrient supplement in food products.
Glycine Food Grade Market Share Analysis: Food Application is the fastest growing segment over the forecast period to 2032
Among the applications in the Glycine Food Grade Market, the Food segment is experiencing the fastest growth trajectory leading up to 2032. This growth is driven by the increasing consumer demand for processed and convenience foods, where glycine serves various functions such as a flavor enhancer, pH regulator, and preservative. Glycine is valued for its ability to improve taste profiles and mask undesirable flavors in food formulations. Further, as dietary supplements gain popularity, glycine is incorporated into functional food products targeting health-conscious consumers. The Food segment's rapid expansion is also supported by advancements in food technology and manufacturing processes that facilitate the incorporation of glycine into a wide range of food categories, thereby driving its market growth significantly in the coming years.
Glycine Food Grade Market Segmentation
By Type
Content>0.99
Content>0.995
Content>0.998
By Application
Food
Feed
Countries Analyzed
North America (US, Canada, Mexico)
Europe (Germany, UK, France, Spain, Italy, Russia, Rest of Europe)
Asia Pacific (China, India, Japan, South Korea, Australia, South East Asia, Rest of Asia)
South America (Brazil, Argentina, Rest of South America)
Middle East and Africa (Saudi Arabia, UAE, Rest of Middle East, South Africa, Egypt, Rest of Africa)
Glycine Food Grade Companies Profiled in the Study
Ajinomoto
Chattem Chemicals
GEO Specialty Chemicals
Newtrend Group
Paras Intermediates
Shijiazhuang Donghua Jinlong Chemical
Showa Denko KK
Yuki Gosei Kogyo
*- List Not Exhaustive
Chapter 1. TABLE OF CONTENTS
Chapter 2. Introduction to Glycine Food Grade Market
2.1. Market Overview
2.2. Key Statistics and Report Highlights
2.3. Scope of the Comprehensive Study
2.3.1. Market Definition
2.3.2 Countries and Regions Covered
2.3.3 Research Objective
2.3.4 Units, Currency, and Conversions
2.3.5 Industry Value Chain
2.4. Key Market Segments
2.5. Key Companies
2.6. Study Period
Chapter 3. Strategic Analysis Review
3.1. Glycine Food Grade Pricing Analysis and Forecast
3.2. Porter’s Five Forces
3.3. Market Ecosystem
3.4. SWOT Analysis
3.5. Regulatory Scenario
3.3. Effects of Inflation, Russia-Ukraine War, moderating economic growth, and other macroeconomic factors
Chapter 4. Competitive Landscape
4.1. Market Share Analysis
4.1.1. Global Glycine Food Grade Market Share by Company, 2023
4.1.2. Product Offerings of Leading Glycine Food Grade Companies
4.2. Market Entropy
4.2.1. New Product Launches in the Industry
4.2.2. Mergers, Acquisitions, Joint ventures, and Partnerships
4.3. Key Strategies and Best Practices
Chapter 5. Global Market Projections: Best, Reference, and Low Case Scenarios
5.1. Growth Analysis- Case Scenario Definitions
5.2. Low Growth Case Scenario Forecasts
5.3. Reference Growth Case Scenario Forecasts
5.4. High Growth Case Scenario Forecasts
Chapter 6. Market Dynamics
6.1. Glycine Food Grade Market Drivers
6.2. Glycine Food Grade Market Challenges
6.6. Glycine Food Grade Market Opportunities
6.4. Glycine Food Grade Market Trends
Chapter 7. Global Glycine Food Grade Market Outlook Trends
7.1. Global Glycine Food Grade Revenue (USD Million) and CAGR (%) by Type (2021-2032)
7.2. Global Glycine Food Grade Revenue (USD Million) and CAGR (%) by Application (2021-2032)
7.3. Global Glycine Food Grade Revenue (USD Million) and CAGR (%) by Product (2021-2032)
By Type
Content>0.99
Content>0.995
Content>0.998
By Application
Food
Feed
Chapter 8. Global Glycine Food Grade Regional Analysis and Outlook
8.1. Global Glycine Food Grade Revenue (USD Million) By Regions (2021- 2032)
8.2. North America Glycine Food Grade Revenue (USD Million) by Country (2021-2032)
8.2.1. United States Glycine Food Grade Regional Analysis and Outlook
8.2.2. Canada Glycine Food Grade Regional Analysis and Outlook
8.2.3. Mexico Glycine Food Grade Regional Analysis and Outlook
8.3. Europe Glycine Food Grade Revenue (USD Million), by Country (2021-2032)
8.3.1. Germany Glycine Food Grade Regional Analysis and Outlook
8.3.2. France Glycine Food Grade Regional Analysis and Outlook
8.3.3. United Kingdom Glycine Food Grade Regional Analysis and Outlook
8.3.4. Spain Glycine Food Grade Regional Analysis and Outlook
8.3.5. Italy Glycine Food Grade Regional Analysis and Outlook
8.3.6. Russia Glycine Food Grade Regional Analysis and Outlook
8.3.7. Rest of Europe Glycine Food Grade Regional Analysis and Outlook
8.4. Asia Pacific Glycine Food Grade Revenue (USD Million) by Country (2021-2032)
8.4.1. China Glycine Food Grade Regional Analysis and Outlook
8.4.2. Japan Glycine Food Grade Regional Analysis and Outlook
8.4.3. India Glycine Food Grade Regional Analysis and Outlook
8.4.4. South Korea Glycine Food Grade Regional Analysis and Outlook
8.4.5. Australia Glycine Food Grade Regional Analysis and Outlook
8.4.6. South East Asia Glycine Food Grade Regional Analysis and Outlook
8.4.7. Rest of Asia Pacific Glycine Food Grade Regional Analysis and Outlook
8.5. South America Glycine Food Grade Revenue (USD Million), by Country (2021-2032)
8.5.1. Brazil Glycine Food Grade Regional Analysis and Outlook
8.5.2. Argentina Glycine Food Grade Regional Analysis and Outlook
8.5.3. Rest of South America Glycine Food Grade Regional Analysis and Outlook
8.6. Middle East and Africa Glycine Food Grade Revenue (USD Million) by Country (2021-2032)
8.6.1. Middle East Glycine Food Grade Regional Analysis and Outlook
8.6.2. Africa Glycine Food Grade Regional Analysis and Outlook
Chapter 9. North America Glycine Food Grade Analysis and Outlook
9.1. North America Glycine Food Grade Revenue (USD Million) by Segments (2021-2032)
9.1.1. North America Glycine Food Grade Revenue (USD Million) by Type (2021-2032)
9.1.2. North America Glycine Food Grade Revenue (USD Million) by Application (2021-2032)
9.1.3. North America Glycine Food Grade Revenue (USD Million) by Product (2021-2032)
By Type
Content>0.99
Content>0.995
Content>0.998
By Application
Food
Feed
Chapter 10. Europe Glycine Food Grade Analysis and Outlook
10.1. Europe Glycine Food Grade Revenue (USD Million), by Segments (USD Million) (2021-2032)
10.1.1. Europe Glycine Food Grade Revenue (USD Million) by Type (2021-2032)
10.1.2. Europe Glycine Food Grade Revenue (USD Million) by Application (2021-2032)
10.1.3. Europe Glycine Food Grade Revenue (USD Million) by Product (2021-2032)
By Type
Content>0.99
Content>0.995
Content>0.998
By Application
Food
Feed
Chapter 11. Asia Pacific Glycine Food Grade Analysis and Outlook
11.1. Asia Pacific Glycine Food Grade Revenue (USD Million), and Revenue (USD Million) by Segments (2021-2032)
11.1.1. Asia Pacific Glycine Food Grade Revenue (USD Million) by Type (2021-2032)
11.1.2. Asia Pacific Glycine Food Grade Revenue (USD Million) by Application (2021-2032)
11.1.3. Asia Pacific Glycine Food Grade Revenue (USD Million) by Product (2021-2032)
By Type
Content>0.99
Content>0.995
Content>0.998
By Application
Food
Feed
Chapter 12. South America Glycine Food Grade Analysis and Outlook
12.1. South America Glycine Food Grade Revenue (USD Million), by Segments (2021-2032)
12.1.1. South America Glycine Food Grade Revenue (USD Million) by Type (2021-2032)
12.1.2. South America Glycine Food Grade Revenue (USD Million) by Application (2021-2032)
12.1.3. South America Glycine Food Grade Revenue (USD Million) by Product (2021-2032)
By Type
Content>0.99
Content>0.995
Content>0.998
By Application
Food
Feed
Chapter 13. Middle East and Africa Glycine Food Grade Analysis and Outlook
13.1. Middle East and Africa Glycine Food Grade Revenue (USD Million), by Segments (2021-2032)
13.1.1. Middle East and Africa Glycine Food Grade Revenue (USD Million) by Type (2021-2032)
13.1.2. Middle East and Africa Glycine Food Grade Revenue (USD Million) by Application (2021-2032)
13.1.3. Middle East and Africa Glycine Food Grade Revenue (USD Million) by Product (2021-2032)
By Type
Content>0.99
Content>0.995
Content>0.998
By Application
Food
Feed
Chapter 14. Glycine Food Grade Company Profiles
14.1 Business Overview
14.2 Product Profiles
14.3 SWOT Profiles
14.5 Recent Developments
14.6 Financial Profile
List of Companies
Ajinomoto
Chattem Chemicals
GEO Specialty Chemicals
Newtrend Group
Paras Intermediates
Shijiazhuang Donghua Jinlong Chemical
Showa Denko KK
Yuki Gosei Kogyo
15. Methodology and Data Sources
15.1 Customization Offerings
15.2 Subscription Services
15.3 Related Reports
15.4 Publisher Expertise
LIST OF TABLES
Table 1 Market Segmentation Analysis
Table 2 Global Glycine Food Grade Market Share of Leading Companies, 2023
Table 3 Product Offerings of Leading Companies
Table 4 Low Growth Scenario Forecasts
Table 5 Reference Case Growth Scenario
Table 6 High Growth Case Scenario
Table 7 Global Glycine Food Grade Revenue (USD Million) And CAGR (%) By Type (2021-2032)
Table 8 Global Glycine Food Grade Revenue (USD Million) And CAGR (%) By Application (2021-2032)
Table 9 Global Glycine Food Grade Revenue (USD Million) And CAGR (%) By Product (2021-2032)
Table 10 Global Glycine Food Grade Market Revenue (USD Million) By Regions (2021-2032)
Table 11 Global Glycine Food Grade Market Share (%) By Regions (2021-2032)
Table 12 North America Glycine Food Grade Revenue (USD Million) By Country (2021-2032)
Table 13 Europe Glycine Food Grade Revenue (USD Million) By Country (2021-2032)
Table 14 Asia Pacific Glycine Food Grade Revenue (USD Million) By Country (2021-2032)
Table 15 South America Glycine Food Grade Revenue (USD Million) By Country (2021-2032)
Table 16 Middle East and Africa Glycine Food Grade Revenue (USD Million) By Region (2021-2032)
Table 17 North America Glycine Food Grade Revenue (USD Million) By Type (2021-2032)
Table 18 North America Glycine Food Grade Revenue (USD Million) By Application (2021-2032)
Table 19 North America Glycine Food Grade Revenue (USD Million) By Product (2021-2032)
Table 20 Europe Glycine Food Grade Revenue (USD Million) By Type (2021-2032)
Table 21 Europe Glycine Food Grade Revenue (USD Million) By Application (2021-2032)
Table 22 Europe Glycine Food Grade Revenue (USD Million) By Product (2021-2032)
Table 23 Asia Pacific Glycine Food Grade Revenue (USD Million) By Type (2021-2032)
Table 24 Asia Pacific Glycine Food Grade Revenue (USD Million) By Application (2021-2032)
Table 25 Asia Pacific Glycine Food Grade Revenue (USD Million) By Product (2021-2032)
Table 26 South America Glycine Food Grade Revenue (USD Million) By Type (2021-2032)
Table 27 South America Glycine Food Grade Revenue (USD Million) By Application (2021-2032)
Table 28 South America Glycine Food Grade Revenue (USD Million) By Product (2021-2032)
Table 29 Middle East and Africa Glycine Food Grade Revenue (USD Million) By Type (2021-2032)
Table 30 Middle East and Africa Glycine Food Grade Revenue (USD Million) By Application (2021-2032)
Table 31 Middle East and Africa Glycine Food Grade Revenue (USD Million) By Product (2021-2032)
LIST OF FIGURES
Figure 1. Market Scope
Figure 2. Pricing Forecasts Per Unit, 2023- 2032
Figure 3. Porter’s Five Forces
Figure 4. Global Glycine Food Grade Market Revenue (USD Million) By Regions (2021-2032)
Figure 5. Global Glycine Food Grade Market Share (%) By Regions (2023)
Figure 6. North America Glycine Food Grade Revenue (USD Million) By Country (2021-2032)
Figure 7. United States Glycine Food Grade Revenue (USD Million) By Country (2021-2032)
Figure 8. Canada Glycine Food Grade Revenue (USD Million) By Country (2021-2032)
Figure 9. Mexico Glycine Food Grade Revenue (USD Million) By Country (2021-2032)
Figure 10. Europe Glycine Food Grade Revenue (USD Million) By Country (2021-2032)
Figure 11. Germany Glycine Food Grade Revenue (USD Million) By Country (2021-2032)
Figure 12. France Glycine Food Grade Revenue (USD Million) By Country (2021-2032)
Figure 13. United Kingdom Glycine Food Grade Revenue (USD Million) By Country (2021-2032)
Figure 14. Spain Glycine Food Grade Revenue (USD Million) By Country (2021-2032)
Figure 15. Italy Glycine Food Grade Revenue (USD Million) By Country (2021-2032)
Figure 16. Russia Glycine Food Grade Revenue (USD Million) By Country (2021-2032)
Figure 17. Rest of Europe Glycine Food Grade Revenue (USD Million) By Country (2021-2032)
Figure 11. Asia Pacific Glycine Food Grade Revenue (USD Million) By Country (2021-2032)
Figure 12. China Glycine Food Grade Revenue (USD Million) By Country (2021-2032)
Figure 13. Japan Glycine Food Grade Revenue (USD Million) By Country (2021-2032)
Figure 14. India Glycine Food Grade Revenue (USD Million) By Country (2021-2032)
Figure 15. South Korea Glycine Food Grade Revenue (USD Million) By Country (2021-2032)
Figure 16. Australia Glycine Food Grade Revenue (USD Million) By Country (2021-2032)
Figure 17. South East Asia Glycine Food Grade Revenue (USD Million) By Country (2021-2032)
Figure 18. South America Glycine Food Grade Revenue (USD Million) By Country (2021-2032)
Figure 19. Brazil Glycine Food Grade Revenue (USD Million) By Country (2021-2032)
Figure 20. Argentina Glycine Food Grade Revenue (USD Million) By Country (2021-2032)
Figure 21. Rest of Asia Pacific Glycine Food Grade Revenue (USD Million) By Country (2021-2032)
Figure 22. Middle East and Africa Glycine Food Grade Revenue (USD Million) By Region (2021-2032)
Figure 23. Saudi Arabia Glycine Food Grade Revenue (USD Million) By Region (2021-2032)
Figure 24. The UAE Glycine Food Grade Revenue (USD Million) By Region (2021-2032)
Figure 25. Rest of Middle East Glycine Food Grade Revenue (USD Million) By Region (2021-2032)
Figure 26. South Africa Glycine Food Grade Revenue (USD Million) By Region (2021-2032)
Figure 27. Africa Glycine Food Grade Revenue (USD Million) By Region (2021-2032)
Figure 28. North America Glycine Food Grade Revenue (USD Million) By Type (2021-2032)
Figure 29. North America Glycine Food Grade Revenue (USD Million) By Application (2021-2032)
Figure 30. North America Glycine Food Grade Revenue (USD Million) By Product (2021-2032)
Figure 31. Europe Glycine Food Grade Revenue (USD Million) By Type (2021-2032)
Figure 32. Europe Glycine Food Grade Revenue (USD Million) By Application (2021-2032)
Figure 33. Europe Glycine Food Grade Revenue (USD Million) By Product (2021-2032)
Figure 34. Asia Pacific Glycine Food Grade Revenue (USD Million) By Type (2021-2032)
Figure 35. Asia Pacific Glycine Food Grade Revenue (USD Million) By Application (2021-2032)
Figure 36. Asia Pacific Glycine Food Grade Revenue (USD Million) By Product (2021-2032)
Figure 37. South America Glycine Food Grade Revenue (USD Million) By Type (2021-2032)
Figure 38. South America Glycine Food Grade Revenue (USD Million) By Application (2021-2032)
Figure 39. South America Glycine Food Grade Revenue (USD Million) By Product (2021-2032)
Figure 40. Middle East and Africa Glycine Food Grade Revenue (USD Million) By Type (2021-2032)
Figure 41. Middle East and Africa Glycine Food Grade Revenue (USD Million) By Application (2021-2032)
Figure 42. Middle East and Africa Glycine Food Grade Revenue (USD Million) By Product (2021-2032)
By Type
Content>0.99
Content>0.995
Content>0.998
By Application
Food
Feed
Countries Analyzed
North America (US, Canada, Mexico)
Europe (Germany, UK, France, Spain, Italy, Russia, Rest of Europe)
Asia Pacific (China, India, Japan, South Korea, Australia, South East Asia, Rest of Asia)
South America (Brazil, Argentina, Rest of South America)
Middle East and Africa (Saudi Arabia, UAE, Rest of Middle East, South Africa, Egypt, Rest of Africa)
