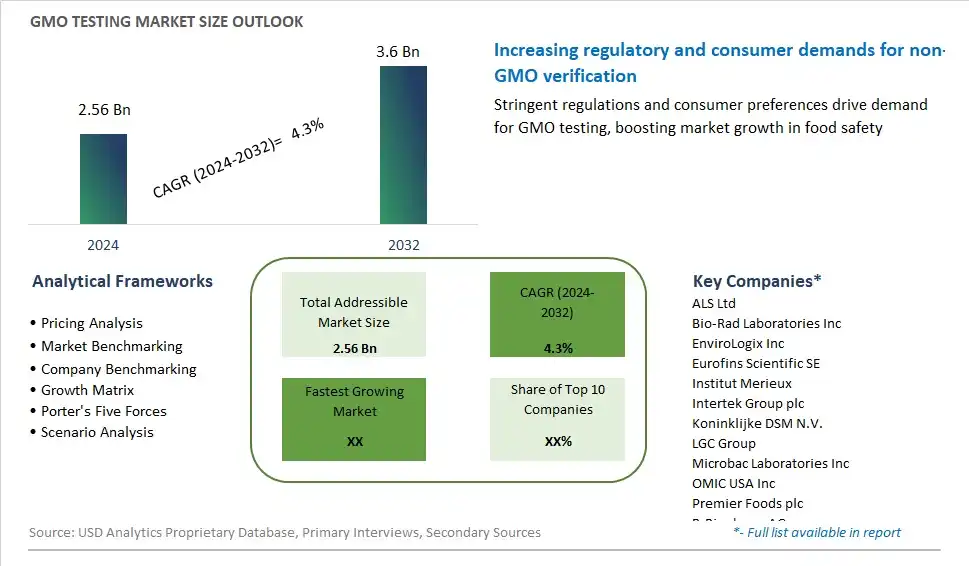
Global GMO Testing Market Size is valued at $2.56 Billion in 2024 and is forecast to register a growth rate (CAGR) of 4.3% to reach $3.6 Billion by 2032.
The global GMO Testing Market Comprehensive Study analyzes and forecasts the market size across 6 regions and 24 countries for diverse segments -By Trait (Stacked, Herbicide Tolerance, Insect Resistance), By Technology (Polymerase Chain Reaction (PCR), Immunoassay), By Crop (Corn, Soy, Rapeseed/Canola, Potato, Others), By Processed Food (Bakery & Confectionery, Meat & Meat Products, Breakfast Cereals & Snacks, Food Additives, Others)
An Introduction to GMO Testing Market
GMO testing involves the analysis of food and agricultural products to detect the presence of genetically modified organisms (GMOs) or genetically engineered (GE) ingredients in 2024. With increasing consumer concerns about food safety, environmental impact, and labeling transparency, GMO testing plays a crucial role in ensuring regulatory compliance, supply chain integrity, and consumer confidence. Testing methods for GMOs include DNA-based techniques such as polymerase chain reaction (PCR), immunoassays, and next-generation sequencing, which detect specific genetic sequences or proteins associated with genetically modified traits. These methods enable stakeholders across the food supply chain, including growers, processors, manufacturers, and regulators, to verify product authenticity, label claims, and compliance with GMO labeling regulations. With advancements in testing technology, automation, and data analytics, GMO testing laboratories can perform rapid, sensitive, and accurate testing to support regulatory compliance, risk management, and consumer transparency initiatives. As consumer awareness of GMOs and demand for non-GMO products continue to grow, the market for GMO testing is expected to expand, driven by investments in testing infrastructure, capacity expansion, and regulatory enforcement that ensure the safety and integrity of the food supply.
GMO Testing Competitive Landscape
The market report analyses the leading companies in the industry including ALS Ltd, Bio-Rad Laboratories Inc, EnviroLogix Inc, Eurofins Scientific SE, Institut Merieux, Intertek Group plc, Koninklijke DSM N.V., LGC Group, Microbac Laboratories Inc, OMIC USA Inc, Premier Foods plc, R-Biopharm AG, SGS SA, Thermo Fisher Scientific Inc, TUV SUD AG, and Others.
GMO Testing Market Dynamics
GMO Testing Market Trend: Increasing Stringency in GMO Labeling Regulations
One prominent trend in the GMO testing market is the increasing stringency in GMO labeling regulations. Governments and regulatory bodies worldwide are implementing stricter regulations regarding the labeling and identification of genetically modified organisms (GMOs) in food products. This trend is driven by growing consumer awareness and concerns about GMOs' potential health and environmental impacts. As a result, food manufacturers and producers are under pressure to ensure accurate GMO labeling and compliance with regulatory standards, leading to a rising demand for GMO testing services and technologies.
Market Driver: Consumer Demand for Non-GMO Products
A key driver propelling the GMO testing market is the increasing consumer demand for non-GMO products. With rising awareness about health and sustainability issues, consumers are seeking transparency and clarity regarding the presence of GMOs in the food they consume. Many consumers prefer products labeled as non-GMO or GMO-free, perceiving them as safer and more natural options. As a result, food manufacturers, retailers, and certification bodies are increasingly investing in GMO testing to verify and certify the non-GMO status of their products. The growing demand for non-GMO products and the need to meet consumer expectations are driving the uptake of GMO testing solutions across the food industry.
Market Opportunity: Expansion of GMO Testing Services
An opportunity within the GMO testing market lies in the expansion of testing services to meet diverse industry needs. As GMO testing becomes a standard requirement for food labeling and certification, there is a growing need for specialized testing services tailored to different sectors of the food supply chain. This includes testing services for raw ingredients, processed foods, agricultural commodities, and animal feed. Additionally, there is a demand for testing solutions that can detect GMO traits in a wide range of matrices with high accuracy and sensitivity. By expanding their service offerings to address these diverse needs, GMO testing companies can capitalize on the growing market demand and establish themselves as trusted partners for ensuring GMO transparency and compliance throughout the food industry.
GMO Testing Market Share Analysis: Herbicide Tolerance held the dominant market share in 2024
In the GMO Testing Market, the Herbicide Tolerance segment is the largest due to the widespread adoption of genetically modified organisms (GMOs) engineered for herbicide resistance in agriculture. Herbicide-tolerant GMO crops, such as soybeans, corn, and cotton, are designed to withstand the application of specific herbicides, allowing for effective weed control and enhanced crop yields. The significant adoption of herbicide-tolerant GMO crops by farmers worldwide, driven by the benefits of increased productivity, reduced labor costs, and simplified weed management practices, drives the demand for GMO testing services to ensure compliance with regulatory requirements and consumer preferences for GMO labeling. Additionally, the continuous development and commercialization of new herbicide-tolerant GMO traits by biotechnology companies further contribute to the dominance of the Herbicide Tolerance segment in the GMO Testing Market. Further, the increasing adoption of sustainable agricultural practices and the need for transparent labeling and traceability throughout the food supply chain underscore the importance of GMO testing for herbicide tolerance traits. Overall, the Herbicide Tolerance segment's pivotal role in modern agriculture and food production, coupled with the widespread adoption of herbicide-tolerant GMO crops, solidifies its position as the largest segment in the GMO Testing Market.
GMO Testing Market Share Analysis: Polymerase Chain Reaction (PCR) market is poised to register the fastest growth rae over the forecast period to 2032
In the GMO Testing Market, the Polymerase Chain Reaction (PCR) segment is the fastest-growing segment due to its high sensitivity, specificity, and versatility in detecting genetically modified organisms (GMOs) across various food and agricultural products. PCR technology allows for the amplification and detection of specific DNA sequences associated with GMO traits, enabling rapid and accurate identification of GMO content in samples. The increasing demand for PCR-based GMO testing is driven by several factors, including stringent regulatory requirements for GMO labeling and traceability, growing consumer awareness and concerns regarding GMOs in food products, and the expanding adoption of GMO crops globally. Further, advancements in PCR technology, such as real-time PCR and multiplex PCR assays, enhance the efficiency and throughput of GMO testing, further fueling the adoption of PCR-based testing methods. Additionally, the ability of PCR technology to detect GMO traits at low levels in complex matrices, such as processed foods and animal feed, makes it indispensable for ensuring compliance with regulatory standards and maintaining transparency in the food supply chain. Overall, the PCR segment's robust performance, technological advancements, and alignment with regulatory and consumer demands position it as the fastest-growing segment in the GMO Testing Market.
GMO Testing Market Share Analysis: Corn held the dominant market share in 2024
In the GMO Testing Market, the Corn segment is the largest due to the extensive cultivation and widespread adoption of genetically modified (GM) corn varieties globally. GM corn, engineered for traits such as insect resistance, herbicide tolerance, and enhanced nutritional profiles, represents a significant portion of the global corn crop. The widespread adoption of GM corn by farmers is driven by its numerous benefits, including increased yield potential, reduced pesticide use, and improved resistance to pests and diseases. Additionally, GM corn serves as a staple ingredient in various food and feed products, further driving its demand and necessitating thorough GMO testing to ensure compliance with regulatory requirements and consumer preferences. Further, the continuous development and commercialization of new GM corn varieties with enhanced traits by biotechnology companies contribute to the dominance of the Corn segment in the GMO Testing Market. Furthermore, the increasing demand for transparency and traceability in the food supply chain, coupled with regulatory mandates for GMO labeling, underscores the importance of GMO testing for corn-based products. Overall, the Corn segment's significant presence in agricultural production, coupled with the extensive adoption of GM varieties, solidifies its position as the largest segment in the GMO Testing Market.
GMO Testing Market Segmentation
By Trait
Stacked
Herbicide Tolerance
Insect Resistance
By Technology
Polymerase Chain Reaction (PCR)
Immunoassay
By Crop
Corn
Soy
Rapeseed/Canola
Potato
Others
By Processed Food
Bakery & Confectionery
Meat & Meat Products
Breakfast Cereals & Snacks
Food Additives
Others
Countries Analyzed
North America (US, Canada, Mexico)
Europe (Germany, UK, France, Spain, Italy, Russia, Rest of Europe)
Asia Pacific (China, India, Japan, South Korea, Australia, South East Asia, Rest of Asia)
South America (Brazil, Argentina, Rest of South America)
Middle East and Africa (Saudi Arabia, UAE, Rest of Middle East, South Africa, Egypt, Rest of Africa)
GMO Testing Companies Profiled in the Study
ALS Ltd
Bio-Rad Laboratories Inc
EnviroLogix Inc
Eurofins Scientific SE
Institut Merieux
Intertek Group plc
Koninklijke DSM N.V.
LGC Group
Microbac Laboratories Inc
OMIC USA Inc
Premier Foods plc
R-Biopharm AG
SGS SA
Thermo Fisher Scientific Inc
TUV SUD AG
*- List Not Exhaustive
Chapter 1. TABLE OF CONTENTS
Chapter 2. Introduction to GMO Testing Market
2.1. Market Overview
2.2. Key Statistics and Report Highlights
2.3. Scope of the Comprehensive Study
2.3.1. Market Definition
2.3.2 Countries and Regions Covered
2.3.3 Research Objective
2.3.4 Units, Currency, and Conversions
2.3.5 Industry Value Chain
2.4. Key Market Segments
2.5. Key Companies
2.6. Study Period
Chapter 3. Strategic Analysis Review
3.1. GMO Testing Pricing Analysis and Forecast
3.2. Porter’s Five Forces
3.3. Market Ecosystem
3.4. SWOT Analysis
3.5. Regulatory Scenario
3.3. Effects of Inflation, Russia-Ukraine War, moderating economic growth, and other macroeconomic factors
Chapter 4. Competitive Landscape
4.1. Market Share Analysis
4.1.1. Global GMO Testing Market Share by Company, 2023
4.1.2. Product Offerings of Leading GMO Testing Companies
4.2. Market Entropy
4.2.1. New Product Launches in the Industry
4.2.2. Mergers, Acquisitions, Joint ventures, and Partnerships
4.3. Key Strategies and Best Practices
Chapter 5. Global Market Projections: Best, Reference, and Low Case Scenarios
5.1. Growth Analysis- Case Scenario Definitions
5.2. Low Growth Case Scenario Forecasts
5.3. Reference Growth Case Scenario Forecasts
5.4. High Growth Case Scenario Forecasts
Chapter 6. Market Dynamics
6.1. GMO Testing Market Drivers
6.2. GMO Testing Market Challenges
6.6. GMO Testing Market Opportunities
6.4. GMO Testing Market Trends
Chapter 7. Global GMO Testing Market Outlook Trends
7.1. Global GMO Testing Revenue (USD Million) and CAGR (%) by Type (2021-2032)
7.2. Global GMO Testing Revenue (USD Million) and CAGR (%) by Application (2021-2032)
7.3. Global GMO Testing Revenue (USD Million) and CAGR (%) by Product (2021-2032)
By Trait
Stacked
Herbicide Tolerance
Insect Resistance
By Technology
Polymerase Chain Reaction (PCR)
Immunoassay
By Crop
Corn
Soy
Rapeseed/Canola
Potato
Others
By Processed Food
Bakery & Confectionery
Meat & Meat Products
Breakfast Cereals & Snacks
Food Additives
Others
Chapter 8. Global GMO Testing Regional Analysis and Outlook
8.1. Global GMO Testing Revenue (USD Million) By Regions (2021- 2032)
8.2. North America GMO Testing Revenue (USD Million) by Country (2021-2032)
8.2.1. United States GMO Testing Regional Analysis and Outlook
8.2.2. Canada GMO Testing Regional Analysis and Outlook
8.2.3. Mexico GMO Testing Regional Analysis and Outlook
8.3. Europe GMO Testing Revenue (USD Million), by Country (2021-2032)
8.3.1. Germany GMO Testing Regional Analysis and Outlook
8.3.2. France GMO Testing Regional Analysis and Outlook
8.3.3. United Kingdom GMO Testing Regional Analysis and Outlook
8.3.4. Spain GMO Testing Regional Analysis and Outlook
8.3.5. Italy GMO Testing Regional Analysis and Outlook
8.3.6. Russia GMO Testing Regional Analysis and Outlook
8.3.7. Rest of Europe GMO Testing Regional Analysis and Outlook
8.4. Asia Pacific GMO Testing Revenue (USD Million) by Country (2021-2032)
8.4.1. China GMO Testing Regional Analysis and Outlook
8.4.2. Japan GMO Testing Regional Analysis and Outlook
8.4.3. India GMO Testing Regional Analysis and Outlook
8.4.4. South Korea GMO Testing Regional Analysis and Outlook
8.4.5. Australia GMO Testing Regional Analysis and Outlook
8.4.6. South East Asia GMO Testing Regional Analysis and Outlook
8.4.7. Rest of Asia Pacific GMO Testing Regional Analysis and Outlook
8.5. South America GMO Testing Revenue (USD Million), by Country (2021-2032)
8.5.1. Brazil GMO Testing Regional Analysis and Outlook
8.5.2. Argentina GMO Testing Regional Analysis and Outlook
8.5.3. Rest of South America GMO Testing Regional Analysis and Outlook
8.6. Middle East and Africa GMO Testing Revenue (USD Million) by Country (2021-2032)
8.6.1. Middle East GMO Testing Regional Analysis and Outlook
8.6.2. Africa GMO Testing Regional Analysis and Outlook
Chapter 9. North America GMO Testing Analysis and Outlook
9.1. North America GMO Testing Revenue (USD Million) by Segments (2021-2032)
9.1.1. North America GMO Testing Revenue (USD Million) by Type (2021-2032)
9.1.2. North America GMO Testing Revenue (USD Million) by Application (2021-2032)
9.1.3. North America GMO Testing Revenue (USD Million) by Product (2021-2032)
By Trait
Stacked
Herbicide Tolerance
Insect Resistance
By Technology
Polymerase Chain Reaction (PCR)
Immunoassay
By Crop
Corn
Soy
Rapeseed/Canola
Potato
Others
By Processed Food
Bakery & Confectionery
Meat & Meat Products
Breakfast Cereals & Snacks
Food Additives
Others
Chapter 10. Europe GMO Testing Analysis and Outlook
10.1. Europe GMO Testing Revenue (USD Million), by Segments (USD Million) (2021-2032)
10.1.1. Europe GMO Testing Revenue (USD Million) by Type (2021-2032)
10.1.2. Europe GMO Testing Revenue (USD Million) by Application (2021-2032)
10.1.3. Europe GMO Testing Revenue (USD Million) by Product (2021-2032)
By Trait
Stacked
Herbicide Tolerance
Insect Resistance
By Technology
Polymerase Chain Reaction (PCR)
Immunoassay
By Crop
Corn
Soy
Rapeseed/Canola
Potato
Others
By Processed Food
Bakery & Confectionery
Meat & Meat Products
Breakfast Cereals & Snacks
Food Additives
Others
Chapter 11. Asia Pacific GMO Testing Analysis and Outlook
11.1. Asia Pacific GMO Testing Revenue (USD Million), and Revenue (USD Million) by Segments (2021-2032)
11.1.1. Asia Pacific GMO Testing Revenue (USD Million) by Type (2021-2032)
11.1.2. Asia Pacific GMO Testing Revenue (USD Million) by Application (2021-2032)
11.1.3. Asia Pacific GMO Testing Revenue (USD Million) by Product (2021-2032)
By Trait
Stacked
Herbicide Tolerance
Insect Resistance
By Technology
Polymerase Chain Reaction (PCR)
Immunoassay
By Crop
Corn
Soy
Rapeseed/Canola
Potato
Others
By Processed Food
Bakery & Confectionery
Meat & Meat Products
Breakfast Cereals & Snacks
Food Additives
Others
Chapter 12. South America GMO Testing Analysis and Outlook
12.1. South America GMO Testing Revenue (USD Million), by Segments (2021-2032)
12.1.1. South America GMO Testing Revenue (USD Million) by Type (2021-2032)
12.1.2. South America GMO Testing Revenue (USD Million) by Application (2021-2032)
12.1.3. South America GMO Testing Revenue (USD Million) by Product (2021-2032)
By Trait
Stacked
Herbicide Tolerance
Insect Resistance
By Technology
Polymerase Chain Reaction (PCR)
Immunoassay
By Crop
Corn
Soy
Rapeseed/Canola
Potato
Others
By Processed Food
Bakery & Confectionery
Meat & Meat Products
Breakfast Cereals & Snacks
Food Additives
Others
Chapter 13. Middle East and Africa GMO Testing Analysis and Outlook
13.1. Middle East and Africa GMO Testing Revenue (USD Million), by Segments (2021-2032)
13.1.1. Middle East and Africa GMO Testing Revenue (USD Million) by Type (2021-2032)
13.1.2. Middle East and Africa GMO Testing Revenue (USD Million) by Application (2021-2032)
13.1.3. Middle East and Africa GMO Testing Revenue (USD Million) by Product (2021-2032)
By Trait
Stacked
Herbicide Tolerance
Insect Resistance
By Technology
Polymerase Chain Reaction (PCR)
Immunoassay
By Crop
Corn
Soy
Rapeseed/Canola
Potato
Others
By Processed Food
Bakery & Confectionery
Meat & Meat Products
Breakfast Cereals & Snacks
Food Additives
Others
Chapter 14. GMO Testing Company Profiles
14.1 Business Overview
14.2 Product Profiles
14.3 SWOT Profiles
14.5 Recent Developments
14.6 Financial Profile
List of Companies
ALS Ltd
Bio-Rad Laboratories Inc
EnviroLogix Inc
Eurofins Scientific SE
Institut Merieux
Intertek Group plc
Koninklijke DSM N.V.
LGC Group
Microbac Laboratories Inc
OMIC USA Inc
Premier Foods plc
R-Biopharm AG
SGS SA
Thermo Fisher Scientific Inc
TUV SUD AG
15. Methodology and Data Sources
15.1 Customization Offerings
15.2 Subscription Services
15.3 Related Reports
15.4 Publisher Expertise
LIST OF TABLES
Table 1 Market Segmentation Analysis
Table 2 Global GMO Testing Market Share of Leading Companies, 2023
Table 3 Product Offerings of Leading Companies
Table 4 Low Growth Scenario Forecasts
Table 5 Reference Case Growth Scenario
Table 6 High Growth Case Scenario
Table 7 Global GMO Testing Revenue (USD Million) And CAGR (%) By Type (2021-2032)
Table 8 Global GMO Testing Revenue (USD Million) And CAGR (%) By Application (2021-2032)
Table 9 Global GMO Testing Revenue (USD Million) And CAGR (%) By Product (2021-2032)
Table 10 Global GMO Testing Market Revenue (USD Million) By Regions (2021-2032)
Table 11 Global GMO Testing Market Share (%) By Regions (2021-2032)
Table 12 North America GMO Testing Revenue (USD Million) By Country (2021-2032)
Table 13 Europe GMO Testing Revenue (USD Million) By Country (2021-2032)
Table 14 Asia Pacific GMO Testing Revenue (USD Million) By Country (2021-2032)
Table 15 South America GMO Testing Revenue (USD Million) By Country (2021-2032)
Table 16 Middle East and Africa GMO Testing Revenue (USD Million) By Region (2021-2032)
Table 17 North America GMO Testing Revenue (USD Million) By Type (2021-2032)
Table 18 North America GMO Testing Revenue (USD Million) By Application (2021-2032)
Table 19 North America GMO Testing Revenue (USD Million) By Product (2021-2032)
Table 20 Europe GMO Testing Revenue (USD Million) By Type (2021-2032)
Table 21 Europe GMO Testing Revenue (USD Million) By Application (2021-2032)
Table 22 Europe GMO Testing Revenue (USD Million) By Product (2021-2032)
Table 23 Asia Pacific GMO Testing Revenue (USD Million) By Type (2021-2032)
Table 24 Asia Pacific GMO Testing Revenue (USD Million) By Application (2021-2032)
Table 25 Asia Pacific GMO Testing Revenue (USD Million) By Product (2021-2032)
Table 26 South America GMO Testing Revenue (USD Million) By Type (2021-2032)
Table 27 South America GMO Testing Revenue (USD Million) By Application (2021-2032)
Table 28 South America GMO Testing Revenue (USD Million) By Product (2021-2032)
Table 29 Middle East and Africa GMO Testing Revenue (USD Million) By Type (2021-2032)
Table 30 Middle East and Africa GMO Testing Revenue (USD Million) By Application (2021-2032)
Table 31 Middle East and Africa GMO Testing Revenue (USD Million) By Product (2021-2032)
LIST OF FIGURES
Figure 1. Market Scope
Figure 2. Pricing Forecasts Per Unit, 2023- 2032
Figure 3. Porter’s Five Forces
Figure 4. Global GMO Testing Market Revenue (USD Million) By Regions (2021-2032)
Figure 5. Global GMO Testing Market Share (%) By Regions (2023)
Figure 6. North America GMO Testing Revenue (USD Million) By Country (2021-2032)
Figure 7. United States GMO Testing Revenue (USD Million) By Country (2021-2032)
Figure 8. Canada GMO Testing Revenue (USD Million) By Country (2021-2032)
Figure 9. Mexico GMO Testing Revenue (USD Million) By Country (2021-2032)
Figure 10. Europe GMO Testing Revenue (USD Million) By Country (2021-2032)
Figure 11. Germany GMO Testing Revenue (USD Million) By Country (2021-2032)
Figure 12. France GMO Testing Revenue (USD Million) By Country (2021-2032)
Figure 13. United Kingdom GMO Testing Revenue (USD Million) By Country (2021-2032)
Figure 14. Spain GMO Testing Revenue (USD Million) By Country (2021-2032)
Figure 15. Italy GMO Testing Revenue (USD Million) By Country (2021-2032)
Figure 16. Russia GMO Testing Revenue (USD Million) By Country (2021-2032)
Figure 17. Rest of Europe GMO Testing Revenue (USD Million) By Country (2021-2032)
Figure 11. Asia Pacific GMO Testing Revenue (USD Million) By Country (2021-2032)
Figure 12. China GMO Testing Revenue (USD Million) By Country (2021-2032)
Figure 13. Japan GMO Testing Revenue (USD Million) By Country (2021-2032)
Figure 14. India GMO Testing Revenue (USD Million) By Country (2021-2032)
Figure 15. South Korea GMO Testing Revenue (USD Million) By Country (2021-2032)
Figure 16. Australia GMO Testing Revenue (USD Million) By Country (2021-2032)
Figure 17. South East Asia GMO Testing Revenue (USD Million) By Country (2021-2032)
Figure 18. South America GMO Testing Revenue (USD Million) By Country (2021-2032)
Figure 19. Brazil GMO Testing Revenue (USD Million) By Country (2021-2032)
Figure 20. Argentina GMO Testing Revenue (USD Million) By Country (2021-2032)
Figure 21. Rest of Asia Pacific GMO Testing Revenue (USD Million) By Country (2021-2032)
Figure 22. Middle East and Africa GMO Testing Revenue (USD Million) By Region (2021-2032)
Figure 23. Saudi Arabia GMO Testing Revenue (USD Million) By Region (2021-2032)
Figure 24. The UAE GMO Testing Revenue (USD Million) By Region (2021-2032)
Figure 25. Rest of Middle East GMO Testing Revenue (USD Million) By Region (2021-2032)
Figure 26. South Africa GMO Testing Revenue (USD Million) By Region (2021-2032)
Figure 27. Africa GMO Testing Revenue (USD Million) By Region (2021-2032)
Figure 28. North America GMO Testing Revenue (USD Million) By Type (2021-2032)
Figure 29. North America GMO Testing Revenue (USD Million) By Application (2021-2032)
Figure 30. North America GMO Testing Revenue (USD Million) By Product (2021-2032)
Figure 31. Europe GMO Testing Revenue (USD Million) By Type (2021-2032)
Figure 32. Europe GMO Testing Revenue (USD Million) By Application (2021-2032)
Figure 33. Europe GMO Testing Revenue (USD Million) By Product (2021-2032)
Figure 34. Asia Pacific GMO Testing Revenue (USD Million) By Type (2021-2032)
Figure 35. Asia Pacific GMO Testing Revenue (USD Million) By Application (2021-2032)
Figure 36. Asia Pacific GMO Testing Revenue (USD Million) By Product (2021-2032)
Figure 37. South America GMO Testing Revenue (USD Million) By Type (2021-2032)
Figure 38. South America GMO Testing Revenue (USD Million) By Application (2021-2032)
Figure 39. South America GMO Testing Revenue (USD Million) By Product (2021-2032)
Figure 40. Middle East and Africa GMO Testing Revenue (USD Million) By Type (2021-2032)
Figure 41. Middle East and Africa GMO Testing Revenue (USD Million) By Application (2021-2032)
Figure 42. Middle East and Africa GMO Testing Revenue (USD Million) By Product (2021-2032)
By Trait
Stacked
Herbicide Tolerance
Insect Resistance
By Technology
Polymerase Chain Reaction (PCR)
Immunoassay
By Crop
Corn
Soy
Rapeseed/Canola
Potato
Others
By Processed Food
Bakery & Confectionery
Meat & Meat Products
Breakfast Cereals & Snacks
Food Additives
Others
Countries Analyzed
North America (US, Canada, Mexico)
Europe (Germany, UK, France, Spain, Italy, Russia, Rest of Europe)
Asia Pacific (China, India, Japan, South Korea, Australia, South East Asia, Rest of Asia)
South America (Brazil, Argentina, Rest of South America)
Middle East and Africa (Saudi Arabia, UAE, Rest of Middle East, South Africa, Egypt, Rest of Africa)
