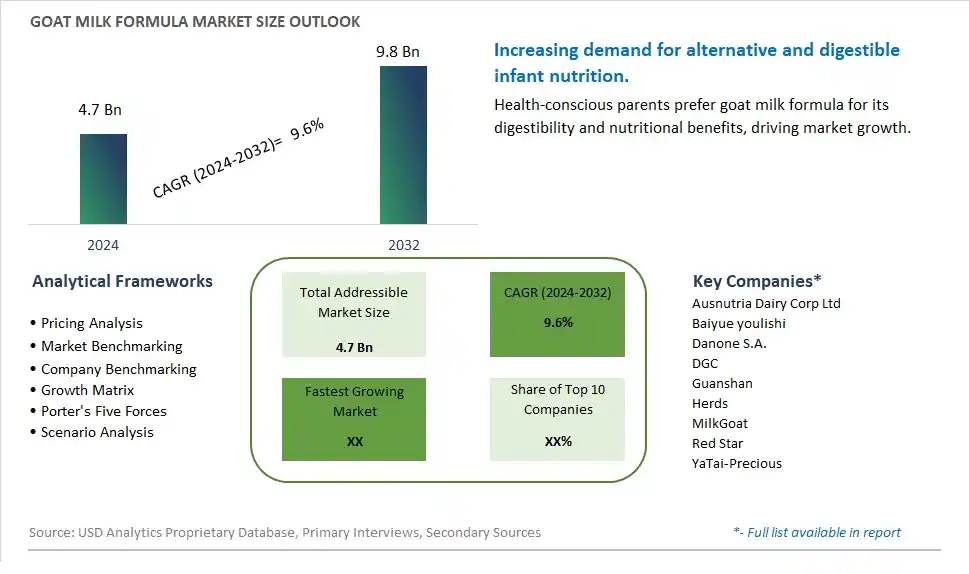
Global Goat Milk Formula Market Size is valued at $4.7 Billion in 2024 and is forecast to register a growth rate (CAGR) of 9.6% to reach $9.8 Billion by 2032.
The global Goat Milk Formula Market Comprehensive Study analyzes and forecasts the market size across 6 regions and 24 countries for diverse segments -By Type (0 to 6 months, 6 to 12 months, 12 to 24 months), By Distribution Channel (Supermarkets/Hypermarkets, Connivance stores, Specialty stores, pharmacy stores, Others), By Packaging (Bottle packaging, Tetra packaging)
An Introduction to Goat Milk Formula Market
The Goat Milk Formula market in 2024 is witnessing robust growth, driven by the rising demand for alternative and easily digestible infant formulas. Goat milk formula, known for its closer similarity to human milk and lower allergenic potential, is popular among parents seeking gentle nutrition for their infants. The market benefits from advancements in formula production and nutrient fortification technologies, the growing trend of natural and organic baby products, and the expansion of the global infant nutrition sector. Additionally, the increasing awareness of the benefits of goat milk for infant digestive health is contributing to market growth.
Goat Milk Formula Competitive Landscape
The market report analyses the leading companies in the industry including Ausnutria Dairy Corp Ltd, Baiyue youlishi, Danone S.A., DGC, Guanshan, Herds, MilkGoat, Red Star, YaTai-Precious, and Others.
Goat Milk Formula Market Dynamics
Goat Milk Formula Market Trend: Rising Popularity of Goat Milk-Based Infant Formulas
The most prominent trend in the Goat Milk Formula Market is the rising popularity of goat milk-based infant formulas. As consumers seek alternatives to cow milk formulas due to allergies, intolerances, or personal preferences, goat milk formulas are gaining traction for their easier digestibility and nutritional benefits. This trend is driven by the growing demand for specialized infant nutrition products that cater to specific dietary needs.
Goat Milk Formula Market Driver: Increase in Awareness of Goat Milk Benefits
The key driver of the Goat Milk Formula Market is the increase in awareness of the benefits of goat milk. As more parents become knowledgeable about the advantages of goat milk for infant health, including its higher digestibility and nutrient content, there is a higher demand for goat milk formulas. This driver is supported by the trend towards natural and alternative dairy products, driving market growth for goat milk-based infant formulas.
Goat Milk Formula Market Opportunity: Development of Specialized and Fortified Formulas
A significant opportunity in the Goat Milk Formula Market lies in the development of specialized and fortified formulas. By creating products that cater to specific health needs, such as hypoallergenic, organic, or fortified with additional nutrients, companies can attract a broader audience. Offering innovative goat milk formulas that provide comprehensive nutrition for infants can help expand market reach and drive growth in the specialized infant nutrition sector.
Goat Milk Formula Market Share Analysis: 0 to 6 Months segment generated the highest revenue share in the industry
In the Goat Milk Formula Market, the largest segment by type is formula intended for infants aged 0 to 6 months. This segment caters to newborns and infants who rely on specially formulated milk to meet their nutritional needs during the early stages of development. Goat milk formula designed for this age group is carefully balanced to mimic the composition of breast milk, providing essential nutrients such as proteins, fats, vitamins, and minerals necessary for healthy growth and development. The demand for formula in this segment is driven by parental preference for goat milk-based alternatives due to perceived health benefits and nutritional qualities compared to traditional cow milk formulas. Additionally, rising awareness of lactose intolerance and cow milk protein allergies among infants further boosts the adoption of goat milk formula in this age category.
Goat Milk Formula Market Share Analysis: Online Retail is the fastest growing segment over the forecast period to 2032
Among the distribution channels in the Goat Milk Formula Market, the fastest-growing segment to 2032 is online retail. This channel includes e-commerce platforms where consumers can purchase goat milk formula conveniently from the comfort of their homes. The rapid growth of online retail is propelled by increasing internet penetration, smartphone usage, and the convenience of doorstep delivery. Consumers, particularly parents seeking specific nutritional products like goat milk formula, are increasingly turning to online channels for their shopping needs due to wider product availability, competitive pricing, and ease of comparison. Furthermore, the Past few yearshas accelerated the shift towards online shopping, influencing consumer behavior towards more digital and contactless purchasing experiences. As a result, online retail is expected to continue expanding robustly in the goat milk formula market, offering manufacturers and retailers new avenues for growth and market penetration.
Goat Milk Formula Market Share Analysis: Tetra Packaging segment generated the highest revenue share in the industry
In the Goat Milk Formula Market, the largest segment by packaging type is tetra packaging. Tetra packaging refers to cartons or containers made from multiple layers of materials that ensure product freshness, safety, and convenience. This packaging format is popular for goat milk formula due to its ability to protect the contents from light, moisture, and air, preserving the nutritional integrity of the formula. Tetra packaging offers benefits such as easy storage, pouring, and resealing, making it convenient for parents to handle and use. The preference for tetra packaging is also driven by its eco-friendly properties, as many cartons are recyclable and contribute to reducing environmental impact compared to other packaging materials. The widespread adoption of tetra packaging in the goat milk formula market underscores its importance in meeting consumer expectations for quality, sustainability, and practicality.
Goat Milk Formula Market Segmentation
By Type
0 to 6 months
6 to 12 months
12 to 24 months
By Distribution Channel
Supermarkets/Hypermarkets
Connivance stores
Specialty stores
pharmacy stores
Others
By Packaging
Bottle packaging
Tetra packaging
Countries Analyzed
North America (US, Canada, Mexico)
Europe (Germany, UK, France, Spain, Italy, Russia, Rest of Europe)
Asia Pacific (China, India, Japan, South Korea, Australia, South East Asia, Rest of Asia)
South America (Brazil, Argentina, Rest of South America)
Middle East and Africa (Saudi Arabia, UAE, Rest of Middle East, South Africa, Egypt, Rest of Africa)
Goat Milk Formula Companies Profiled in the Study
Ausnutria Dairy Corp Ltd
Baiyue youlishi
Danone S.A.
DGC
Guanshan
Herds
MilkGoat
Red Star
YaTai-Precious
*- List Not Exhaustive
Chapter 1. TABLE OF CONTENTS
Chapter 2. Introduction to Goat Milk Formula Market
2.1. Market Overview
2.2. Key Statistics and Report Highlights
2.3. Scope of the Comprehensive Study
2.3.1. Market Definition
2.3.2 Countries and Regions Covered
2.3.3 Research Objective
2.3.4 Units, Currency, and Conversions
2.3.5 Industry Value Chain
2.4. Key Market Segments
2.5. Key Companies
2.6. Study Period
Chapter 3. Strategic Analysis Review
3.1. Goat Milk Formula Pricing Analysis and Forecast
3.2. Porter’s Five Forces
3.3. Market Ecosystem
3.4. SWOT Analysis
3.5. Regulatory Scenario
3.3. Effects of Inflation, Russia-Ukraine War, moderating economic growth, and other macroeconomic factors
Chapter 4. Competitive Landscape
4.1. Market Share Analysis
4.1.1. Global Goat Milk Formula Market Share by Company, 2023
4.1.2. Product Offerings of Leading Goat Milk Formula Companies
4.2. Market Entropy
4.2.1. New Product Launches in the Industry
4.2.2. Mergers, Acquisitions, Joint ventures, and Partnerships
4.3. Key Strategies and Best Practices
Chapter 5. Global Market Projections: Best, Reference, and Low Case Scenarios
5.1. Growth Analysis- Case Scenario Definitions
5.2. Low Growth Case Scenario Forecasts
5.3. Reference Growth Case Scenario Forecasts
5.4. High Growth Case Scenario Forecasts
Chapter 6. Market Dynamics
6.1. Goat Milk Formula Market Drivers
6.2. Goat Milk Formula Market Challenges
6.6. Goat Milk Formula Market Opportunities
6.4. Goat Milk Formula Market Trends
Chapter 7. Global Goat Milk Formula Market Outlook Trends
7.1. Global Goat Milk Formula Revenue (USD Million) and CAGR (%) by Type (2021-2032)
7.2. Global Goat Milk Formula Revenue (USD Million) and CAGR (%) by Application (2021-2032)
7.3. Global Goat Milk Formula Revenue (USD Million) and CAGR (%) by Product (2021-2032)
By Type
0 to 6 months
6 to 12 months
12 to 24 months
By Distribution Channel
Supermarkets/Hypermarkets
Connivance stores
Specialty stores
pharmacy stores
Others
By Packaging
Bottle packaging
Tetra packaging
Chapter 8. Global Goat Milk Formula Regional Analysis and Outlook
8.1. Global Goat Milk Formula Revenue (USD Million) By Regions (2021- 2032)
8.2. North America Goat Milk Formula Revenue (USD Million) by Country (2021-2032)
8.2.1. United States Goat Milk Formula Regional Analysis and Outlook
8.2.2. Canada Goat Milk Formula Regional Analysis and Outlook
8.2.3. Mexico Goat Milk Formula Regional Analysis and Outlook
8.3. Europe Goat Milk Formula Revenue (USD Million), by Country (2021-2032)
8.3.1. Germany Goat Milk Formula Regional Analysis and Outlook
8.3.2. France Goat Milk Formula Regional Analysis and Outlook
8.3.3. United Kingdom Goat Milk Formula Regional Analysis and Outlook
8.3.4. Spain Goat Milk Formula Regional Analysis and Outlook
8.3.5. Italy Goat Milk Formula Regional Analysis and Outlook
8.3.6. Russia Goat Milk Formula Regional Analysis and Outlook
8.3.7. Rest of Europe Goat Milk Formula Regional Analysis and Outlook
8.4. Asia Pacific Goat Milk Formula Revenue (USD Million) by Country (2021-2032)
8.4.1. China Goat Milk Formula Regional Analysis and Outlook
8.4.2. Japan Goat Milk Formula Regional Analysis and Outlook
8.4.3. India Goat Milk Formula Regional Analysis and Outlook
8.4.4. South Korea Goat Milk Formula Regional Analysis and Outlook
8.4.5. Australia Goat Milk Formula Regional Analysis and Outlook
8.4.6. South East Asia Goat Milk Formula Regional Analysis and Outlook
8.4.7. Rest of Asia Pacific Goat Milk Formula Regional Analysis and Outlook
8.5. South America Goat Milk Formula Revenue (USD Million), by Country (2021-2032)
8.5.1. Brazil Goat Milk Formula Regional Analysis and Outlook
8.5.2. Argentina Goat Milk Formula Regional Analysis and Outlook
8.5.3. Rest of South America Goat Milk Formula Regional Analysis and Outlook
8.6. Middle East and Africa Goat Milk Formula Revenue (USD Million) by Country (2021-2032)
8.6.1. Middle East Goat Milk Formula Regional Analysis and Outlook
8.6.2. Africa Goat Milk Formula Regional Analysis and Outlook
Chapter 9. North America Goat Milk Formula Analysis and Outlook
9.1. North America Goat Milk Formula Revenue (USD Million) by Segments (2021-2032)
9.1.1. North America Goat Milk Formula Revenue (USD Million) by Type (2021-2032)
9.1.2. North America Goat Milk Formula Revenue (USD Million) by Application (2021-2032)
9.1.3. North America Goat Milk Formula Revenue (USD Million) by Product (2021-2032)
By Type
0 to 6 months
6 to 12 months
12 to 24 months
By Distribution Channel
Supermarkets/Hypermarkets
Connivance stores
Specialty stores
pharmacy stores
Others
By Packaging
Bottle packaging
Tetra packaging
Chapter 10. Europe Goat Milk Formula Analysis and Outlook
10.1. Europe Goat Milk Formula Revenue (USD Million), by Segments (USD Million) (2021-2032)
10.1.1. Europe Goat Milk Formula Revenue (USD Million) by Type (2021-2032)
10.1.2. Europe Goat Milk Formula Revenue (USD Million) by Application (2021-2032)
10.1.3. Europe Goat Milk Formula Revenue (USD Million) by Product (2021-2032)
By Type
0 to 6 months
6 to 12 months
12 to 24 months
By Distribution Channel
Supermarkets/Hypermarkets
Connivance stores
Specialty stores
pharmacy stores
Others
By Packaging
Bottle packaging
Tetra packaging
Chapter 11. Asia Pacific Goat Milk Formula Analysis and Outlook
11.1. Asia Pacific Goat Milk Formula Revenue (USD Million), and Revenue (USD Million) by Segments (2021-2032)
11.1.1. Asia Pacific Goat Milk Formula Revenue (USD Million) by Type (2021-2032)
11.1.2. Asia Pacific Goat Milk Formula Revenue (USD Million) by Application (2021-2032)
11.1.3. Asia Pacific Goat Milk Formula Revenue (USD Million) by Product (2021-2032)
By Type
0 to 6 months
6 to 12 months
12 to 24 months
By Distribution Channel
Supermarkets/Hypermarkets
Connivance stores
Specialty stores
pharmacy stores
Others
By Packaging
Bottle packaging
Tetra packaging
Chapter 12. South America Goat Milk Formula Analysis and Outlook
12.1. South America Goat Milk Formula Revenue (USD Million), by Segments (2021-2032)
12.1.1. South America Goat Milk Formula Revenue (USD Million) by Type (2021-2032)
12.1.2. South America Goat Milk Formula Revenue (USD Million) by Application (2021-2032)
12.1.3. South America Goat Milk Formula Revenue (USD Million) by Product (2021-2032)
By Type
0 to 6 months
6 to 12 months
12 to 24 months
By Distribution Channel
Supermarkets/Hypermarkets
Connivance stores
Specialty stores
pharmacy stores
Others
By Packaging
Bottle packaging
Tetra packaging
Chapter 13. Middle East and Africa Goat Milk Formula Analysis and Outlook
13.1. Middle East and Africa Goat Milk Formula Revenue (USD Million), by Segments (2021-2032)
13.1.1. Middle East and Africa Goat Milk Formula Revenue (USD Million) by Type (2021-2032)
13.1.2. Middle East and Africa Goat Milk Formula Revenue (USD Million) by Application (2021-2032)
13.1.3. Middle East and Africa Goat Milk Formula Revenue (USD Million) by Product (2021-2032)
By Type
0 to 6 months
6 to 12 months
12 to 24 months
By Distribution Channel
Supermarkets/Hypermarkets
Connivance stores
Specialty stores
pharmacy stores
Others
By Packaging
Bottle packaging
Tetra packaging
Chapter 14. Goat Milk Formula Company Profiles
14.1 Business Overview
14.2 Product Profiles
14.3 SWOT Profiles
14.5 Recent Developments
14.6 Financial Profile
List of Companies
Ausnutria Dairy Corp Ltd
Baiyue youlishi
Danone S.A.
DGC
Guanshan
Herds
MilkGoat
Red Star
YaTai-Precious
15. Methodology and Data Sources
15.1 Customization Offerings
15.2 Subscription Services
15.3 Related Reports
15.4 Publisher Expertise
LIST OF TABLES
Table 1 Market Segmentation Analysis
Table 2 Global Goat Milk Formula Market Share of Leading Companies, 2023
Table 3 Product Offerings of Leading Companies
Table 4 Low Growth Scenario Forecasts
Table 5 Reference Case Growth Scenario
Table 6 High Growth Case Scenario
Table 7 Global Goat Milk Formula Revenue (USD Million) And CAGR (%) By Type (2021-2032)
Table 8 Global Goat Milk Formula Revenue (USD Million) And CAGR (%) By Application (2021-2032)
Table 9 Global Goat Milk Formula Revenue (USD Million) And CAGR (%) By Product (2021-2032)
Table 10 Global Goat Milk Formula Market Revenue (USD Million) By Regions (2021-2032)
Table 11 Global Goat Milk Formula Market Share (%) By Regions (2021-2032)
Table 12 North America Goat Milk Formula Revenue (USD Million) By Country (2021-2032)
Table 13 Europe Goat Milk Formula Revenue (USD Million) By Country (2021-2032)
Table 14 Asia Pacific Goat Milk Formula Revenue (USD Million) By Country (2021-2032)
Table 15 South America Goat Milk Formula Revenue (USD Million) By Country (2021-2032)
Table 16 Middle East and Africa Goat Milk Formula Revenue (USD Million) By Region (2021-2032)
Table 17 North America Goat Milk Formula Revenue (USD Million) By Type (2021-2032)
Table 18 North America Goat Milk Formula Revenue (USD Million) By Application (2021-2032)
Table 19 North America Goat Milk Formula Revenue (USD Million) By Product (2021-2032)
Table 20 Europe Goat Milk Formula Revenue (USD Million) By Type (2021-2032)
Table 21 Europe Goat Milk Formula Revenue (USD Million) By Application (2021-2032)
Table 22 Europe Goat Milk Formula Revenue (USD Million) By Product (2021-2032)
Table 23 Asia Pacific Goat Milk Formula Revenue (USD Million) By Type (2021-2032)
Table 24 Asia Pacific Goat Milk Formula Revenue (USD Million) By Application (2021-2032)
Table 25 Asia Pacific Goat Milk Formula Revenue (USD Million) By Product (2021-2032)
Table 26 South America Goat Milk Formula Revenue (USD Million) By Type (2021-2032)
Table 27 South America Goat Milk Formula Revenue (USD Million) By Application (2021-2032)
Table 28 South America Goat Milk Formula Revenue (USD Million) By Product (2021-2032)
Table 29 Middle East and Africa Goat Milk Formula Revenue (USD Million) By Type (2021-2032)
Table 30 Middle East and Africa Goat Milk Formula Revenue (USD Million) By Application (2021-2032)
Table 31 Middle East and Africa Goat Milk Formula Revenue (USD Million) By Product (2021-2032)
LIST OF FIGURES
Figure 1. Market Scope
Figure 2. Pricing Forecasts Per Unit, 2023- 2032
Figure 3. Porter’s Five Forces
Figure 4. Global Goat Milk Formula Market Revenue (USD Million) By Regions (2021-2032)
Figure 5. Global Goat Milk Formula Market Share (%) By Regions (2023)
Figure 6. North America Goat Milk Formula Revenue (USD Million) By Country (2021-2032)
Figure 7. United States Goat Milk Formula Revenue (USD Million) By Country (2021-2032)
Figure 8. Canada Goat Milk Formula Revenue (USD Million) By Country (2021-2032)
Figure 9. Mexico Goat Milk Formula Revenue (USD Million) By Country (2021-2032)
Figure 10. Europe Goat Milk Formula Revenue (USD Million) By Country (2021-2032)
Figure 11. Germany Goat Milk Formula Revenue (USD Million) By Country (2021-2032)
Figure 12. France Goat Milk Formula Revenue (USD Million) By Country (2021-2032)
Figure 13. United Kingdom Goat Milk Formula Revenue (USD Million) By Country (2021-2032)
Figure 14. Spain Goat Milk Formula Revenue (USD Million) By Country (2021-2032)
Figure 15. Italy Goat Milk Formula Revenue (USD Million) By Country (2021-2032)
Figure 16. Russia Goat Milk Formula Revenue (USD Million) By Country (2021-2032)
Figure 17. Rest of Europe Goat Milk Formula Revenue (USD Million) By Country (2021-2032)
Figure 11. Asia Pacific Goat Milk Formula Revenue (USD Million) By Country (2021-2032)
Figure 12. China Goat Milk Formula Revenue (USD Million) By Country (2021-2032)
Figure 13. Japan Goat Milk Formula Revenue (USD Million) By Country (2021-2032)
Figure 14. India Goat Milk Formula Revenue (USD Million) By Country (2021-2032)
Figure 15. South Korea Goat Milk Formula Revenue (USD Million) By Country (2021-2032)
Figure 16. Australia Goat Milk Formula Revenue (USD Million) By Country (2021-2032)
Figure 17. South East Asia Goat Milk Formula Revenue (USD Million) By Country (2021-2032)
Figure 18. South America Goat Milk Formula Revenue (USD Million) By Country (2021-2032)
Figure 19. Brazil Goat Milk Formula Revenue (USD Million) By Country (2021-2032)
Figure 20. Argentina Goat Milk Formula Revenue (USD Million) By Country (2021-2032)
Figure 21. Rest of Asia Pacific Goat Milk Formula Revenue (USD Million) By Country (2021-2032)
Figure 22. Middle East and Africa Goat Milk Formula Revenue (USD Million) By Region (2021-2032)
Figure 23. Saudi Arabia Goat Milk Formula Revenue (USD Million) By Region (2021-2032)
Figure 24. The UAE Goat Milk Formula Revenue (USD Million) By Region (2021-2032)
Figure 25. Rest of Middle East Goat Milk Formula Revenue (USD Million) By Region (2021-2032)
Figure 26. South Africa Goat Milk Formula Revenue (USD Million) By Region (2021-2032)
Figure 27. Africa Goat Milk Formula Revenue (USD Million) By Region (2021-2032)
Figure 28. North America Goat Milk Formula Revenue (USD Million) By Type (2021-2032)
Figure 29. North America Goat Milk Formula Revenue (USD Million) By Application (2021-2032)
Figure 30. North America Goat Milk Formula Revenue (USD Million) By Product (2021-2032)
Figure 31. Europe Goat Milk Formula Revenue (USD Million) By Type (2021-2032)
Figure 32. Europe Goat Milk Formula Revenue (USD Million) By Application (2021-2032)
Figure 33. Europe Goat Milk Formula Revenue (USD Million) By Product (2021-2032)
Figure 34. Asia Pacific Goat Milk Formula Revenue (USD Million) By Type (2021-2032)
Figure 35. Asia Pacific Goat Milk Formula Revenue (USD Million) By Application (2021-2032)
Figure 36. Asia Pacific Goat Milk Formula Revenue (USD Million) By Product (2021-2032)
Figure 37. South America Goat Milk Formula Revenue (USD Million) By Type (2021-2032)
Figure 38. South America Goat Milk Formula Revenue (USD Million) By Application (2021-2032)
Figure 39. South America Goat Milk Formula Revenue (USD Million) By Product (2021-2032)
Figure 40. Middle East and Africa Goat Milk Formula Revenue (USD Million) By Type (2021-2032)
Figure 41. Middle East and Africa Goat Milk Formula Revenue (USD Million) By Application (2021-2032)
Figure 42. Middle East and Africa Goat Milk Formula Revenue (USD Million) By Product (2021-2032)
By Type
0 to 6 months
6 to 12 months
12 to 24 months
By Distribution Channel
Supermarkets/Hypermarkets
Connivance stores
Specialty stores
pharmacy stores
Others
By Packaging
Bottle packaging
Tetra packaging
Countries Analyzed
North America (US, Canada, Mexico)
Europe (Germany, UK, France, Spain, Italy, Russia, Rest of Europe)
Asia Pacific (China, India, Japan, South Korea, Australia, South East Asia, Rest of Asia)
South America (Brazil, Argentina, Rest of South America)
Middle East and Africa (Saudi Arabia, UAE, Rest of Middle East, South Africa, Egypt, Rest of Africa)
