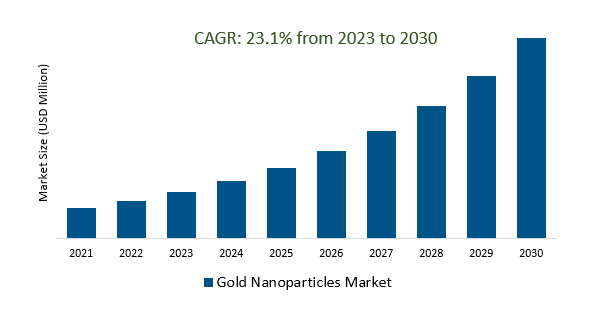
The Global Gold Nanoparticles Market Size is estimated to register 23.1% growth over the forecast period from 2023 to 2030.
The market growth is driven by increasing gold nanoparticles are being explored for their effectiveness in water treatment and purification processes. Their catalytic properties make them useful in breaking down pollutants and contaminants in water, contributing to environmental sustainability. Leading Companies focusing on Personalized Medicine and Targeted Therapy, Smart Nanomaterials for Responsive Drug Delivery, Green Synthesis and Sustainable Production, and others to boost market shares in the industry.
Market Overview
The Gold Nanoparticles Market is characterized by widespread applications, with significant contributions in medical fields for drug delivery and diagnostic imaging. They play a crucial role in electronics and catalysis, particularly in the development of conductive inks and catalysis processes in electronics manufacturing. Additionally, gold nanoparticles are explored for environmental remediation, such as water purification and air filtration. Ongoing research, development initiatives, and collaborations among academic institutions and industry players drive innovation. Despite their potential, challenges include concerns about toxicity and scalability of production methods. The future outlook involves personalized medicine, smart nanomaterials, and environmentally friendly synthesis methods to propel the market forward.
Market Dynamics
Market Trends- Gold nanoparticles are a promising new platform for targeted and controlled drug delivery.
Gold nanoparticles are a highly promising platform for drug delivery, allowing targeted and controlled release of therapeutic agents. Their unique physicochemical properties enhance bioavailability and biocompatibility, enabling efficient delivery of drugs with minimized side effects. Through surface functionalization, these nanoparticles can be tailored for specific targeting of diseased cells, contributing to the precision of drug delivery. Additionally, gold nanoparticles facilitate combination therapies, allowing for the integration of therapeutic agents, imaging contrast agents, and targeting ligands on a single platform. Beyond drug delivery, they play a role in theranostics by enabling in vivo imaging alongside therapeutic interventions, promising a comprehensive approach to medical treatments with improved precision and efficacy.
Market Driver- Advancements in nanotechnology are driving demand for gold nanoparticles.
Advancements in nanotechnology are fueling a growing demand for gold nanoparticles across various industries. The unique properties of gold nanoparticles make them indispensable in healthcare, particularly in targeted drug delivery and diagnostics, as nanotechnology enables more precise and efficient medical treatments. In the electronics sector, the miniaturization trend is driving demand for gold nanoparticles, incorporated into conductive inks for printed electronics and catalysis processes in manufacturing. The emphasis on sustainable practices aligns with green synthesis methods for gold nanoparticles, further contributing to their appeal.
Market Opportunity- Gold nanoparticles are attracting significant investment in research and development, which is driving innovation and new applications.
Research and development investments for gold nanoparticles are driving innovation and generating novel applications, with a notable emphasis in the medical sector. This financial support is fueling breakthroughs in targeted drug delivery, personalized medicine, and theranostics. Furthermore, the funds are playing a crucial role in advancing the integration of gold nanoparticles into flexible electronics and catalytic processes within the electronics industry. Additionally, research initiatives are extending their focus to environmental and energy applications, such as water purification and sustainable energy production.
Market Share Analysis- Targeted Drug Delivery Gold Nanoparticles Market will register the fastest growth
The Global Gold Nanoparticles Market is analyzed across Imaging, Targeted Drug Delivery Sensors, In Vitro Diagnostics, Probes, Catalysis, and others. Targeted Drug Delivery is poised to register the fastest growth. The targeted drug delivery gold nanoparticles market is rapidly evolving in nanomedicine, driven by the precision and efficacy they offer in delivering therapeutic agents. Gold nanoparticles, characterized by biocompatibility and ease of modification, are becoming a focal point in oncology research. Their ability to deliver diverse therapeutic payloads to specific cells minimizes side effects, making them a promising platform for personalized medicine. Ongoing advancements in this market are poised to significantly impact treatment strategies and patient outcomes, marking a transformative shift in the landscape of medical interventions.
Market Share Analysis- Healthcare held a significant market share in 2023
The Global Gold Nanoparticles Market is analyzed across various Organizations including SMEs, Large Enterprises, and others. Of these, Healthcare held a significant market share in 2023. In healthcare, gold nanoparticles are pivotal for targeted drug delivery, offering precise therapeutic interventions with minimal side effects. Their application in diagnostics enhances imaging accuracy, enabling early disease detection. Gold nanoparticles also play a significant role in theranostics, combining therapy and diagnostics for a comprehensive treatment approach. Additionally, their use in biosensing applications contributes to sensitive biomarker detection, advancing disease diagnosis and monitoring. As the healthcare sector increasingly embraces these nanoparticles, their versatility is shaping the future of personalized medicine and diagnostic capabilities.
Gold Nanoparticles Market Segmentation
By Type
- Imaging
- Targeted Drug Delivery
- Sensors
- In Vitro Diagnostics
- Probes
- Catalysis
- Others
By End-User
- Electronics
- Healthcare
- Chemicals
- Others
By Region
- North America (United States, Canada, Mexico)
- Europe (Germany, France, United Kingdom, Spain, Italy, Others)
- Asia Pacific (China, India, Japan, South Korea, Australia, Others)
- Latin America (Brazil, Argentina, Others)
- Middle East and Africa (Saudi Arabia, UAE, Kuwait, Other Middle East, South Africa, Nigeria, Other Africa)
Gold Nanoparticles Market Companies
- NanoHybrids Inc
- Cytodiagnostics Inc
- Goldsol Inc
- BBI Solutions
- Nanopartz Inc
- Nanosphere Inc
- Nanostellar Inc
- Sigma Aldrich
- Solaris Nanosciences Corporation
- Tanaka Holdings Co Ltd
- The Metalor Group
*List not exhaustive
Gold Nanoparticles Market Outlook 2023
1 Market Overview
1.1 Introduction to the Gold Nanoparticles Market
1.2 Scope of the Study
1.3 Research Objective
1.3.1 Key Market Scope and Segments
1.3.2 Players Covered
1.3.3 Years Considered
2 Executive Summary
2.1 2023 Gold Nanoparticles Industry- Market Statistics
3 Market Dynamics
3.1 Market Drivers
3.2 Market Challenges
3.3 Market Opportunities
3.4 Market Trends
4 Market Factor Analysis
4.1 Porter’s Five Forces
4.2 Market Entropy
4.2.1 Global Gold Nanoparticles Market Companies with Area Served
4.2.2 Products Offerings Global Gold Nanoparticles Market
5 COVID-19 Impact Analysis and Outlook Scenarios
5.1.1 Covid-19 Impact Analysis
5.1.2 post-COVID-19 Scenario- Low Growth Case
5.1.3 post-COVID-19 Scenario- Reference Growth Case
5.1.4 post-COVID-19 Scenario- Low Growth Case
6 Global Gold Nanoparticles Market Trends
6.1 Global Gold Nanoparticles Revenue (USD Million) and CAGR (%) by Type (2018-2030)
6.2 Global Gold Nanoparticles Revenue (USD Million) and CAGR (%) by Applications (2018-2030)
6.3 Global Gold Nanoparticles Revenue (USD Million) and CAGR (%) by regions (2018-2030)
7 Global Gold Nanoparticles Market Revenue (USD Million) by Type, and Applications (2018-2022)
7.1 Global Gold Nanoparticles Revenue (USD Million) by Type (2018-2022)
7.1.1 Global Gold Nanoparticles Revenue (USD Million), Market Share (%) by Type (2018-2022)
7.2 Global Gold Nanoparticles Revenue (USD Million) by Applications (2018-2022)
7.2.1 Global Gold Nanoparticles Revenue (USD Million), Market Share (%) by Applications (2018-2022)
8 Global Gold Nanoparticles Development Regional Status and Outlook
8.1 Global Gold Nanoparticles Revenue (USD Million) By Regions (2018-2022)
8.2 North America Gold Nanoparticles Revenue (USD Million) by Type, and Application (2018-2022)
8.2.1 North America Gold Nanoparticles Revenue (USD Million) by Country (2018-2022)
8.2.2 North America Gold Nanoparticles Revenue (USD Million) by Type (2018-2022)
8.2.3 North America Gold Nanoparticles Revenue (USD Million) by Applications (2018-2022)
8.3 Europe Gold Nanoparticles Revenue (USD Million), by Type, and Applications (USD Million) (2018-2022)
8.3.1 Europe Gold Nanoparticles Revenue (USD Million), by Country (2018-2022)
8.3.2 Europe Gold Nanoparticles Revenue (USD Million) by Type (2018-2022)
8.3.3 Europe Gold Nanoparticles Revenue (USD Million) by Applications (2018-2022)
8.4 Asia Pacific Gold Nanoparticles Revenue (USD Million), and Revenue (USD Million) by Type, and Applications (2018-2022)
8.4.1 Asia Pacific Gold Nanoparticles Revenue (USD Million) by Country (2018-2022)
8.4.2 Asia Pacific Gold Nanoparticles Revenue (USD Million) by Type (2018-2022)
8.4.3 Asia Pacific Gold Nanoparticles Revenue (USD Million) by Applications (2018-2022)
8.5 South America Gold Nanoparticles Revenue (USD Million), by Type, and Applications (2018-2022)
8.5.1 South America Gold Nanoparticles Revenue (USD Million), by Country (2018-2022)
8.5.2 South America Gold Nanoparticles Revenue (USD Million) by Type (2018-2022)
8.5.3 South America Gold Nanoparticles Revenue (USD Million) by Applications (2018-2022)
8.6 Middle East and Africa Gold Nanoparticles Revenue (USD Million), by Type, Technology, Application, Thickness (2018-2022)
8.6.1 Middle East and Africa Gold Nanoparticles Revenue (USD Million) by Country (2018-2022)
8.6.2 Middle East and Africa Gold Nanoparticles Revenue (USD Million) by Type (2018-2022)
8.6.3 Middle East and Africa Gold Nanoparticles Revenue (USD Million) by Applications (2018-2022)
9 Company Profiles
10 Global Gold Nanoparticles Market Revenue (USD Million), by Type, and Applications (2023-2030)
10.1 Global Gold Nanoparticles Revenue (USD Million) and Market Share (%) by Type (2023-2030)
10.1.1 Global Gold Nanoparticles Revenue (USD Million), and Market Share (%) by Type (2023-2030)
10.2 Global Gold Nanoparticles Revenue (USD Million) and Market Share (%) by Applications (2023-2030)
10.2.1 Global Gold Nanoparticles Revenue (USD Million), and Market Share (%) by Applications (2023-2030)
11 Global Gold Nanoparticles Development Regional Status and Outlook Forecast
11.1 Global Gold Nanoparticles Revenue (USD Million) By Regions (2023-2030)
11.2 North America Gold Nanoparticles Revenue (USD Million) by Type, and Applications (2023-2030)
11.2.1 North America Gold Nanoparticles Revenue (USD) Million by Country (2023-2030)
11.2.2 North America Gold Nanoparticles Revenue (USD Million), by Type (2023-2030)
11.2.3 North America Gold Nanoparticles Revenue (USD Million), Market Share (%) by Applications (2023-2030)
11.3 Europe Gold Nanoparticles Revenue (USD Million), by Type, and Applications (2023-2030)
11.3.1 Europe Gold Nanoparticles Revenue (USD Million), by Country (2023-2030)
11.3.2 Europe Gold Nanoparticles Revenue (USD Million), by Type (2023-2030)
11.3.3 Europe Gold Nanoparticles Revenue (USD Million), by Applications (2023-2030)
11.4 Asia Pacific Gold Nanoparticles Revenue (USD Million) by Type, and Applications (2023-2030)
11.4.1 Asia Pacific Gold Nanoparticles Revenue (USD Million), by Country (2023-2030)
11.4.2 Asia Pacific Gold Nanoparticles Revenue (USD Million), by Type (2023-2030)
11.4.3 Asia Pacific Gold Nanoparticles Revenue (USD Million), by Applications (2023-2030)
11.5 South America Gold Nanoparticles Revenue (USD Million), by Type, and Applications (2023-2030)
11.5.1 South America Gold Nanoparticles Revenue (USD Million), by Country (2023-2030)
11.5.2 South America Gold Nanoparticles Revenue (USD Million), by Type (2023-2030)
11.5.3 South America Gold Nanoparticles Revenue (USD Million), by Applications (2023-2030)
11.6 Middle East and Africa Gold Nanoparticles Revenue (USD Million), by Type, and Applications (2023-2030)
11.6.1 Middle East and Africa Gold Nanoparticles Revenue (USD Million), by region (2023-2030)
11.6.2 Middle East and Africa Gold Nanoparticles Revenue (USD Million), by Type (2023-2030)
11.6.3 Middle East and Africa Gold Nanoparticles Revenue (USD Million), by Applications (2023-2030)
12 Methodology and Data Sources
12.1 Methodology/Research Approach
12.1.1 Research Programs/Design
12.1.2 Market Size Estimation
12.1.3 Market Breakdown and Data Triangulation
12.2 Data Sources
12.2.1 Secondary Sources
12.2.2 Primary Sources
12.3 Disclaimer
List of Tables
Table 1 Market Segmentation Analysis
Table 2 Global Gold Nanoparticles Market Companies with Areas Served
Table 3 Products Offerings Global Gold Nanoparticles Market
Table 4 Low Growth Scenario Forecasts
Table 5 Reference Case Growth Scenario
Table 6 High Growth Case Scenario
Table 7 Global Gold Nanoparticles Revenue (USD Million) And CAGR (%) By Type (2018-2030)
Table 8 Global Gold Nanoparticles Revenue (USD Million) And CAGR (%) By Applications (2018-2030)
Table 9 Global Gold Nanoparticles Revenue (USD Million) And CAGR (%) By Regions (2018-2030)
Table 10 Global Gold Nanoparticles Revenue (USD Million) By Type (2018-2022)
Table 11 Global Gold Nanoparticles Revenue Market Share (%) By Type (2018-2022)
Table 12 Global Gold Nanoparticles Revenue (USD Million) By Applications (2018-2022)
Table 13 Global Gold Nanoparticles Revenue Market Share (%) By Applications (2018-2022)
Table 14 Global Gold Nanoparticles Market Revenue (USD Million) By Regions (2018-2022)
Table 15 Global Gold Nanoparticles Market Share (%) By Regions (2018-2022)
Table 16 North America Gold Nanoparticles Revenue (USD Million) By Country (2018-2022)
Table 17 North America Gold Nanoparticles Revenue (USD Million) By Type (2018-2022)
Table 18 North America Gold Nanoparticles Revenue (USD Million) By Applications (2018-2022)
Table 19 Europe Gold Nanoparticles Revenue (USD Million) By Country (2018-2022)
Table 20 Europe Gold Nanoparticles Revenue (USD Million) By Type (2018-2022)
Table 21 Europe Gold Nanoparticles Revenue (USD Million) By Applications (2018-2022)
Table 22 Asia Pacific Gold Nanoparticles Revenue (USD Million) By Country (2018-2022)
Table 23 Asia Pacific Gold Nanoparticles Revenue (USD Million) By Type (2018-2022)
Table 24 Asia Pacific Gold Nanoparticles Revenue (USD Million) By Applications (2018-2022)
Table 25 South America Gold Nanoparticles Revenue (USD Million) By Country (2018-2022)
Table 26 South America Gold Nanoparticles Revenue (USD Million) By Type (2018-2022)
Table 27 South America Gold Nanoparticles Revenue (USD Million) By Applications (2018-2022)
Table 28 Middle East and Africa Gold Nanoparticles Revenue (USD Million) By Region (2018-2022)
Table 29 Middle East and Africa Gold Nanoparticles Revenue (USD Million) By Type (2018-2022)
Table 30 Middle East and Africa Gold Nanoparticles Revenue (USD Million) By Applications (2018-2022)
Table 31 Financial Analysis
Table 32 Global Gold Nanoparticles Revenue (USD Million) By Type (2023-2030)
Table 33 Global Gold Nanoparticles Revenue Market Share (%) By Type (2023-2030)
Table 34 Global Gold Nanoparticles Revenue (USD Million) By Applications (2023-2030)
Table 35 Global Gold Nanoparticles Revenue Market Share (%) By Applications (2023-2030)
Table 36 Global Gold Nanoparticles Market Revenue (USD Million), And Revenue (USD Million) By Regions (2023-2030)
Table 37 North America Gold Nanoparticles Revenue (USD)By Country (2023-2030)
Table 38 North America Gold Nanoparticles Revenue (USD Million) By Type (2023-2030)
Table 39 North America Gold Nanoparticles Revenue (USD Million) By Applications (2023-2030)
Table 40 Europe Gold Nanoparticles Revenue (USD Million) By Country (2023-2030)
Table 41 Europe Gold Nanoparticles Revenue (USD Million) By Type (2023-2030)
Table 42 Europe Gold Nanoparticles Revenue (USD Million) By Applications (2023-2030)
Table 43 Asia Pacific Gold Nanoparticles Revenue (USD Million) By Country (2023-2030)
Table 44 Asia Pacific Gold Nanoparticles Revenue (USD Million) By Type (2023-2030)
Table 45 Asia Pacific Gold Nanoparticles Revenue (USD Million) By Applications (2023-2030)
Table 46 South America Gold Nanoparticles Revenue (USD Million) By Country (2023-2030)
Table 47 South America Gold Nanoparticles Revenue (USD Million) By Type (2023-2030)
Table 48 South America Gold Nanoparticles Revenue (USD Million) By Applications (2023-2030)
Table 49 Middle East and Africa Gold Nanoparticles Revenue (USD Million) By Region (2023-2030)
Table 50 Middle East and Africa Gold Nanoparticles Revenue (USD Million) By Region (2023-2030)
Table 51 Middle East and Africa Gold Nanoparticles Revenue (USD Million) By Type (2023-2030)
Table 52 Middle East and Africa Gold Nanoparticles Revenue (USD Million) By Applications (2023-2030)
Table 53 Research Programs/Design for This Report
Table 54 Key Data Information from Secondary Sources
Table 55 Key Data Information from Primary Sources
List of Figures
Figure 1 Market Scope
Figure 2 Porter’s Five Forces
Figure 3 Global Gold Nanoparticles Revenue (USD Million) By Type (2018-2022)
Figure 4 Global Gold Nanoparticles Revenue Market Share (%) By Type (2022)
Figure 5 Global Gold Nanoparticles Revenue (USD Million) By Applications (2018-2022)
Figure 6 Global Gold Nanoparticles Revenue Market Share (%) By Applications (2022)
Figure 7 Global Gold Nanoparticles Market Revenue (USD Million) By Regions (2018-2022)
Figure 8 Global Gold Nanoparticles Market Share (%) By Regions (2022)
Figure 9 North America Gold Nanoparticles Revenue (USD Million) By Country (2018-2022)
Figure 10 North America Gold Nanoparticles Revenue (USD Million) By Type (2018-2022)
Figure 11 North America Gold Nanoparticles Revenue (USD Million) By Applications (2018-2022)
Figure 12 Europe Gold Nanoparticles Revenue (USD Million) By Country (2018-2022)
Figure 13 Europe Gold Nanoparticles Revenue (USD Million) By Type (2018-2022)
Figure 14 Europe Gold Nanoparticles Revenue (USD Million) By Applications (2018-2022)
Figure 15 Asia Pacific Gold Nanoparticles Revenue (USD Million) By Country (2018-2022)
Figure 16 Asia Pacific Gold Nanoparticles Revenue (USD Million) By Type (2018-2022)
Figure 17 Asia Pacific Gold Nanoparticles Revenue (USD Million) By Applications (2018-2022)
Figure 18 South America Gold Nanoparticles Revenue (USD Million) By Country (2018-2022)
Figure 19 South America Gold Nanoparticles Revenue (USD Million) By Type (2018-2022)
Figure 20 South America Gold Nanoparticles Revenue (USD Million) By Applications (2018-2022)
Figure 21 Middle East and Africa Gold Nanoparticles Revenue (USD Million) By Region (2018-2022)
Figure 22 Middle East and Africa Gold Nanoparticles Revenue (USD Million) By Type (2018-2022)
Figure 23 Middle East and Africa Gold Nanoparticles Revenue (USD Million) By Applications (2018-2022)
Figure 24 Global Gold Nanoparticles Revenue (USD Million) By Type (2023-2030)
Figure 25 Global Gold Nanoparticles Revenue Market Share (%) By Type (2030)
Figure 26 Global Gold Nanoparticles Revenue (USD Million) By Applications (2023-2030)
Figure 27 Global Gold Nanoparticles Revenue Market Share (%) By Applications (2030)
Figure 28 Global Gold Nanoparticles Market Revenue (USD Million) By Regions (2023-2030)
Figure 29 North America Gold Nanoparticles Revenue (USD Million) By Country (2023-2030)
Figure 30 North America Gold Nanoparticles Revenue (USD Million) By Type (2023-2030)
Figure 31 North America Gold Nanoparticles Revenue (USD Million) By Applications (2023-2030)
Figure 32 Europe Gold Nanoparticles Revenue (USD Million) By Country (2023-2030)
Figure 33 Europe Gold Nanoparticles Revenue (USD Million) By Type (2023-2030)
Figure 34 Europe Gold Nanoparticles Revenue (USD Million) By Applications (2023-2030)
Figure 35 Asia Pacific Gold Nanoparticles Revenue (USD Million) By Country (2023-2030)
Figure 36 Asia Pacific Gold Nanoparticles Revenue (USD Million) By Type (2023-2030)
Figure 37 Asia Pacific Gold Nanoparticles Revenue (USD Million) By Applications (2023-2030)
Figure 38 South America Gold Nanoparticles Revenue (USD Million) By Country (2023-2030)
Figure 39 South America Gold Nanoparticles Revenue (USD Million) By Type (2023-2030)
Figure 40 South America Gold Nanoparticles Revenue (USD Million) By Applications (2023-2030)
Figure 41 Middle East and Africa Gold Nanoparticles Revenue (USD Million) By Region (2023-2030)
Figure 42 Middle East and Africa Gold Nanoparticles Revenue (USD Million) By Region (2023-2030)
Figure 43 Middle East and Africa Gold Nanoparticles Revenue (USD Million) By Type (2023-2030)
Figure 44 Middle East and Africa Gold Nanoparticles Revenue (USD Million) By Applications (2023-2030)
Figure 45 Bottom-Up and Top-Down Approaches for This Report
Figure 46 Data Triangulation
