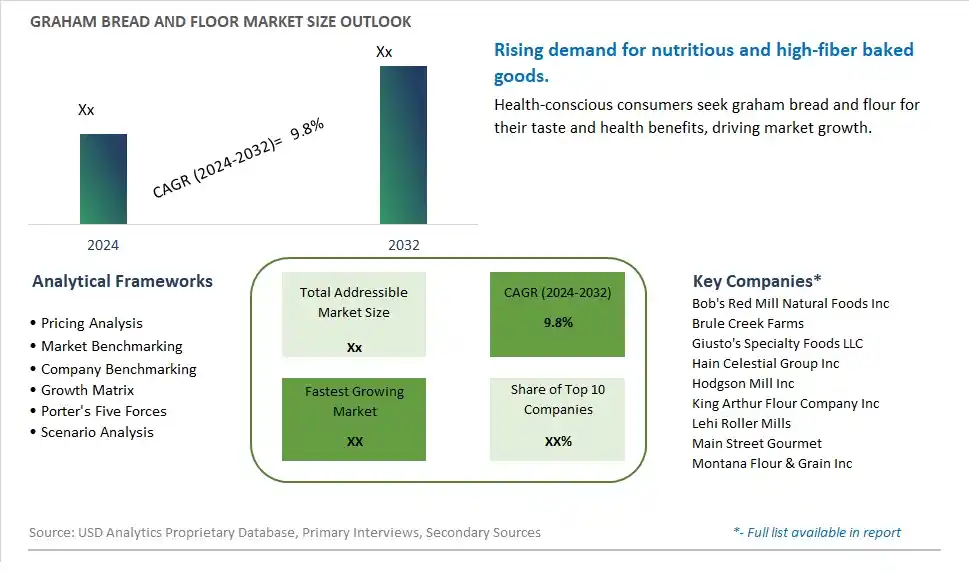
Global Graham Bread and Floor Market Size is valued at $XX Million in 2024 and is forecast to register a growth rate (CAGR) of 9.8% to reach $XX Million by 2032.
The global Graham Bread and Floor Market Comprehensive Study analyzes and forecasts the market size across 6 regions and 24 countries for diverse segments -By Type (Graham Bread, Graham Flour), By Application (Bakery, Food Service)
An Introduction to Graham Bread and Floor Market
The Graham Bread and Flour Market focuses on the production and sale of bread and flour made from whole wheat, catering to consumers seeking nutritious and wholesome food options. The market is driven by increasing awareness about the benefits of whole grains, rising demand for natural and minimally processed foods, and growing popularity of homemade baking. Additionally, advancements in flour milling technologies and the expansion of product offerings support market growth.
Graham Bread and Floor Competitive Landscape
The market report analyses the leading companies in the industry including Bob's Red Mill Natural Foods Inc, Brule Creek Farms, Giusto's Specialty Foods LLC, Hain Celestial Group Inc, Hodgson Mill Inc, King Arthur Flour Company Inc, Lehi Roller Mills, Main Street Gourmet, Montana Flour & Grain Inc, and Others.
Graham Bread and Floor Market Dynamics
Graham Bread and Floor Market Trend: Growing Demand for Health-Conscious Products
The Graham Bread and Flour Market is witnessing a significant trend towards health-conscious consumption. As consumers become more aware of the nutritional benefits of whole grains, there is a growing preference for Graham bread and flour products that offer higher fiber content and natural ingredients. This shift is fueled by an increasing focus on healthy eating habits, with consumers seeking out products that support better digestion and overall wellness.
Graham Bread and Floor Market Driver: Rising Popularity of Artisan and Specialty Breads
A major driver for the Graham Bread and Flour Market is the rising popularity of artisan and specialty breads. Consumers are increasingly attracted to the unique flavors and textures of handmade and locally sourced breads, which often use Graham flour as a key ingredient. This trend is supported by a surge in artisanal bakeries and home baking during the pandemic, which has heightened interest in traditional baking methods and ingredients.
Graham Bread and Floor Market Opportunity: Expansion into Gluten-Free and Organic Segments
A Market Opportunity in the Graham Bread and Flour Market lies in expanding into the gluten-free and organic product segments. With a growing number of consumers facing gluten intolerance and a rising demand for organic food products, there is a substantial market for gluten-free Graham flour and bread made from organically sourced grains. By catering to these specific dietary needs, manufacturers can tap into new customer bases and drive market growth.
Graham Bread and Floor Market Share Analysis: Graham Flour segment generated the highest revenue share in the industry
In the Graham Bread and Flour Market, the largest segment by type is Graham Flour. Graham flour is a whole wheat flour that retains the bran and germ layers, making it richer in nutrients and fiber compared to refined flours. It is characterized by its coarse texture and nutty flavor, which adds depth to baked goods like breads, muffins, and crackers. Graham flour's popularity stems from its health benefits and versatility in baking, appealing to health-conscious consumers seeking whole grain options for their diet.
Graham Bread and Floor Market Share Analysis: Food Service is the fastest growing segment over the forecast period to 2032
Among the applications in the Graham Bread and Flour Market, the fastest-growing segment to 2032 is Food Service. The food service sector, comprising restaurants, cafes, and institutional catering services, is increasingly incorporating graham bread and flour into their menus. This trend is driven by consumer preferences for healthier and more nutritious food choices, as well as the versatility of graham flour in creating a variety of baked goods. Restaurants and food service providers are using graham flour to offer whole grain options that appeal to health-conscious customers looking for alternatives to traditional white flour products. Further, graham bread's robust flavor and nutritional benefits align with current dietary trends favoring whole grains, driving its adoption across the food service industry.
Graham Bread and Floor Market Segmentation
By Type
Graham Bread
Graham Flour
By Application
Bakery
Food Service
Countries Analyzed
North America (US, Canada, Mexico)
Europe (Germany, UK, France, Spain, Italy, Russia, Rest of Europe)
Asia Pacific (China, India, Japan, South Korea, Australia, South East Asia, Rest of Asia)
South America (Brazil, Argentina, Rest of South America)
Middle East and Africa (Saudi Arabia, UAE, Rest of Middle East, South Africa, Egypt, Rest of Africa)
Graham Bread and Floor Companies Profiled in the Study
Bob's Red Mill Natural Foods Inc
Brule Creek Farms
Giusto's Specialty Foods LLC
Hain Celestial Group Inc
Hodgson Mill Inc
King Arthur Flour Company Inc
Lehi Roller Mills
Main Street Gourmet
Montana Flour & Grain Inc
*- List Not Exhaustive
Chapter 1. TABLE OF CONTENTS
Chapter 2. Introduction to Graham Bread and Floor Market
2.1. Market Overview
2.2. Key Statistics and Report Highlights
2.3. Scope of the Comprehensive Study
2.3.1. Market Definition
2.3.2 Countries and Regions Covered
2.3.3 Research Objective
2.3.4 Units, Currency, and Conversions
2.3.5 Industry Value Chain
2.4. Key Market Segments
2.5. Key Companies
2.6. Study Period
Chapter 3. Strategic Analysis Review
3.1. Graham Bread and Floor Pricing Analysis and Forecast
3.2. Porter’s Five Forces
3.3. Market Ecosystem
3.4. SWOT Analysis
3.5. Regulatory Scenario
3.3. Effects of Inflation, Russia-Ukraine War, moderating economic growth, and other macroeconomic factors
Chapter 4. Competitive Landscape
4.1. Market Share Analysis
4.1.1. Global Graham Bread and Floor Market Share by Company, 2023
4.1.2. Product Offerings of Leading Graham Bread and Floor Companies
4.2. Market Entropy
4.2.1. New Product Launches in the Industry
4.2.2. Mergers, Acquisitions, Joint ventures, and Partnerships
4.3. Key Strategies and Best Practices
Chapter 5. Global Market Projections: Best, Reference, and Low Case Scenarios
5.1. Growth Analysis- Case Scenario Definitions
5.2. Low Growth Case Scenario Forecasts
5.3. Reference Growth Case Scenario Forecasts
5.4. High Growth Case Scenario Forecasts
Chapter 6. Market Dynamics
6.1. Graham Bread and Floor Market Drivers
6.2. Graham Bread and Floor Market Challenges
6.6. Graham Bread and Floor Market Opportunities
6.4. Graham Bread and Floor Market Trends
Chapter 7. Global Graham Bread and Floor Market Outlook Trends
7.1. Global Graham Bread and Floor Revenue (USD Million) and CAGR (%) by Type (2021-2032)
7.2. Global Graham Bread and Floor Revenue (USD Million) and CAGR (%) by Application (2021-2032)
7.3. Global Graham Bread and Floor Revenue (USD Million) and CAGR (%) by Product (2021-2032)
By Type
Graham Bread
Graham Flour
By Application
Bakery
Food Service
Chapter 8. Global Graham Bread and Floor Regional Analysis and Outlook
8.1. Global Graham Bread and Floor Revenue (USD Million) By Regions (2021- 2032)
8.2. North America Graham Bread and Floor Revenue (USD Million) by Country (2021-2032)
8.2.1. United States Graham Bread and Floor Regional Analysis and Outlook
8.2.2. Canada Graham Bread and Floor Regional Analysis and Outlook
8.2.3. Mexico Graham Bread and Floor Regional Analysis and Outlook
8.3. Europe Graham Bread and Floor Revenue (USD Million), by Country (2021-2032)
8.3.1. Germany Graham Bread and Floor Regional Analysis and Outlook
8.3.2. France Graham Bread and Floor Regional Analysis and Outlook
8.3.3. United Kingdom Graham Bread and Floor Regional Analysis and Outlook
8.3.4. Spain Graham Bread and Floor Regional Analysis and Outlook
8.3.5. Italy Graham Bread and Floor Regional Analysis and Outlook
8.3.6. Russia Graham Bread and Floor Regional Analysis and Outlook
8.3.7. Rest of Europe Graham Bread and Floor Regional Analysis and Outlook
8.4. Asia Pacific Graham Bread and Floor Revenue (USD Million) by Country (2021-2032)
8.4.1. China Graham Bread and Floor Regional Analysis and Outlook
8.4.2. Japan Graham Bread and Floor Regional Analysis and Outlook
8.4.3. India Graham Bread and Floor Regional Analysis and Outlook
8.4.4. South Korea Graham Bread and Floor Regional Analysis and Outlook
8.4.5. Australia Graham Bread and Floor Regional Analysis and Outlook
8.4.6. South East Asia Graham Bread and Floor Regional Analysis and Outlook
8.4.7. Rest of Asia Pacific Graham Bread and Floor Regional Analysis and Outlook
8.5. South America Graham Bread and Floor Revenue (USD Million), by Country (2021-2032)
8.5.1. Brazil Graham Bread and Floor Regional Analysis and Outlook
8.5.2. Argentina Graham Bread and Floor Regional Analysis and Outlook
8.5.3. Rest of South America Graham Bread and Floor Regional Analysis and Outlook
8.6. Middle East and Africa Graham Bread and Floor Revenue (USD Million) by Country (2021-2032)
8.6.1. Middle East Graham Bread and Floor Regional Analysis and Outlook
8.6.2. Africa Graham Bread and Floor Regional Analysis and Outlook
Chapter 9. North America Graham Bread and Floor Analysis and Outlook
9.1. North America Graham Bread and Floor Revenue (USD Million) by Segments (2021-2032)
9.1.1. North America Graham Bread and Floor Revenue (USD Million) by Type (2021-2032)
9.1.2. North America Graham Bread and Floor Revenue (USD Million) by Application (2021-2032)
9.1.3. North America Graham Bread and Floor Revenue (USD Million) by Product (2021-2032)
By Type
Graham Bread
Graham Flour
By Application
Bakery
Food Service
Chapter 10. Europe Graham Bread and Floor Analysis and Outlook
10.1. Europe Graham Bread and Floor Revenue (USD Million), by Segments (USD Million) (2021-2032)
10.1.1. Europe Graham Bread and Floor Revenue (USD Million) by Type (2021-2032)
10.1.2. Europe Graham Bread and Floor Revenue (USD Million) by Application (2021-2032)
10.1.3. Europe Graham Bread and Floor Revenue (USD Million) by Product (2021-2032)
By Type
Graham Bread
Graham Flour
By Application
Bakery
Food Service
Chapter 11. Asia Pacific Graham Bread and Floor Analysis and Outlook
11.1. Asia Pacific Graham Bread and Floor Revenue (USD Million), and Revenue (USD Million) by Segments (2021-2032)
11.1.1. Asia Pacific Graham Bread and Floor Revenue (USD Million) by Type (2021-2032)
11.1.2. Asia Pacific Graham Bread and Floor Revenue (USD Million) by Application (2021-2032)
11.1.3. Asia Pacific Graham Bread and Floor Revenue (USD Million) by Product (2021-2032)
By Type
Graham Bread
Graham Flour
By Application
Bakery
Food Service
Chapter 12. South America Graham Bread and Floor Analysis and Outlook
12.1. South America Graham Bread and Floor Revenue (USD Million), by Segments (2021-2032)
12.1.1. South America Graham Bread and Floor Revenue (USD Million) by Type (2021-2032)
12.1.2. South America Graham Bread and Floor Revenue (USD Million) by Application (2021-2032)
12.1.3. South America Graham Bread and Floor Revenue (USD Million) by Product (2021-2032)
By Type
Graham Bread
Graham Flour
By Application
Bakery
Food Service
Chapter 13. Middle East and Africa Graham Bread and Floor Analysis and Outlook
13.1. Middle East and Africa Graham Bread and Floor Revenue (USD Million), by Segments (2021-2032)
13.1.1. Middle East and Africa Graham Bread and Floor Revenue (USD Million) by Type (2021-2032)
13.1.2. Middle East and Africa Graham Bread and Floor Revenue (USD Million) by Application (2021-2032)
13.1.3. Middle East and Africa Graham Bread and Floor Revenue (USD Million) by Product (2021-2032)
By Type
Graham Bread
Graham Flour
By Application
Bakery
Food Service
Chapter 14. Graham Bread and Floor Company Profiles
14.1 Business Overview
14.2 Product Profiles
14.3 SWOT Profiles
14.5 Recent Developments
14.6 Financial Profile
List of Companies
Bob's Red Mill Natural Foods Inc
Brule Creek Farms
Giusto's Specialty Foods LLC
Hain Celestial Group Inc
Hodgson Mill Inc
King Arthur Flour Company Inc
Lehi Roller Mills
Main Street Gourmet
Montana Flour & Grain Inc
15. Methodology and Data Sources
15.1 Customization Offerings
15.2 Subscription Services
15.3 Related Reports
15.4 Publisher Expertise
LIST OF TABLES
Table 1 Market Segmentation Analysis
Table 2 Global Graham Bread and Floor Market Share of Leading Companies, 2023
Table 3 Product Offerings of Leading Companies
Table 4 Low Growth Scenario Forecasts
Table 5 Reference Case Growth Scenario
Table 6 High Growth Case Scenario
Table 7 Global Graham Bread and Floor Revenue (USD Million) And CAGR (%) By Type (2021-2032)
Table 8 Global Graham Bread and Floor Revenue (USD Million) And CAGR (%) By Application (2021-2032)
Table 9 Global Graham Bread and Floor Revenue (USD Million) And CAGR (%) By Product (2021-2032)
Table 10 Global Graham Bread and Floor Market Revenue (USD Million) By Regions (2021-2032)
Table 11 Global Graham Bread and Floor Market Share (%) By Regions (2021-2032)
Table 12 North America Graham Bread and Floor Revenue (USD Million) By Country (2021-2032)
Table 13 Europe Graham Bread and Floor Revenue (USD Million) By Country (2021-2032)
Table 14 Asia Pacific Graham Bread and Floor Revenue (USD Million) By Country (2021-2032)
Table 15 South America Graham Bread and Floor Revenue (USD Million) By Country (2021-2032)
Table 16 Middle East and Africa Graham Bread and Floor Revenue (USD Million) By Region (2021-2032)
Table 17 North America Graham Bread and Floor Revenue (USD Million) By Type (2021-2032)
Table 18 North America Graham Bread and Floor Revenue (USD Million) By Application (2021-2032)
Table 19 North America Graham Bread and Floor Revenue (USD Million) By Product (2021-2032)
Table 20 Europe Graham Bread and Floor Revenue (USD Million) By Type (2021-2032)
Table 21 Europe Graham Bread and Floor Revenue (USD Million) By Application (2021-2032)
Table 22 Europe Graham Bread and Floor Revenue (USD Million) By Product (2021-2032)
Table 23 Asia Pacific Graham Bread and Floor Revenue (USD Million) By Type (2021-2032)
Table 24 Asia Pacific Graham Bread and Floor Revenue (USD Million) By Application (2021-2032)
Table 25 Asia Pacific Graham Bread and Floor Revenue (USD Million) By Product (2021-2032)
Table 26 South America Graham Bread and Floor Revenue (USD Million) By Type (2021-2032)
Table 27 South America Graham Bread and Floor Revenue (USD Million) By Application (2021-2032)
Table 28 South America Graham Bread and Floor Revenue (USD Million) By Product (2021-2032)
Table 29 Middle East and Africa Graham Bread and Floor Revenue (USD Million) By Type (2021-2032)
Table 30 Middle East and Africa Graham Bread and Floor Revenue (USD Million) By Application (2021-2032)
Table 31 Middle East and Africa Graham Bread and Floor Revenue (USD Million) By Product (2021-2032)
LIST OF FIGURES
Figure 1. Market Scope
Figure 2. Pricing Forecasts Per Unit, 2023- 2032
Figure 3. Porter’s Five Forces
Figure 4. Global Graham Bread and Floor Market Revenue (USD Million) By Regions (2021-2032)
Figure 5. Global Graham Bread and Floor Market Share (%) By Regions (2023)
Figure 6. North America Graham Bread and Floor Revenue (USD Million) By Country (2021-2032)
Figure 7. United States Graham Bread and Floor Revenue (USD Million) By Country (2021-2032)
Figure 8. Canada Graham Bread and Floor Revenue (USD Million) By Country (2021-2032)
Figure 9. Mexico Graham Bread and Floor Revenue (USD Million) By Country (2021-2032)
Figure 10. Europe Graham Bread and Floor Revenue (USD Million) By Country (2021-2032)
Figure 11. Germany Graham Bread and Floor Revenue (USD Million) By Country (2021-2032)
Figure 12. France Graham Bread and Floor Revenue (USD Million) By Country (2021-2032)
Figure 13. United Kingdom Graham Bread and Floor Revenue (USD Million) By Country (2021-2032)
Figure 14. Spain Graham Bread and Floor Revenue (USD Million) By Country (2021-2032)
Figure 15. Italy Graham Bread and Floor Revenue (USD Million) By Country (2021-2032)
Figure 16. Russia Graham Bread and Floor Revenue (USD Million) By Country (2021-2032)
Figure 17. Rest of Europe Graham Bread and Floor Revenue (USD Million) By Country (2021-2032)
Figure 11. Asia Pacific Graham Bread and Floor Revenue (USD Million) By Country (2021-2032)
Figure 12. China Graham Bread and Floor Revenue (USD Million) By Country (2021-2032)
Figure 13. Japan Graham Bread and Floor Revenue (USD Million) By Country (2021-2032)
Figure 14. India Graham Bread and Floor Revenue (USD Million) By Country (2021-2032)
Figure 15. South Korea Graham Bread and Floor Revenue (USD Million) By Country (2021-2032)
Figure 16. Australia Graham Bread and Floor Revenue (USD Million) By Country (2021-2032)
Figure 17. South East Asia Graham Bread and Floor Revenue (USD Million) By Country (2021-2032)
Figure 18. South America Graham Bread and Floor Revenue (USD Million) By Country (2021-2032)
Figure 19. Brazil Graham Bread and Floor Revenue (USD Million) By Country (2021-2032)
Figure 20. Argentina Graham Bread and Floor Revenue (USD Million) By Country (2021-2032)
Figure 21. Rest of Asia Pacific Graham Bread and Floor Revenue (USD Million) By Country (2021-2032)
Figure 22. Middle East and Africa Graham Bread and Floor Revenue (USD Million) By Region (2021-2032)
Figure 23. Saudi Arabia Graham Bread and Floor Revenue (USD Million) By Region (2021-2032)
Figure 24. The UAE Graham Bread and Floor Revenue (USD Million) By Region (2021-2032)
Figure 25. Rest of Middle East Graham Bread and Floor Revenue (USD Million) By Region (2021-2032)
Figure 26. South Africa Graham Bread and Floor Revenue (USD Million) By Region (2021-2032)
Figure 27. Africa Graham Bread and Floor Revenue (USD Million) By Region (2021-2032)
Figure 28. North America Graham Bread and Floor Revenue (USD Million) By Type (2021-2032)
Figure 29. North America Graham Bread and Floor Revenue (USD Million) By Application (2021-2032)
Figure 30. North America Graham Bread and Floor Revenue (USD Million) By Product (2021-2032)
Figure 31. Europe Graham Bread and Floor Revenue (USD Million) By Type (2021-2032)
Figure 32. Europe Graham Bread and Floor Revenue (USD Million) By Application (2021-2032)
Figure 33. Europe Graham Bread and Floor Revenue (USD Million) By Product (2021-2032)
Figure 34. Asia Pacific Graham Bread and Floor Revenue (USD Million) By Type (2021-2032)
Figure 35. Asia Pacific Graham Bread and Floor Revenue (USD Million) By Application (2021-2032)
Figure 36. Asia Pacific Graham Bread and Floor Revenue (USD Million) By Product (2021-2032)
Figure 37. South America Graham Bread and Floor Revenue (USD Million) By Type (2021-2032)
Figure 38. South America Graham Bread and Floor Revenue (USD Million) By Application (2021-2032)
Figure 39. South America Graham Bread and Floor Revenue (USD Million) By Product (2021-2032)
Figure 40. Middle East and Africa Graham Bread and Floor Revenue (USD Million) By Type (2021-2032)
Figure 41. Middle East and Africa Graham Bread and Floor Revenue (USD Million) By Application (2021-2032)
Figure 42. Middle East and Africa Graham Bread and Floor Revenue (USD Million) By Product (2021-2032)
By Type
Graham Bread
Graham Flour
By Application
Bakery
Food Service
Countries Analyzed
North America (US, Canada, Mexico)
Europe (Germany, UK, France, Spain, Italy, Russia, Rest of Europe)
Asia Pacific (China, India, Japan, South Korea, Australia, South East Asia, Rest of Asia)
South America (Brazil, Argentina, Rest of South America)
Middle East and Africa (Saudi Arabia, UAE, Rest of Middle East, South Africa, Egypt, Rest of Africa)
