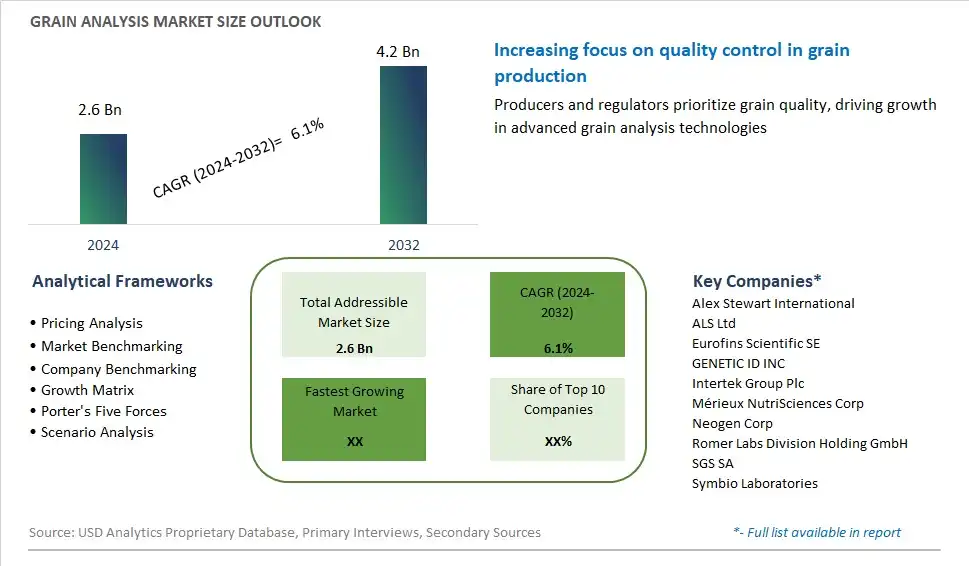
Global Grain Analysis Market Size is valued at $2.6 Billion in 2024 and is forecast to register a growth rate (CAGR) of 6.1% to reach $4.2 Billion by 2032.
The global Grain Analysis Market Comprehensive Study analyzes and forecasts the market size across 6 regions and 24 countries for diverse segments -By Type (Cereals, Oilseeds, Pulses), By Target Tested (Pathogens, Pesticides, GMOs, Mycotoxin, Others), By Technology (Traditional, Rapid), By End-User (Food, Feed), By Component (Instruments, Consumables & reagents, Reference materials)
An Introduction to Grain Analysis Market
Grain analysis involves the testing and evaluation of grains and cereals to assess their quality, nutritional composition, and suitability for various food and feed applications in 2024. With increasing globalization, supply chain complexity, and quality standards, grain analysis plays a critical role in ensuring the safety, integrity, and marketability of grain products throughout the supply chain. Testing parameters for grain analysis include moisture content, protein content, mycotoxin levels, physical properties, and genetic purity, which influence grain quality, processing characteristics, and end-product performance. Grain analysis laboratories utilize various analytical techniques, including near-infrared spectroscopy (NIRS), chromatography, microscopy, and DNA testing, to perform rapid, accurate, and comprehensive analysis of grain samples. With advancements in analytical instrumentation, automation, and data management, grain analysis labs can provide valuable insights and assurance to stakeholders across the grain industry, including growers, traders, processors, and regulators. As consumer demand for traceability, transparency, and food safety grows, the market for grain analysis services and technologies is expected to expand, driven by investments in testing infrastructure, capacity expansion, and regulatory compliance that ensure the quality and safety of grain products in the global market.
Grain Analysis Competitive Landscape
The market report analyses the leading companies in the industry including Alex Stewart International, ALS Ltd, Eurofins Scientific SE, GENETIC ID INC, Intertek Group Plc, Mérieux NutriSciences Corp, Neogen Corp, Romer Labs Division Holding GmbH, SGS SA, Symbio Laboratories, and Others.
Grain Analysis Market Dynamics
Grain Analysis Market Trend: Increasing Focus on Food Safety and Quality
One prominent trend in the grain analysis market is the increasing focus on food safety and quality. As consumers become more health-conscious and aware of foodborne illnesses, there is a growing demand for comprehensive analysis of grains to ensure their safety and nutritional quality. Governments and regulatory bodies worldwide are implementing stringent standards and regulations for food safety, including mandatory testing of grains for contaminants such as pesticides, mycotoxins, heavy metals, and pathogens. Additionally, consumers are demanding transparency in the food supply chain, driving the need for accurate labeling and certification of grain products. Consequently, there is a rising adoption of advanced analytical techniques and technologies for grain analysis to meet regulatory requirements and consumer expectations, driving market growth.
Market Driver: Stringent Regulatory Standards and Compliance Requirements
A key driver propelling the grain analysis market is the imposition of stringent regulatory standards and compliance requirements. Governments and regulatory authorities across the globe are implementing strict regulations to ensure the safety and quality of grains and grain-based products. These regulations mandate regular testing and analysis of grains throughout the production, processing, and distribution stages to mitigate health risks and safeguard consumer interests. Additionally, international trade agreements and certifications necessitate adherence to specific quality standards for grains, driving the demand for comprehensive grain analysis solutions. The need for compliance with regulatory requirements is compelling food manufacturers, processors, and distributors to invest in advanced grain analysis technologies and services, thereby fueling market growth.
Market Opportunity: Adoption of Technological Innovations for Grain Analysis
An opportunity within the grain analysis market lies in the adoption of technological innovations to enhance testing efficiency, accuracy, and throughput. With advancements in analytical instrumentation, automation, and data analytics, there is a growing range of innovative solutions available for grain analysis. Opportunities exist for companies to develop and offer integrated systems that streamline the entire grain analysis process, from sample preparation to data interpretation. Moreover, the emergence of technologies such as near-infrared spectroscopy (NIRS), chromatography, mass spectrometry, and DNA-based techniques presents new avenues for rapid and non-destructive analysis of grains. By investing in research and development and collaborating with technology providers, companies can capitalize on the demand for cutting-edge grain analysis solutions and gain a competitive edge in the market.
Grain Analysis Market Share Analysis: Cereals held the dominant market share in 2024
In the Grain Analysis Market, the Cereals segment is the largest due to the extensive cultivation and consumption of cereal crops worldwide. Cereals, including wheat, rice, maize, barley, and oats, represent staple food sources for a significant portion of the global population. The dominance of the Cereals segment is attributed to the vast agricultural acreage dedicated to cereal cultivation, driven by their nutritional value, versatility, and widespread use in various food and beverage products. Grain analysis plays a crucial role in ensuring the quality, safety, and compliance of cereal grains with regulatory standards and consumer preferences. Further, the increasing demand for cereals as key ingredients in processed foods, bakery products, breakfast cereals, and animal feed further drives the need for accurate and reliable grain analysis services. Additionally, advancements in analytical technologies, such as near-infrared spectroscopy and chromatography, enhance the efficiency and accuracy of cereal grain analysis, contributing to the dominance of the Cereals segment in the Grain Analysis Market. Overall, the Cereals segment's essential role in global food security, coupled with the demand for quality assurance and safety in cereal-based products, solidifies its position as the largest segment in the Grain Analysis Market.
Grain Analysis Market Share Analysis: GMOs market is poised to register the fastest growth rae over the forecast period to 2032
In the Grain Analysis Market, the GMOs (Genetically Modified Organisms) segment is the fastest-growing segment due to increasing regulatory scrutiny, consumer awareness, and global trade regulations surrounding genetically modified crops. GMO testing plays a critical role in ensuring compliance with labeling requirements and regulatory standards, driving the demand for accurate and reliable GMO analysis services. The expansion of genetically modified crop cultivation worldwide, coupled with the rising adoption of biotechnology in agriculture, fuels the need for comprehensive GMO testing to verify the presence or absence of genetically modified traits in grain samples. Further, the growing consumer preference for non-GMO and organic products, along with the emergence of stringent labeling laws in various countries, further amplifies the demand for GMO analysis services. Additionally, advancements in molecular biology techniques, such as polymerase chain reaction (PCR) and next-generation sequencing, enhance the sensitivity and specificity of GMO detection methods, facilitating the rapid growth of the GMOs segment in the Grain Analysis Market. Overall, the GMOs segment's pivotal role in ensuring transparency, traceability, and compliance in the food supply chain solidifies its position as the fastest-growing segment in the Grain Analysis Market.
Grain Analysis Market Share Analysis: Traditional held the dominant market share in 2024
In the Grain Analysis Market, the Traditional segment is the largest due to its widespread adoption and established presence in the industry. Traditional grain analysis methods, such as microscopy, wet chemistry, and manual assays, have been the cornerstone of grain quality assessment for decades. These methods are well-established, reliable, and widely accepted by regulatory agencies and stakeholders across the grain industry. Further, traditional techniques offer comprehensive analysis capabilities for various grain parameters, including moisture content, protein content, grain size, and impurities, making them indispensable for quality control and assurance purposes. Additionally, many laboratories and testing facilities are equipped with traditional analysis equipment and expertise, further contributing to the dominance of the Traditional segment in the Grain Analysis Market. While rapid analysis technologies offer advantages in terms of speed and automation, the traditional methods remain prevalent due to their proven accuracy, versatility, and regulatory acceptance. Overall, the Traditional segment's established infrastructure, reliability, and versatility solidify its position as the largest segment in the Grain Analysis Market.
Grain Analysis Market Segmentation
By Type
Cereals
Oilseeds
Pulses
By Target Tested
Pathogens
Pesticides
GMOs
Mycotoxin
Others
By Technology
Traditional
Rapid
By End-User
Food
Feed
By Component
Instruments
Consumables & reagents
Reference materials
Countries Analyzed
North America (US, Canada, Mexico)
Europe (Germany, UK, France, Spain, Italy, Russia, Rest of Europe)
Asia Pacific (China, India, Japan, South Korea, Australia, South East Asia, Rest of Asia)
South America (Brazil, Argentina, Rest of South America)
Middle East and Africa (Saudi Arabia, UAE, Rest of Middle East, South Africa, Egypt, Rest of Africa)
Grain Analysis Companies Profiled in the Study
Alex Stewart International
ALS Ltd
Eurofins Scientific SE
GENETIC ID INC
Intertek Group Plc
Mérieux NutriSciences Corp
Neogen Corp
Romer Labs Division Holding GmbH
SGS SA
Symbio Laboratories
*- List Not Exhaustive
Chapter 1. TABLE OF CONTENTS
Chapter 2. Introduction to Grain Analysis Market
2.1. Market Overview
2.2. Key Statistics and Report Highlights
2.3. Scope of the Comprehensive Study
2.3.1. Market Definition
2.3.2 Countries and Regions Covered
2.3.3 Research Objective
2.3.4 Units, Currency, and Conversions
2.3.5 Industry Value Chain
2.4. Key Market Segments
2.5. Key Companies
2.6. Study Period
Chapter 3. Strategic Analysis Review
3.1. Grain Analysis Pricing Analysis and Forecast
3.2. Porter’s Five Forces
3.3. Market Ecosystem
3.4. SWOT Analysis
3.5. Regulatory Scenario
3.3. Effects of Inflation, Russia-Ukraine War, moderating economic growth, and other macroeconomic factors
Chapter 4. Competitive Landscape
4.1. Market Share Analysis
4.1.1. Global Grain Analysis Market Share by Company, 2023
4.1.2. Product Offerings of Leading Grain Analysis Companies
4.2. Market Entropy
4.2.1. New Product Launches in the Industry
4.2.2. Mergers, Acquisitions, Joint ventures, and Partnerships
4.3. Key Strategies and Best Practices
Chapter 5. Global Market Projections: Best, Reference, and Low Case Scenarios
5.1. Growth Analysis- Case Scenario Definitions
5.2. Low Growth Case Scenario Forecasts
5.3. Reference Growth Case Scenario Forecasts
5.4. High Growth Case Scenario Forecasts
Chapter 6. Market Dynamics
6.1. Grain Analysis Market Drivers
6.2. Grain Analysis Market Challenges
6.6. Grain Analysis Market Opportunities
6.4. Grain Analysis Market Trends
Chapter 7. Global Grain Analysis Market Outlook Trends
7.1. Global Grain Analysis Revenue (USD Million) and CAGR (%) by Type (2021-2032)
7.2. Global Grain Analysis Revenue (USD Million) and CAGR (%) by Application (2021-2032)
7.3. Global Grain Analysis Revenue (USD Million) and CAGR (%) by Product (2021-2032)
By Type
Cereals
Oilseeds
Pulses
By Target Tested
Pathogens
Pesticides
GMOs
Mycotoxin
Others
By Technology
Traditional
Rapid
By End-User
Food
Feed
By Component
Instruments
Consumables & reagents
Reference materials
Chapter 8. Global Grain Analysis Regional Analysis and Outlook
8.1. Global Grain Analysis Revenue (USD Million) By Regions (2021- 2032)
8.2. North America Grain Analysis Revenue (USD Million) by Country (2021-2032)
8.2.1. United States Grain Analysis Regional Analysis and Outlook
8.2.2. Canada Grain Analysis Regional Analysis and Outlook
8.2.3. Mexico Grain Analysis Regional Analysis and Outlook
8.3. Europe Grain Analysis Revenue (USD Million), by Country (2021-2032)
8.3.1. Germany Grain Analysis Regional Analysis and Outlook
8.3.2. France Grain Analysis Regional Analysis and Outlook
8.3.3. United Kingdom Grain Analysis Regional Analysis and Outlook
8.3.4. Spain Grain Analysis Regional Analysis and Outlook
8.3.5. Italy Grain Analysis Regional Analysis and Outlook
8.3.6. Russia Grain Analysis Regional Analysis and Outlook
8.3.7. Rest of Europe Grain Analysis Regional Analysis and Outlook
8.4. Asia Pacific Grain Analysis Revenue (USD Million) by Country (2021-2032)
8.4.1. China Grain Analysis Regional Analysis and Outlook
8.4.2. Japan Grain Analysis Regional Analysis and Outlook
8.4.3. India Grain Analysis Regional Analysis and Outlook
8.4.4. South Korea Grain Analysis Regional Analysis and Outlook
8.4.5. Australia Grain Analysis Regional Analysis and Outlook
8.4.6. South East Asia Grain Analysis Regional Analysis and Outlook
8.4.7. Rest of Asia Pacific Grain Analysis Regional Analysis and Outlook
8.5. South America Grain Analysis Revenue (USD Million), by Country (2021-2032)
8.5.1. Brazil Grain Analysis Regional Analysis and Outlook
8.5.2. Argentina Grain Analysis Regional Analysis and Outlook
8.5.3. Rest of South America Grain Analysis Regional Analysis and Outlook
8.6. Middle East and Africa Grain Analysis Revenue (USD Million) by Country (2021-2032)
8.6.1. Middle East Grain Analysis Regional Analysis and Outlook
8.6.2. Africa Grain Analysis Regional Analysis and Outlook
Chapter 9. North America Grain Analysis Analysis and Outlook
9.1. North America Grain Analysis Revenue (USD Million) by Segments (2021-2032)
9.1.1. North America Grain Analysis Revenue (USD Million) by Type (2021-2032)
9.1.2. North America Grain Analysis Revenue (USD Million) by Application (2021-2032)
9.1.3. North America Grain Analysis Revenue (USD Million) by Product (2021-2032)
By Type
Cereals
Oilseeds
Pulses
By Target Tested
Pathogens
Pesticides
GMOs
Mycotoxin
Others
By Technology
Traditional
Rapid
By End-User
Food
Feed
By Component
Instruments
Consumables & reagents
Reference materials
Chapter 10. Europe Grain Analysis Analysis and Outlook
10.1. Europe Grain Analysis Revenue (USD Million), by Segments (USD Million) (2021-2032)
10.1.1. Europe Grain Analysis Revenue (USD Million) by Type (2021-2032)
10.1.2. Europe Grain Analysis Revenue (USD Million) by Application (2021-2032)
10.1.3. Europe Grain Analysis Revenue (USD Million) by Product (2021-2032)
By Type
Cereals
Oilseeds
Pulses
By Target Tested
Pathogens
Pesticides
GMOs
Mycotoxin
Others
By Technology
Traditional
Rapid
By End-User
Food
Feed
By Component
Instruments
Consumables & reagents
Reference materials
Chapter 11. Asia Pacific Grain Analysis Analysis and Outlook
11.1. Asia Pacific Grain Analysis Revenue (USD Million), and Revenue (USD Million) by Segments (2021-2032)
11.1.1. Asia Pacific Grain Analysis Revenue (USD Million) by Type (2021-2032)
11.1.2. Asia Pacific Grain Analysis Revenue (USD Million) by Application (2021-2032)
11.1.3. Asia Pacific Grain Analysis Revenue (USD Million) by Product (2021-2032)
By Type
Cereals
Oilseeds
Pulses
By Target Tested
Pathogens
Pesticides
GMOs
Mycotoxin
Others
By Technology
Traditional
Rapid
By End-User
Food
Feed
By Component
Instruments
Consumables & reagents
Reference materials
Chapter 12. South America Grain Analysis Analysis and Outlook
12.1. South America Grain Analysis Revenue (USD Million), by Segments (2021-2032)
12.1.1. South America Grain Analysis Revenue (USD Million) by Type (2021-2032)
12.1.2. South America Grain Analysis Revenue (USD Million) by Application (2021-2032)
12.1.3. South America Grain Analysis Revenue (USD Million) by Product (2021-2032)
By Type
Cereals
Oilseeds
Pulses
By Target Tested
Pathogens
Pesticides
GMOs
Mycotoxin
Others
By Technology
Traditional
Rapid
By End-User
Food
Feed
By Component
Instruments
Consumables & reagents
Reference materials
Chapter 13. Middle East and Africa Grain Analysis Analysis and Outlook
13.1. Middle East and Africa Grain Analysis Revenue (USD Million), by Segments (2021-2032)
13.1.1. Middle East and Africa Grain Analysis Revenue (USD Million) by Type (2021-2032)
13.1.2. Middle East and Africa Grain Analysis Revenue (USD Million) by Application (2021-2032)
13.1.3. Middle East and Africa Grain Analysis Revenue (USD Million) by Product (2021-2032)
By Type
Cereals
Oilseeds
Pulses
By Target Tested
Pathogens
Pesticides
GMOs
Mycotoxin
Others
By Technology
Traditional
Rapid
By End-User
Food
Feed
By Component
Instruments
Consumables & reagents
Reference materials
Chapter 14. Grain Analysis Company Profiles
14.1 Business Overview
14.2 Product Profiles
14.3 SWOT Profiles
14.5 Recent Developments
14.6 Financial Profile
List of Companies
Alex Stewart International
ALS Ltd
Eurofins Scientific SE
GENETIC ID INC
Intertek Group Plc
Mérieux NutriSciences Corp
Neogen Corp
Romer Labs Division Holding GmbH
SGS SA
Symbio Laboratories
15. Methodology and Data Sources
15.1 Customization Offerings
15.2 Subscription Services
15.3 Related Reports
15.4 Publisher Expertise
LIST OF TABLES
Table 1 Market Segmentation Analysis
Table 2 Global Grain Analysis Market Share of Leading Companies, 2023
Table 3 Product Offerings of Leading Companies
Table 4 Low Growth Scenario Forecasts
Table 5 Reference Case Growth Scenario
Table 6 High Growth Case Scenario
Table 7 Global Grain Analysis Revenue (USD Million) And CAGR (%) By Type (2021-2032)
Table 8 Global Grain Analysis Revenue (USD Million) And CAGR (%) By Application (2021-2032)
Table 9 Global Grain Analysis Revenue (USD Million) And CAGR (%) By Product (2021-2032)
Table 10 Global Grain Analysis Market Revenue (USD Million) By Regions (2021-2032)
Table 11 Global Grain Analysis Market Share (%) By Regions (2021-2032)
Table 12 North America Grain Analysis Revenue (USD Million) By Country (2021-2032)
Table 13 Europe Grain Analysis Revenue (USD Million) By Country (2021-2032)
Table 14 Asia Pacific Grain Analysis Revenue (USD Million) By Country (2021-2032)
Table 15 South America Grain Analysis Revenue (USD Million) By Country (2021-2032)
Table 16 Middle East and Africa Grain Analysis Revenue (USD Million) By Region (2021-2032)
Table 17 North America Grain Analysis Revenue (USD Million) By Type (2021-2032)
Table 18 North America Grain Analysis Revenue (USD Million) By Application (2021-2032)
Table 19 North America Grain Analysis Revenue (USD Million) By Product (2021-2032)
Table 20 Europe Grain Analysis Revenue (USD Million) By Type (2021-2032)
Table 21 Europe Grain Analysis Revenue (USD Million) By Application (2021-2032)
Table 22 Europe Grain Analysis Revenue (USD Million) By Product (2021-2032)
Table 23 Asia Pacific Grain Analysis Revenue (USD Million) By Type (2021-2032)
Table 24 Asia Pacific Grain Analysis Revenue (USD Million) By Application (2021-2032)
Table 25 Asia Pacific Grain Analysis Revenue (USD Million) By Product (2021-2032)
Table 26 South America Grain Analysis Revenue (USD Million) By Type (2021-2032)
Table 27 South America Grain Analysis Revenue (USD Million) By Application (2021-2032)
Table 28 South America Grain Analysis Revenue (USD Million) By Product (2021-2032)
Table 29 Middle East and Africa Grain Analysis Revenue (USD Million) By Type (2021-2032)
Table 30 Middle East and Africa Grain Analysis Revenue (USD Million) By Application (2021-2032)
Table 31 Middle East and Africa Grain Analysis Revenue (USD Million) By Product (2021-2032)
LIST OF FIGURES
Figure 1. Market Scope
Figure 2. Pricing Forecasts Per Unit, 2023- 2032
Figure 3. Porter’s Five Forces
Figure 4. Global Grain Analysis Market Revenue (USD Million) By Regions (2021-2032)
Figure 5. Global Grain Analysis Market Share (%) By Regions (2023)
Figure 6. North America Grain Analysis Revenue (USD Million) By Country (2021-2032)
Figure 7. United States Grain Analysis Revenue (USD Million) By Country (2021-2032)
Figure 8. Canada Grain Analysis Revenue (USD Million) By Country (2021-2032)
Figure 9. Mexico Grain Analysis Revenue (USD Million) By Country (2021-2032)
Figure 10. Europe Grain Analysis Revenue (USD Million) By Country (2021-2032)
Figure 11. Germany Grain Analysis Revenue (USD Million) By Country (2021-2032)
Figure 12. France Grain Analysis Revenue (USD Million) By Country (2021-2032)
Figure 13. United Kingdom Grain Analysis Revenue (USD Million) By Country (2021-2032)
Figure 14. Spain Grain Analysis Revenue (USD Million) By Country (2021-2032)
Figure 15. Italy Grain Analysis Revenue (USD Million) By Country (2021-2032)
Figure 16. Russia Grain Analysis Revenue (USD Million) By Country (2021-2032)
Figure 17. Rest of Europe Grain Analysis Revenue (USD Million) By Country (2021-2032)
Figure 11. Asia Pacific Grain Analysis Revenue (USD Million) By Country (2021-2032)
Figure 12. China Grain Analysis Revenue (USD Million) By Country (2021-2032)
Figure 13. Japan Grain Analysis Revenue (USD Million) By Country (2021-2032)
Figure 14. India Grain Analysis Revenue (USD Million) By Country (2021-2032)
Figure 15. South Korea Grain Analysis Revenue (USD Million) By Country (2021-2032)
Figure 16. Australia Grain Analysis Revenue (USD Million) By Country (2021-2032)
Figure 17. South East Asia Grain Analysis Revenue (USD Million) By Country (2021-2032)
Figure 18. South America Grain Analysis Revenue (USD Million) By Country (2021-2032)
Figure 19. Brazil Grain Analysis Revenue (USD Million) By Country (2021-2032)
Figure 20. Argentina Grain Analysis Revenue (USD Million) By Country (2021-2032)
Figure 21. Rest of Asia Pacific Grain Analysis Revenue (USD Million) By Country (2021-2032)
Figure 22. Middle East and Africa Grain Analysis Revenue (USD Million) By Region (2021-2032)
Figure 23. Saudi Arabia Grain Analysis Revenue (USD Million) By Region (2021-2032)
Figure 24. The UAE Grain Analysis Revenue (USD Million) By Region (2021-2032)
Figure 25. Rest of Middle East Grain Analysis Revenue (USD Million) By Region (2021-2032)
Figure 26. South Africa Grain Analysis Revenue (USD Million) By Region (2021-2032)
Figure 27. Africa Grain Analysis Revenue (USD Million) By Region (2021-2032)
Figure 28. North America Grain Analysis Revenue (USD Million) By Type (2021-2032)
Figure 29. North America Grain Analysis Revenue (USD Million) By Application (2021-2032)
Figure 30. North America Grain Analysis Revenue (USD Million) By Product (2021-2032)
Figure 31. Europe Grain Analysis Revenue (USD Million) By Type (2021-2032)
Figure 32. Europe Grain Analysis Revenue (USD Million) By Application (2021-2032)
Figure 33. Europe Grain Analysis Revenue (USD Million) By Product (2021-2032)
Figure 34. Asia Pacific Grain Analysis Revenue (USD Million) By Type (2021-2032)
Figure 35. Asia Pacific Grain Analysis Revenue (USD Million) By Application (2021-2032)
Figure 36. Asia Pacific Grain Analysis Revenue (USD Million) By Product (2021-2032)
Figure 37. South America Grain Analysis Revenue (USD Million) By Type (2021-2032)
Figure 38. South America Grain Analysis Revenue (USD Million) By Application (2021-2032)
Figure 39. South America Grain Analysis Revenue (USD Million) By Product (2021-2032)
Figure 40. Middle East and Africa Grain Analysis Revenue (USD Million) By Type (2021-2032)
Figure 41. Middle East and Africa Grain Analysis Revenue (USD Million) By Application (2021-2032)
Figure 42. Middle East and Africa Grain Analysis Revenue (USD Million) By Product (2021-2032)
By Type
Cereals
Oilseeds
Pulses
By Target Tested
Pathogens
Pesticides
GMOs
Mycotoxin
Others
By Technology
Traditional
Rapid
By End-User
Food
Feed
By Component
Instruments
Consumables & reagents
Reference materials
Countries Analyzed
North America (US, Canada, Mexico)
Europe (Germany, UK, France, Spain, Italy, Russia, Rest of Europe)
Asia Pacific (China, India, Japan, South Korea, Australia, South East Asia, Rest of Asia)
South America (Brazil, Argentina, Rest of South America)
Middle East and Africa (Saudi Arabia, UAE, Rest of Middle East, South Africa, Egypt, Rest of Africa)
