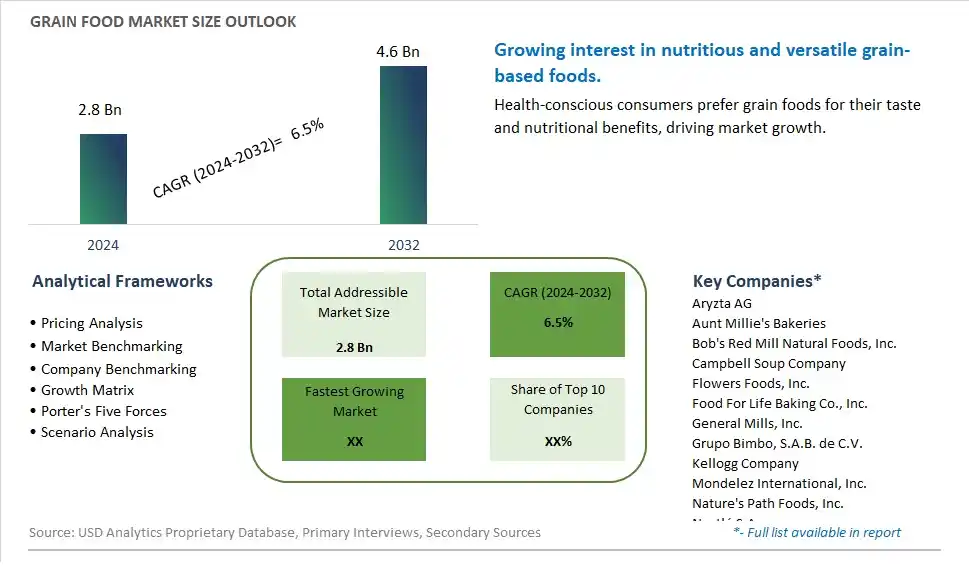
Global Grain Food Market Size is valued at $2.8 Billion in 2024 and is forecast to register a growth rate (CAGR) of 6.5% to reach $4.6 Billion by 2032.
The global Grain Food Market Comprehensive Study analyzes and forecasts the market size across 6 regions and 24 countries for diverse segments -By Type (Baking, Pasta, Dessert, Others), By Sales Channel (Online, Offline)
An Introduction to Grain Food Market
In 2024, the Grain Food market is thriving, fueled by the rising demand for diverse and nutritious grain-based products. Grain foods, including cereals, breads, and snacks, are staples in many diets and offer various health benefits. The market benefits from advancements in grain processing and fortification technologies, the growing trend of health-conscious and plant-based diets, and the expansion of the global food sector. Additionally, the increasing focus on ancient and whole grains for their nutritional value and sustainability is contributing to market growth.
Grain Food Competitive Landscape
The market report analyses the leading companies in the industry including Aryzta AG, Aunt Millie's Bakeries, Bob's Red Mill Natural Foods, Inc., Campbell Soup Company, Flowers Foods, Inc., Food For Life Baking Co., Inc., General Mills, Inc., Grupo Bimbo, S.A.B. de C.V., Kellogg Company, Mondelez International, Inc., Nature's Path Foods, Inc., Nestlé S.A., PepsiCo, Inc., and Others.
Grain Food Market Dynamics
Grain Food Market Trend: Increasing Demand for Diverse Grain-Based Foods
The most prominent trend in the Grain Food Market is the increasing demand for diverse grain-based foods. As consumers seek to incorporate a variety of grains into their diets, products made from quinoa, millet, barley, and other grains are gaining popularity. This trend is driven by the growing interest in whole foods and the desire for diverse and nutritious dietary options.
Grain Food Market Driver: Growth in Health and Wellness Consciousness
The key driver of the Grain Food Market is the growth in health and wellness consciousness. As more people focus on maintaining a balanced diet, there is a higher demand for grain-based foods that offer essential nutrients and health benefits. This driver is supported by the trend towards functional foods and the increasing awareness of the nutritional value of different grains, driving market growth.
Grain Food Market Opportunity: Innovation in Grain-Based Product Development
A significant opportunity in the Grain Food Market lies in innovation in grain-based product development. By creating new and unique grain-based foods, such as ready-to-eat meals, snacks, and breakfast cereals, companies can attract health-conscious consumers looking for convenient and nutritious options. Offering high-quality grain products that cater to diverse dietary preferences and health needs can help expand market reach and drive growth in the grain food sector.
Grain Food Market Share Analysis: Baking segment generated the highest revenue share in the industry
In the Grain Food Market, the largest segment by type is Baking. Baking encompasses a wide range of grain-based products such as bread, pastries, cakes, and cookies. These products are staples in households and bakeries worldwide, driven by their versatility, convenience, and cultural significance. Baking with grains like wheat, barley, oats, and rye not only provides sustenance but also forms an integral part of culinary traditions across various cultures. The popularity of baking as a segment is sustained by consumer demand for fresh, wholesome baked goods that cater to diverse tastes and dietary preferences.
Grain Food Market Share Analysis: Online Sales is the fastest growing segment over the forecast period to 2032
Among the sales channels in the Grain Food Market, the fastest-growing segment to 2032 is Online Sales. The shift towards online platforms for purchasing grain-based foods reflects broader trends in consumer behavior, driven by convenience, accessibility, and digitalization. Online sales offer consumers a convenient way to access a wide variety of grain foods, from specialty items to everyday staples, without the constraints of physical store locations. This trend is bolstered by the proliferation of e-commerce platforms, improved logistics, and increasing consumer trust in online transactions. Further, the Past few yearsaccelerated the adoption of online shopping for groceries and food products, further propelling the growth of online sales in the grain food market. As digital platforms continue to evolve and consumer preferences shift towards convenience-driven shopping experiences, online sales are poised to expand significantly, reshaping the landscape of grain food distribution.
Grain Food Market Segmentation
By Type
Baking
Pasta
Dessert
Others
By Sales Channel
Online
Offline
Countries Analyzed
North America (US, Canada, Mexico)
Europe (Germany, UK, France, Spain, Italy, Russia, Rest of Europe)
Asia Pacific (China, India, Japan, South Korea, Australia, South East Asia, Rest of Asia)
South America (Brazil, Argentina, Rest of South America)
Middle East and Africa (Saudi Arabia, UAE, Rest of Middle East, South Africa, Egypt, Rest of Africa)
Grain Food Companies Profiled in the Study
Aryzta AG
Aunt Millie's Bakeries
Bob's Red Mill Natural Foods, Inc.
Campbell Soup Company
Flowers Foods, Inc.
Food For Life Baking Co., Inc.
General Mills, Inc.
Grupo Bimbo, S.A.B. de C.V.
Kellogg Company
Mondelez International, Inc.
Nature's Path Foods, Inc.
Nestlé S.A.
PepsiCo, Inc.
*- List Not Exhaustive
Chapter 1. TABLE OF CONTENTS
Chapter 2. Introduction to Grain Food Market
2.1. Market Overview
2.2. Key Statistics and Report Highlights
2.3. Scope of the Comprehensive Study
2.3.1. Market Definition
2.3.2 Countries and Regions Covered
2.3.3 Research Objective
2.3.4 Units, Currency, and Conversions
2.3.5 Industry Value Chain
2.4. Key Market Segments
2.5. Key Companies
2.6. Study Period
Chapter 3. Strategic Analysis Review
3.1. Grain Food Pricing Analysis and Forecast
3.2. Porter’s Five Forces
3.3. Market Ecosystem
3.4. SWOT Analysis
3.5. Regulatory Scenario
3.3. Effects of Inflation, Russia-Ukraine War, moderating economic growth, and other macroeconomic factors
Chapter 4. Competitive Landscape
4.1. Market Share Analysis
4.1.1. Global Grain Food Market Share by Company, 2023
4.1.2. Product Offerings of Leading Grain Food Companies
4.2. Market Entropy
4.2.1. New Product Launches in the Industry
4.2.2. Mergers, Acquisitions, Joint ventures, and Partnerships
4.3. Key Strategies and Best Practices
Chapter 5. Global Market Projections: Best, Reference, and Low Case Scenarios
5.1. Growth Analysis- Case Scenario Definitions
5.2. Low Growth Case Scenario Forecasts
5.3. Reference Growth Case Scenario Forecasts
5.4. High Growth Case Scenario Forecasts
Chapter 6. Market Dynamics
6.1. Grain Food Market Drivers
6.2. Grain Food Market Challenges
6.6. Grain Food Market Opportunities
6.4. Grain Food Market Trends
Chapter 7. Global Grain Food Market Outlook Trends
7.1. Global Grain Food Revenue (USD Million) and CAGR (%) by Type (2021-2032)
7.2. Global Grain Food Revenue (USD Million) and CAGR (%) by Application (2021-2032)
7.3. Global Grain Food Revenue (USD Million) and CAGR (%) by Product (2021-2032)
By Type
Baking
Pasta
Dessert
Others
By Sales Channel
Online
Offline
Chapter 8. Global Grain Food Regional Analysis and Outlook
8.1. Global Grain Food Revenue (USD Million) By Regions (2021- 2032)
8.2. North America Grain Food Revenue (USD Million) by Country (2021-2032)
8.2.1. United States Grain Food Regional Analysis and Outlook
8.2.2. Canada Grain Food Regional Analysis and Outlook
8.2.3. Mexico Grain Food Regional Analysis and Outlook
8.3. Europe Grain Food Revenue (USD Million), by Country (2021-2032)
8.3.1. Germany Grain Food Regional Analysis and Outlook
8.3.2. France Grain Food Regional Analysis and Outlook
8.3.3. United Kingdom Grain Food Regional Analysis and Outlook
8.3.4. Spain Grain Food Regional Analysis and Outlook
8.3.5. Italy Grain Food Regional Analysis and Outlook
8.3.6. Russia Grain Food Regional Analysis and Outlook
8.3.7. Rest of Europe Grain Food Regional Analysis and Outlook
8.4. Asia Pacific Grain Food Revenue (USD Million) by Country (2021-2032)
8.4.1. China Grain Food Regional Analysis and Outlook
8.4.2. Japan Grain Food Regional Analysis and Outlook
8.4.3. India Grain Food Regional Analysis and Outlook
8.4.4. South Korea Grain Food Regional Analysis and Outlook
8.4.5. Australia Grain Food Regional Analysis and Outlook
8.4.6. South East Asia Grain Food Regional Analysis and Outlook
8.4.7. Rest of Asia Pacific Grain Food Regional Analysis and Outlook
8.5. South America Grain Food Revenue (USD Million), by Country (2021-2032)
8.5.1. Brazil Grain Food Regional Analysis and Outlook
8.5.2. Argentina Grain Food Regional Analysis and Outlook
8.5.3. Rest of South America Grain Food Regional Analysis and Outlook
8.6. Middle East and Africa Grain Food Revenue (USD Million) by Country (2021-2032)
8.6.1. Middle East Grain Food Regional Analysis and Outlook
8.6.2. Africa Grain Food Regional Analysis and Outlook
Chapter 9. North America Grain Food Analysis and Outlook
9.1. North America Grain Food Revenue (USD Million) by Segments (2021-2032)
9.1.1. North America Grain Food Revenue (USD Million) by Type (2021-2032)
9.1.2. North America Grain Food Revenue (USD Million) by Application (2021-2032)
9.1.3. North America Grain Food Revenue (USD Million) by Product (2021-2032)
By Type
Baking
Pasta
Dessert
Others
By Sales Channel
Online
Offline
Chapter 10. Europe Grain Food Analysis and Outlook
10.1. Europe Grain Food Revenue (USD Million), by Segments (USD Million) (2021-2032)
10.1.1. Europe Grain Food Revenue (USD Million) by Type (2021-2032)
10.1.2. Europe Grain Food Revenue (USD Million) by Application (2021-2032)
10.1.3. Europe Grain Food Revenue (USD Million) by Product (2021-2032)
By Type
Baking
Pasta
Dessert
Others
By Sales Channel
Online
Offline
Chapter 11. Asia Pacific Grain Food Analysis and Outlook
11.1. Asia Pacific Grain Food Revenue (USD Million), and Revenue (USD Million) by Segments (2021-2032)
11.1.1. Asia Pacific Grain Food Revenue (USD Million) by Type (2021-2032)
11.1.2. Asia Pacific Grain Food Revenue (USD Million) by Application (2021-2032)
11.1.3. Asia Pacific Grain Food Revenue (USD Million) by Product (2021-2032)
By Type
Baking
Pasta
Dessert
Others
By Sales Channel
Online
Offline
Chapter 12. South America Grain Food Analysis and Outlook
12.1. South America Grain Food Revenue (USD Million), by Segments (2021-2032)
12.1.1. South America Grain Food Revenue (USD Million) by Type (2021-2032)
12.1.2. South America Grain Food Revenue (USD Million) by Application (2021-2032)
12.1.3. South America Grain Food Revenue (USD Million) by Product (2021-2032)
By Type
Baking
Pasta
Dessert
Others
By Sales Channel
Online
Offline
Chapter 13. Middle East and Africa Grain Food Analysis and Outlook
13.1. Middle East and Africa Grain Food Revenue (USD Million), by Segments (2021-2032)
13.1.1. Middle East and Africa Grain Food Revenue (USD Million) by Type (2021-2032)
13.1.2. Middle East and Africa Grain Food Revenue (USD Million) by Application (2021-2032)
13.1.3. Middle East and Africa Grain Food Revenue (USD Million) by Product (2021-2032)
By Type
Baking
Pasta
Dessert
Others
By Sales Channel
Online
Offline
Chapter 14. Grain Food Company Profiles
14.1 Business Overview
14.2 Product Profiles
14.3 SWOT Profiles
14.5 Recent Developments
14.6 Financial Profile
List of Companies
Aryzta AG
Aunt Millie's Bakeries
Bob's Red Mill Natural Foods, Inc.
Campbell Soup Company
Flowers Foods, Inc.
Food For Life Baking Co., Inc.
General Mills, Inc.
Grupo Bimbo, S.A.B. de C.V.
Kellogg Company
Mondelez International, Inc.
Nature's Path Foods, Inc.
Nestlé S.A.
PepsiCo, Inc.
15. Methodology and Data Sources
15.1 Customization Offerings
15.2 Subscription Services
15.3 Related Reports
15.4 Publisher Expertise
LIST OF TABLES
Table 1 Market Segmentation Analysis
Table 2 Global Grain Food Market Share of Leading Companies, 2023
Table 3 Product Offerings of Leading Companies
Table 4 Low Growth Scenario Forecasts
Table 5 Reference Case Growth Scenario
Table 6 High Growth Case Scenario
Table 7 Global Grain Food Revenue (USD Million) And CAGR (%) By Type (2021-2032)
Table 8 Global Grain Food Revenue (USD Million) And CAGR (%) By Application (2021-2032)
Table 9 Global Grain Food Revenue (USD Million) And CAGR (%) By Product (2021-2032)
Table 10 Global Grain Food Market Revenue (USD Million) By Regions (2021-2032)
Table 11 Global Grain Food Market Share (%) By Regions (2021-2032)
Table 12 North America Grain Food Revenue (USD Million) By Country (2021-2032)
Table 13 Europe Grain Food Revenue (USD Million) By Country (2021-2032)
Table 14 Asia Pacific Grain Food Revenue (USD Million) By Country (2021-2032)
Table 15 South America Grain Food Revenue (USD Million) By Country (2021-2032)
Table 16 Middle East and Africa Grain Food Revenue (USD Million) By Region (2021-2032)
Table 17 North America Grain Food Revenue (USD Million) By Type (2021-2032)
Table 18 North America Grain Food Revenue (USD Million) By Application (2021-2032)
Table 19 North America Grain Food Revenue (USD Million) By Product (2021-2032)
Table 20 Europe Grain Food Revenue (USD Million) By Type (2021-2032)
Table 21 Europe Grain Food Revenue (USD Million) By Application (2021-2032)
Table 22 Europe Grain Food Revenue (USD Million) By Product (2021-2032)
Table 23 Asia Pacific Grain Food Revenue (USD Million) By Type (2021-2032)
Table 24 Asia Pacific Grain Food Revenue (USD Million) By Application (2021-2032)
Table 25 Asia Pacific Grain Food Revenue (USD Million) By Product (2021-2032)
Table 26 South America Grain Food Revenue (USD Million) By Type (2021-2032)
Table 27 South America Grain Food Revenue (USD Million) By Application (2021-2032)
Table 28 South America Grain Food Revenue (USD Million) By Product (2021-2032)
Table 29 Middle East and Africa Grain Food Revenue (USD Million) By Type (2021-2032)
Table 30 Middle East and Africa Grain Food Revenue (USD Million) By Application (2021-2032)
Table 31 Middle East and Africa Grain Food Revenue (USD Million) By Product (2021-2032)
LIST OF FIGURES
Figure 1. Market Scope
Figure 2. Pricing Forecasts Per Unit, 2023- 2032
Figure 3. Porter’s Five Forces
Figure 4. Global Grain Food Market Revenue (USD Million) By Regions (2021-2032)
Figure 5. Global Grain Food Market Share (%) By Regions (2023)
Figure 6. North America Grain Food Revenue (USD Million) By Country (2021-2032)
Figure 7. United States Grain Food Revenue (USD Million) By Country (2021-2032)
Figure 8. Canada Grain Food Revenue (USD Million) By Country (2021-2032)
Figure 9. Mexico Grain Food Revenue (USD Million) By Country (2021-2032)
Figure 10. Europe Grain Food Revenue (USD Million) By Country (2021-2032)
Figure 11. Germany Grain Food Revenue (USD Million) By Country (2021-2032)
Figure 12. France Grain Food Revenue (USD Million) By Country (2021-2032)
Figure 13. United Kingdom Grain Food Revenue (USD Million) By Country (2021-2032)
Figure 14. Spain Grain Food Revenue (USD Million) By Country (2021-2032)
Figure 15. Italy Grain Food Revenue (USD Million) By Country (2021-2032)
Figure 16. Russia Grain Food Revenue (USD Million) By Country (2021-2032)
Figure 17. Rest of Europe Grain Food Revenue (USD Million) By Country (2021-2032)
Figure 11. Asia Pacific Grain Food Revenue (USD Million) By Country (2021-2032)
Figure 12. China Grain Food Revenue (USD Million) By Country (2021-2032)
Figure 13. Japan Grain Food Revenue (USD Million) By Country (2021-2032)
Figure 14. India Grain Food Revenue (USD Million) By Country (2021-2032)
Figure 15. South Korea Grain Food Revenue (USD Million) By Country (2021-2032)
Figure 16. Australia Grain Food Revenue (USD Million) By Country (2021-2032)
Figure 17. South East Asia Grain Food Revenue (USD Million) By Country (2021-2032)
Figure 18. South America Grain Food Revenue (USD Million) By Country (2021-2032)
Figure 19. Brazil Grain Food Revenue (USD Million) By Country (2021-2032)
Figure 20. Argentina Grain Food Revenue (USD Million) By Country (2021-2032)
Figure 21. Rest of Asia Pacific Grain Food Revenue (USD Million) By Country (2021-2032)
Figure 22. Middle East and Africa Grain Food Revenue (USD Million) By Region (2021-2032)
Figure 23. Saudi Arabia Grain Food Revenue (USD Million) By Region (2021-2032)
Figure 24. The UAE Grain Food Revenue (USD Million) By Region (2021-2032)
Figure 25. Rest of Middle East Grain Food Revenue (USD Million) By Region (2021-2032)
Figure 26. South Africa Grain Food Revenue (USD Million) By Region (2021-2032)
Figure 27. Africa Grain Food Revenue (USD Million) By Region (2021-2032)
Figure 28. North America Grain Food Revenue (USD Million) By Type (2021-2032)
Figure 29. North America Grain Food Revenue (USD Million) By Application (2021-2032)
Figure 30. North America Grain Food Revenue (USD Million) By Product (2021-2032)
Figure 31. Europe Grain Food Revenue (USD Million) By Type (2021-2032)
Figure 32. Europe Grain Food Revenue (USD Million) By Application (2021-2032)
Figure 33. Europe Grain Food Revenue (USD Million) By Product (2021-2032)
Figure 34. Asia Pacific Grain Food Revenue (USD Million) By Type (2021-2032)
Figure 35. Asia Pacific Grain Food Revenue (USD Million) By Application (2021-2032)
Figure 36. Asia Pacific Grain Food Revenue (USD Million) By Product (2021-2032)
Figure 37. South America Grain Food Revenue (USD Million) By Type (2021-2032)
Figure 38. South America Grain Food Revenue (USD Million) By Application (2021-2032)
Figure 39. South America Grain Food Revenue (USD Million) By Product (2021-2032)
Figure 40. Middle East and Africa Grain Food Revenue (USD Million) By Type (2021-2032)
Figure 41. Middle East and Africa Grain Food Revenue (USD Million) By Application (2021-2032)
Figure 42. Middle East and Africa Grain Food Revenue (USD Million) By Product (2021-2032)
By Type
Baking
Pasta
Dessert
Others
By Sales Channel
Online
Offline
Countries Analyzed
North America (US, Canada, Mexico)
Europe (Germany, UK, France, Spain, Italy, Russia, Rest of Europe)
Asia Pacific (China, India, Japan, South Korea, Australia, South East Asia, Rest of Asia)
South America (Brazil, Argentina, Rest of South America)
Middle East and Africa (Saudi Arabia, UAE, Rest of Middle East, South Africa, Egypt, Rest of Africa)
