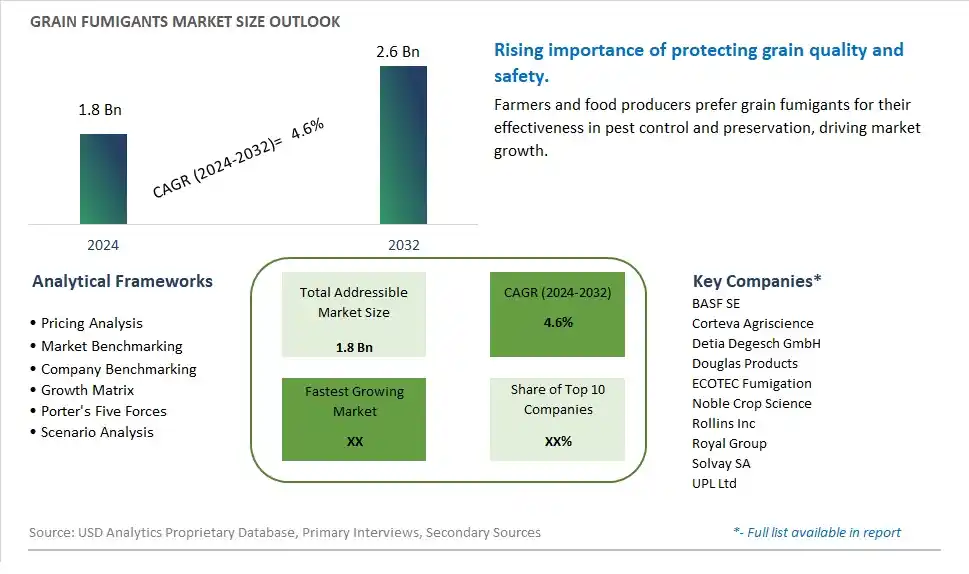
Global Grain Fumigants Market Size is valued at $1.8 Billion in 2024 and is forecast to register a growth rate (CAGR) of 4.6% to reach $2.6 Billion by 2032.
The global Grain Fumigants Market Comprehensive Study analyzes and forecasts the market size across 6 regions and 24 countries for diverse segments -By Product (Phosphine, Sulfuryl Fluoride, Methyl Bromide, Others), By Form (Solid, Liquid, Gas), By Application (Commercial, Residential)
An Introduction to Grain Fumigants Market
The Grain Fumigants market in 2024 is experiencing significant growth, driven by the rising demand for effective pest control solutions in grain storage and transport. Grain fumigants, used to protect stored grains from insect infestations and spoilage, are essential in maintaining food quality and safety. The market benefits from advancements in fumigation technologies and chemical formulations, the growing trend of food security and safety, and the expansion of the global agricultural sector. Additionally, the increasing focus on sustainable and environmentally friendly fumigants is contributing to market growth.
Grain Fumigants Competitive Landscape
The market report analyses the leading companies in the industry including BASF SE, Corteva Agriscience, Detia Degesch GmbH, Douglas Products, ECOTEC Fumigation, Noble Crop Science, Rollins Inc, Royal Group, Solvay SA, UPL Ltd, and Others.
Grain Fumigants Market Dynamics
Grain Fumigants Market Trend: Increasing Use of Advanced Fumigation Techniques
The most prominent trend in the Grain Fumigants Market is the increasing use of advanced fumigation techniques. As the agriculture industry seeks to improve pest control and grain preservation, advanced fumigants are gaining popularity for their effectiveness and safety. This trend is driven by the need for efficient pest management solutions that ensure grain quality and safety.
Grain Fumigants Market Driver: Growth in Global Grain Production
The key driver of the Grain Fumigants Market is the growth in global grain production. As more countries focus on increasing their agricultural output to meet the rising demand for food, there is a higher need for effective grain fumigation to protect crops from pests and contamination. This driver is supported by the trend towards sustainable agriculture and the increasing emphasis on food security, driving market growth for grain fumigants.
Grain Fumigants Market Opportunity: Development of Eco-Friendly Fumigants
A significant opportunity in the Grain Fumigants Market lies in the development of eco-friendly fumigants. By creating fumigants that offer effective pest control with minimal environmental impact, companies can meet the growing demand for sustainable agricultural practices. Offering innovative and safe fumigant solutions that align with environmental regulations and sustainability goals can help expand market reach and drive growth in the agricultural sector.
Grain Fumigants Market Share Analysis: Phosphine segment generated the highest revenue share in the industry
In the Grain Fumigants Market, the largest segment by product is Phosphine. Phosphine-based fumigants are widely used in the agricultural sector for grain fumigation due to their effectiveness against a broad spectrum of pests, including insects, larvae, and eggs. Phosphine fumigants are preferred for their ease of application, cost-effectiveness, and ability to penetrate deep into stored grains, ensuring thorough pest control and preservation of grain quality. These fumigants are commonly used in various grain storage facilities, including commercial silos and warehouses, where they help prevent infestations and maintain grain hygiene throughout storage periods. The dominance of phosphine in the grain fumigants market underscores its established reputation as a reliable solution for pest management in grain handling and storage operations.
Grain Fumigants Market Share Analysis: Gas Form is the fastest growing segment over the forecast period to 2032
The fastest-growing segment in the Grain Fumigants Market by form is Gas. Gas-form fumigants, including phosphine, sulfuryl fluoride, and methyl bromide, are witnessing increasing adoption due to their effectiveness, minimal residue, and ease of application compared to solid and liquid forms. Gas fumigants offer advantages such as uniform distribution within grain storage facilities, reaching inaccessible areas, and penetrating deep into grain masses to eradicate pests comprehensively. With advancements in fumigation technologies and increasing regulatory approvals for safe use, gas-form fumigants are expected to continue expanding their market presence, particularly in commercial grain storage applications where comprehensive pest control measures are crucial for maintaining grain quality and market compliance.
Grain Fumigants Market Segmentation
By Product
Phosphine
Sulfuryl Fluoride
Methyl Bromide
Others
By Form
Solid
Liquid
Gas
By Application
Commercial
Residential
Countries Analyzed
North America (US, Canada, Mexico)
Europe (Germany, UK, France, Spain, Italy, Russia, Rest of Europe)
Asia Pacific (China, India, Japan, South Korea, Australia, South East Asia, Rest of Asia)
South America (Brazil, Argentina, Rest of South America)
Middle East and Africa (Saudi Arabia, UAE, Rest of Middle East, South Africa, Egypt, Rest of Africa)
Grain Fumigants Companies Profiled in the Study
BASF SE
Corteva Agriscience
Detia Degesch GmbH
Douglas Products
ECOTEC Fumigation
Noble Crop Science
Rollins Inc
Royal Group
Solvay SA
UPL Ltd
*- List Not Exhaustive
Chapter 1. TABLE OF CONTENTS
Chapter 2. Introduction to Grain Fumigants Market
2.1. Market Overview
2.2. Key Statistics and Report Highlights
2.3. Scope of the Comprehensive Study
2.3.1. Market Definition
2.3.2 Countries and Regions Covered
2.3.3 Research Objective
2.3.4 Units, Currency, and Conversions
2.3.5 Industry Value Chain
2.4. Key Market Segments
2.5. Key Companies
2.6. Study Period
Chapter 3. Strategic Analysis Review
3.1. Grain Fumigants Pricing Analysis and Forecast
3.2. Porter’s Five Forces
3.3. Market Ecosystem
3.4. SWOT Analysis
3.5. Regulatory Scenario
3.3. Effects of Inflation, Russia-Ukraine War, moderating economic growth, and other macroeconomic factors
Chapter 4. Competitive Landscape
4.1. Market Share Analysis
4.1.1. Global Grain Fumigants Market Share by Company, 2023
4.1.2. Product Offerings of Leading Grain Fumigants Companies
4.2. Market Entropy
4.2.1. New Product Launches in the Industry
4.2.2. Mergers, Acquisitions, Joint ventures, and Partnerships
4.3. Key Strategies and Best Practices
Chapter 5. Global Market Projections: Best, Reference, and Low Case Scenarios
5.1. Growth Analysis- Case Scenario Definitions
5.2. Low Growth Case Scenario Forecasts
5.3. Reference Growth Case Scenario Forecasts
5.4. High Growth Case Scenario Forecasts
Chapter 6. Market Dynamics
6.1. Grain Fumigants Market Drivers
6.2. Grain Fumigants Market Challenges
6.6. Grain Fumigants Market Opportunities
6.4. Grain Fumigants Market Trends
Chapter 7. Global Grain Fumigants Market Outlook Trends
7.1. Global Grain Fumigants Revenue (USD Million) and CAGR (%) by Type (2021-2032)
7.2. Global Grain Fumigants Revenue (USD Million) and CAGR (%) by Application (2021-2032)
7.3. Global Grain Fumigants Revenue (USD Million) and CAGR (%) by Product (2021-2032)
By Product
Phosphine
Sulfuryl Fluoride
Methyl Bromide
Others
By Form
Solid
Liquid
Gas
By Application
Commercial
Residential
Chapter 8. Global Grain Fumigants Regional Analysis and Outlook
8.1. Global Grain Fumigants Revenue (USD Million) By Regions (2021- 2032)
8.2. North America Grain Fumigants Revenue (USD Million) by Country (2021-2032)
8.2.1. United States Grain Fumigants Regional Analysis and Outlook
8.2.2. Canada Grain Fumigants Regional Analysis and Outlook
8.2.3. Mexico Grain Fumigants Regional Analysis and Outlook
8.3. Europe Grain Fumigants Revenue (USD Million), by Country (2021-2032)
8.3.1. Germany Grain Fumigants Regional Analysis and Outlook
8.3.2. France Grain Fumigants Regional Analysis and Outlook
8.3.3. United Kingdom Grain Fumigants Regional Analysis and Outlook
8.3.4. Spain Grain Fumigants Regional Analysis and Outlook
8.3.5. Italy Grain Fumigants Regional Analysis and Outlook
8.3.6. Russia Grain Fumigants Regional Analysis and Outlook
8.3.7. Rest of Europe Grain Fumigants Regional Analysis and Outlook
8.4. Asia Pacific Grain Fumigants Revenue (USD Million) by Country (2021-2032)
8.4.1. China Grain Fumigants Regional Analysis and Outlook
8.4.2. Japan Grain Fumigants Regional Analysis and Outlook
8.4.3. India Grain Fumigants Regional Analysis and Outlook
8.4.4. South Korea Grain Fumigants Regional Analysis and Outlook
8.4.5. Australia Grain Fumigants Regional Analysis and Outlook
8.4.6. South East Asia Grain Fumigants Regional Analysis and Outlook
8.4.7. Rest of Asia Pacific Grain Fumigants Regional Analysis and Outlook
8.5. South America Grain Fumigants Revenue (USD Million), by Country (2021-2032)
8.5.1. Brazil Grain Fumigants Regional Analysis and Outlook
8.5.2. Argentina Grain Fumigants Regional Analysis and Outlook
8.5.3. Rest of South America Grain Fumigants Regional Analysis and Outlook
8.6. Middle East and Africa Grain Fumigants Revenue (USD Million) by Country (2021-2032)
8.6.1. Middle East Grain Fumigants Regional Analysis and Outlook
8.6.2. Africa Grain Fumigants Regional Analysis and Outlook
Chapter 9. North America Grain Fumigants Analysis and Outlook
9.1. North America Grain Fumigants Revenue (USD Million) by Segments (2021-2032)
9.1.1. North America Grain Fumigants Revenue (USD Million) by Type (2021-2032)
9.1.2. North America Grain Fumigants Revenue (USD Million) by Application (2021-2032)
9.1.3. North America Grain Fumigants Revenue (USD Million) by Product (2021-2032)
By Product
Phosphine
Sulfuryl Fluoride
Methyl Bromide
Others
By Form
Solid
Liquid
Gas
By Application
Commercial
Residential
Chapter 10. Europe Grain Fumigants Analysis and Outlook
10.1. Europe Grain Fumigants Revenue (USD Million), by Segments (USD Million) (2021-2032)
10.1.1. Europe Grain Fumigants Revenue (USD Million) by Type (2021-2032)
10.1.2. Europe Grain Fumigants Revenue (USD Million) by Application (2021-2032)
10.1.3. Europe Grain Fumigants Revenue (USD Million) by Product (2021-2032)
By Product
Phosphine
Sulfuryl Fluoride
Methyl Bromide
Others
By Form
Solid
Liquid
Gas
By Application
Commercial
Residential
Chapter 11. Asia Pacific Grain Fumigants Analysis and Outlook
11.1. Asia Pacific Grain Fumigants Revenue (USD Million), and Revenue (USD Million) by Segments (2021-2032)
11.1.1. Asia Pacific Grain Fumigants Revenue (USD Million) by Type (2021-2032)
11.1.2. Asia Pacific Grain Fumigants Revenue (USD Million) by Application (2021-2032)
11.1.3. Asia Pacific Grain Fumigants Revenue (USD Million) by Product (2021-2032)
By Product
Phosphine
Sulfuryl Fluoride
Methyl Bromide
Others
By Form
Solid
Liquid
Gas
By Application
Commercial
Residential
Chapter 12. South America Grain Fumigants Analysis and Outlook
12.1. South America Grain Fumigants Revenue (USD Million), by Segments (2021-2032)
12.1.1. South America Grain Fumigants Revenue (USD Million) by Type (2021-2032)
12.1.2. South America Grain Fumigants Revenue (USD Million) by Application (2021-2032)
12.1.3. South America Grain Fumigants Revenue (USD Million) by Product (2021-2032)
By Product
Phosphine
Sulfuryl Fluoride
Methyl Bromide
Others
By Form
Solid
Liquid
Gas
By Application
Commercial
Residential
Chapter 13. Middle East and Africa Grain Fumigants Analysis and Outlook
13.1. Middle East and Africa Grain Fumigants Revenue (USD Million), by Segments (2021-2032)
13.1.1. Middle East and Africa Grain Fumigants Revenue (USD Million) by Type (2021-2032)
13.1.2. Middle East and Africa Grain Fumigants Revenue (USD Million) by Application (2021-2032)
13.1.3. Middle East and Africa Grain Fumigants Revenue (USD Million) by Product (2021-2032)
By Product
Phosphine
Sulfuryl Fluoride
Methyl Bromide
Others
By Form
Solid
Liquid
Gas
By Application
Commercial
Residential
Chapter 14. Grain Fumigants Company Profiles
14.1 Business Overview
14.2 Product Profiles
14.3 SWOT Profiles
14.5 Recent Developments
14.6 Financial Profile
List of Companies
BASF SE
Corteva Agriscience
Detia Degesch GmbH
Douglas Products
ECOTEC Fumigation
Noble Crop Science
Rollins Inc
Royal Group
Solvay SA
UPL Ltd
15. Methodology and Data Sources
15.1 Customization Offerings
15.2 Subscription Services
15.3 Related Reports
15.4 Publisher Expertise
LIST OF TABLES
Table 1 Market Segmentation Analysis
Table 2 Global Grain Fumigants Market Share of Leading Companies, 2023
Table 3 Product Offerings of Leading Companies
Table 4 Low Growth Scenario Forecasts
Table 5 Reference Case Growth Scenario
Table 6 High Growth Case Scenario
Table 7 Global Grain Fumigants Revenue (USD Million) And CAGR (%) By Type (2021-2032)
Table 8 Global Grain Fumigants Revenue (USD Million) And CAGR (%) By Application (2021-2032)
Table 9 Global Grain Fumigants Revenue (USD Million) And CAGR (%) By Product (2021-2032)
Table 10 Global Grain Fumigants Market Revenue (USD Million) By Regions (2021-2032)
Table 11 Global Grain Fumigants Market Share (%) By Regions (2021-2032)
Table 12 North America Grain Fumigants Revenue (USD Million) By Country (2021-2032)
Table 13 Europe Grain Fumigants Revenue (USD Million) By Country (2021-2032)
Table 14 Asia Pacific Grain Fumigants Revenue (USD Million) By Country (2021-2032)
Table 15 South America Grain Fumigants Revenue (USD Million) By Country (2021-2032)
Table 16 Middle East and Africa Grain Fumigants Revenue (USD Million) By Region (2021-2032)
Table 17 North America Grain Fumigants Revenue (USD Million) By Type (2021-2032)
Table 18 North America Grain Fumigants Revenue (USD Million) By Application (2021-2032)
Table 19 North America Grain Fumigants Revenue (USD Million) By Product (2021-2032)
Table 20 Europe Grain Fumigants Revenue (USD Million) By Type (2021-2032)
Table 21 Europe Grain Fumigants Revenue (USD Million) By Application (2021-2032)
Table 22 Europe Grain Fumigants Revenue (USD Million) By Product (2021-2032)
Table 23 Asia Pacific Grain Fumigants Revenue (USD Million) By Type (2021-2032)
Table 24 Asia Pacific Grain Fumigants Revenue (USD Million) By Application (2021-2032)
Table 25 Asia Pacific Grain Fumigants Revenue (USD Million) By Product (2021-2032)
Table 26 South America Grain Fumigants Revenue (USD Million) By Type (2021-2032)
Table 27 South America Grain Fumigants Revenue (USD Million) By Application (2021-2032)
Table 28 South America Grain Fumigants Revenue (USD Million) By Product (2021-2032)
Table 29 Middle East and Africa Grain Fumigants Revenue (USD Million) By Type (2021-2032)
Table 30 Middle East and Africa Grain Fumigants Revenue (USD Million) By Application (2021-2032)
Table 31 Middle East and Africa Grain Fumigants Revenue (USD Million) By Product (2021-2032)
LIST OF FIGURES
Figure 1. Market Scope
Figure 2. Pricing Forecasts Per Unit, 2023- 2032
Figure 3. Porter’s Five Forces
Figure 4. Global Grain Fumigants Market Revenue (USD Million) By Regions (2021-2032)
Figure 5. Global Grain Fumigants Market Share (%) By Regions (2023)
Figure 6. North America Grain Fumigants Revenue (USD Million) By Country (2021-2032)
Figure 7. United States Grain Fumigants Revenue (USD Million) By Country (2021-2032)
Figure 8. Canada Grain Fumigants Revenue (USD Million) By Country (2021-2032)
Figure 9. Mexico Grain Fumigants Revenue (USD Million) By Country (2021-2032)
Figure 10. Europe Grain Fumigants Revenue (USD Million) By Country (2021-2032)
Figure 11. Germany Grain Fumigants Revenue (USD Million) By Country (2021-2032)
Figure 12. France Grain Fumigants Revenue (USD Million) By Country (2021-2032)
Figure 13. United Kingdom Grain Fumigants Revenue (USD Million) By Country (2021-2032)
Figure 14. Spain Grain Fumigants Revenue (USD Million) By Country (2021-2032)
Figure 15. Italy Grain Fumigants Revenue (USD Million) By Country (2021-2032)
Figure 16. Russia Grain Fumigants Revenue (USD Million) By Country (2021-2032)
Figure 17. Rest of Europe Grain Fumigants Revenue (USD Million) By Country (2021-2032)
Figure 11. Asia Pacific Grain Fumigants Revenue (USD Million) By Country (2021-2032)
Figure 12. China Grain Fumigants Revenue (USD Million) By Country (2021-2032)
Figure 13. Japan Grain Fumigants Revenue (USD Million) By Country (2021-2032)
Figure 14. India Grain Fumigants Revenue (USD Million) By Country (2021-2032)
Figure 15. South Korea Grain Fumigants Revenue (USD Million) By Country (2021-2032)
Figure 16. Australia Grain Fumigants Revenue (USD Million) By Country (2021-2032)
Figure 17. South East Asia Grain Fumigants Revenue (USD Million) By Country (2021-2032)
Figure 18. South America Grain Fumigants Revenue (USD Million) By Country (2021-2032)
Figure 19. Brazil Grain Fumigants Revenue (USD Million) By Country (2021-2032)
Figure 20. Argentina Grain Fumigants Revenue (USD Million) By Country (2021-2032)
Figure 21. Rest of Asia Pacific Grain Fumigants Revenue (USD Million) By Country (2021-2032)
Figure 22. Middle East and Africa Grain Fumigants Revenue (USD Million) By Region (2021-2032)
Figure 23. Saudi Arabia Grain Fumigants Revenue (USD Million) By Region (2021-2032)
Figure 24. The UAE Grain Fumigants Revenue (USD Million) By Region (2021-2032)
Figure 25. Rest of Middle East Grain Fumigants Revenue (USD Million) By Region (2021-2032)
Figure 26. South Africa Grain Fumigants Revenue (USD Million) By Region (2021-2032)
Figure 27. Africa Grain Fumigants Revenue (USD Million) By Region (2021-2032)
Figure 28. North America Grain Fumigants Revenue (USD Million) By Type (2021-2032)
Figure 29. North America Grain Fumigants Revenue (USD Million) By Application (2021-2032)
Figure 30. North America Grain Fumigants Revenue (USD Million) By Product (2021-2032)
Figure 31. Europe Grain Fumigants Revenue (USD Million) By Type (2021-2032)
Figure 32. Europe Grain Fumigants Revenue (USD Million) By Application (2021-2032)
Figure 33. Europe Grain Fumigants Revenue (USD Million) By Product (2021-2032)
Figure 34. Asia Pacific Grain Fumigants Revenue (USD Million) By Type (2021-2032)
Figure 35. Asia Pacific Grain Fumigants Revenue (USD Million) By Application (2021-2032)
Figure 36. Asia Pacific Grain Fumigants Revenue (USD Million) By Product (2021-2032)
Figure 37. South America Grain Fumigants Revenue (USD Million) By Type (2021-2032)
Figure 38. South America Grain Fumigants Revenue (USD Million) By Application (2021-2032)
Figure 39. South America Grain Fumigants Revenue (USD Million) By Product (2021-2032)
Figure 40. Middle East and Africa Grain Fumigants Revenue (USD Million) By Type (2021-2032)
Figure 41. Middle East and Africa Grain Fumigants Revenue (USD Million) By Application (2021-2032)
Figure 42. Middle East and Africa Grain Fumigants Revenue (USD Million) By Product (2021-2032)
By Product
Phosphine
Sulfuryl Fluoride
Methyl Bromide
Others
By Form
Solid
Liquid
Gas
By Application
Commercial
Residential
Countries Analyzed
North America (US, Canada, Mexico)
Europe (Germany, UK, France, Spain, Italy, Russia, Rest of Europe)
Asia Pacific (China, India, Japan, South Korea, Australia, South East Asia, Rest of Asia)
South America (Brazil, Argentina, Rest of South America)
Middle East and Africa (Saudi Arabia, UAE, Rest of Middle East, South Africa, Egypt, Rest of Africa)
