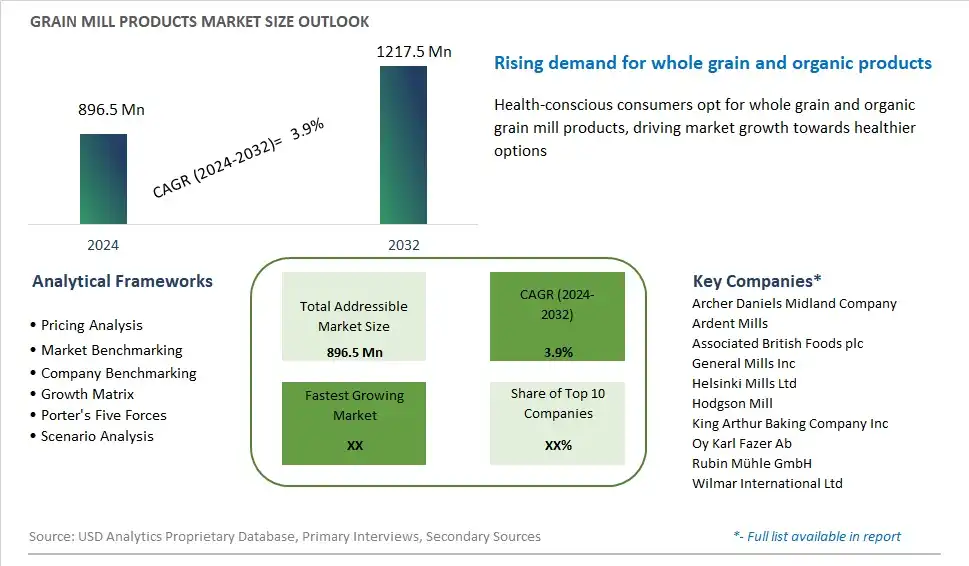
Global Grain Mill Products Market Size is valued at $896.5 Million in 2024 and is forecast to register a growth rate (CAGR) of 3.9% to reach $1217.5 Million by 2032.
The global Grain Mill Products Market Comprehensive Study analyzes and forecasts the market size across 6 regions and 24 countries for diverse segments -By Type (Wheat, Rice, Others), By End-User (Commercial, Residential)
An Introduction to Grain Mill Products Market
In 2024, the grain mill products market is experiencing steady growth, driven by the demand for high-quality and versatile grain-based ingredients. Grain mill products, which include flours, meal, grits, and bran, are essential components in a wide range of food products, from bread and pasta to cereals and snacks. The market is characterized by innovations in milling technology and grain processing, enhancing the nutritional profile, texture, and shelf life of grain mill products. The trend towards whole grains and ancient grains, such as quinoa, spelt, and millet, is influencing the market, as consumers seek healthier and more diverse grain options. Additionally, the rise of specialty and dietary-specific products, including gluten-free and organic grain mill products, is expanding market opportunities. The emphasis on sustainability and locally sourced grains is also shaping the market, as consumers become more conscious of the environmental impact of their food choices. The grain mill products market is set for continued growth, supported by innovation and consumer preferences for high-quality and nutritious grain-based ingredients.
Grain Mill Products Competitive Landscape
The market report analyses the leading companies in the industry including Archer Daniels Midland Company, Ardent Mills, Associated British Foods plc, General Mills Inc, Helsinki Mills Ltd, Hodgson Mill, King Arthur Baking Company Inc, Oy Karl Fazer Ab, Rubin Mühle GmbH, Wilmar International Ltd, and Others.
Grain Mill Products Market Dynamics
Grain Mill Products Market Trend: Growing Demand for Healthier Grain Options
A prominent trend in the market for grain mill products is the growing demand for healthier grain options among consumers. As individuals become more health-conscious and prioritize nutritious food choices, there is an increasing preference for grains that offer higher levels of fiber, vitamins, and minerals. This trend is driving the popularity of whole grains and ancient grains, such as quinoa, spelt, and amaranth, which are perceived as healthier alternatives to refined grains. Manufacturers of grain mill products can capitalize on this trend by offering a wider variety of whole and ancient grain options to cater to health-conscious consumers.
Market Driver: Rise in Home Baking and Cooking Activities
A key driver of the grain mill products market is the rise in home baking and cooking activities, particularly during periods of lockdowns and restrictions. With more people spending time at home, there has been a surge in home baking and cooking projects as individuals seek to experiment with new recipes and flavors. This increase in home cooking has led to higher demand for grain mill products, including flour, meal, and baking mixes, as consumers look to stock up on essential ingredients for their culinary endeavors. The convenience and satisfaction of baking from scratch at home are driving consumers to purchase a variety of grain mill products to support their cooking aspirations.
Market Opportunity: Expansion of Specialty and Artisanal Grain Offerings
An opportunity in the grain mill products market lies in the expansion of specialty and artisanal grain offerings. While traditional grains like wheat, corn, and rice dominate the market, there is growing interest in unique and exotic grains among adventurous consumers and culinary enthusiasts. Manufacturers can capitalize on this trend by sourcing and milling a wider variety of specialty grains, such as teff, farro, and sorghum, to create niche products that appeal to discerning consumers. By catering to niche markets and offering high-quality, artisanal grain options, companies can differentiate themselves from competitors and capture new segments of the market.
Grain Mill Products Market Share Analysis: Wheat Segment held the dominant market share in 2024
Within the Grain Mill Products market, the Wheat segment is the largest category, commanding a significant share due to the widespread consumption and versatile applications of wheat-based products worldwide. Wheat serves as a staple food crop in many cultures, with its flour being a key ingredient in a wide range of products such as bread, pasta, cakes, cookies, and breakfast cereals. The popularity of wheat-based products stems from wheat's unique properties, including its gluten content, which provides elasticity and structure to baked goods. Further, wheat flour is widely available, affordable, and easily accessible, further contributing to its dominance in the Grain Mill Products market. With its established presence in supermarkets, bakeries, restaurants, and foodservice establishments, the Wheat segment continues to lead the market, presenting significant opportunities for manufacturers to innovate and meet the diverse culinary preferences and dietary needs of consumers worldwide.
Grain Mill Products Market Share Analysis: Commercial End-User Segment market is poised to register the fastest growth rae over the forecast period to 2032
Among the segments in the Grain Mill Products market, the Commercial End-User segment is the fastest-growing category, driven by the increasing demand from the foodservice industry, bakery establishments, and industrial food manufacturers. Commercial end-users require large quantities of grain mill products to meet the demand for baked goods, pastries, cereals, snacks, and other food products. The growth of the commercial segment is fueled by factors such as expanding urbanization, changing consumer lifestyles, and the rise of foodservice establishments offering grain-based menu items. Further, the growing popularity of artisanal bakeries, specialty cafes, and restaurants focusing on whole grains and specialty flours further contributes to the surge in demand for grain mill products in the commercial sector. With the increasing preference for freshly milled, high-quality grains in commercial food production, the Commercial End-User segment presents significant opportunities for grain mill product manufacturers to expand their market presence and cater to the evolving needs of the foodservice industry.
Grain Mill Products Market Segmentation
By Type
Wheat
Rice
Others
By End-User
Commercial
Residential
Countries Analyzed
North America (US, Canada, Mexico)
Europe (Germany, UK, France, Spain, Italy, Russia, Rest of Europe)
Asia Pacific (China, India, Japan, South Korea, Australia, South East Asia, Rest of Asia)
South America (Brazil, Argentina, Rest of South America)
Middle East and Africa (Saudi Arabia, UAE, Rest of Middle East, South Africa, Egypt, Rest of Africa)
Grain Mill Products Companies Profiled in the Study
Archer Daniels Midland Company
Ardent Mills
Associated British Foods plc
General Mills Inc
Helsinki Mills Ltd
Hodgson Mill
King Arthur Baking Company Inc
Oy Karl Fazer Ab
Rubin Mühle GmbH
Wilmar International Ltd
*- List Not Exhaustive
Chapter 1. TABLE OF CONTENTS
Chapter 2. Introduction to Grain Mill Products Market
2.1. Market Overview
2.2. Key Statistics and Report Highlights
2.3. Scope of the Comprehensive Study
2.3.1. Market Definition
2.3.2 Countries and Regions Covered
2.3.3 Research Objective
2.3.4 Units, Currency, and Conversions
2.3.5 Industry Value Chain
2.4. Key Market Segments
2.5. Key Companies
2.6. Study Period
Chapter 3. Strategic Analysis Review
3.1. Grain Mill Products Pricing Analysis and Forecast
3.2. Porter’s Five Forces
3.3. Market Ecosystem
3.4. SWOT Analysis
3.5. Regulatory Scenario
3.3. Effects of Inflation, Russia-Ukraine War, moderating economic growth, and other macroeconomic factors
Chapter 4. Competitive Landscape
4.1. Market Share Analysis
4.1.1. Global Grain Mill Products Market Share by Company, 2023
4.1.2. Product Offerings of Leading Grain Mill Products Companies
4.2. Market Entropy
4.2.1. New Product Launches in the Industry
4.2.2. Mergers, Acquisitions, Joint ventures, and Partnerships
4.3. Key Strategies and Best Practices
Chapter 5. Global Market Projections: Best, Reference, and Low Case Scenarios
5.1. Growth Analysis- Case Scenario Definitions
5.2. Low Growth Case Scenario Forecasts
5.3. Reference Growth Case Scenario Forecasts
5.4. High Growth Case Scenario Forecasts
Chapter 6. Market Dynamics
6.1. Grain Mill Products Market Drivers
6.2. Grain Mill Products Market Challenges
6.6. Grain Mill Products Market Opportunities
6.4. Grain Mill Products Market Trends
Chapter 7. Global Grain Mill Products Market Outlook Trends
7.1. Global Grain Mill Products Revenue (USD Million) and CAGR (%) by Type (2021-2032)
7.2. Global Grain Mill Products Revenue (USD Million) and CAGR (%) by Application (2021-2032)
7.3. Global Grain Mill Products Revenue (USD Million) and CAGR (%) by Product (2021-2032)
By Type
Wheat
Rice
Others
By End-User
Commercial
Residential
Chapter 8. Global Grain Mill Products Regional Analysis and Outlook
8.1. Global Grain Mill Products Revenue (USD Million) By Regions (2021- 2032)
8.2. North America Grain Mill Products Revenue (USD Million) by Country (2021-2032)
8.2.1. United States Grain Mill Products Regional Analysis and Outlook
8.2.2. Canada Grain Mill Products Regional Analysis and Outlook
8.2.3. Mexico Grain Mill Products Regional Analysis and Outlook
8.3. Europe Grain Mill Products Revenue (USD Million), by Country (2021-2032)
8.3.1. Germany Grain Mill Products Regional Analysis and Outlook
8.3.2. France Grain Mill Products Regional Analysis and Outlook
8.3.3. United Kingdom Grain Mill Products Regional Analysis and Outlook
8.3.4. Spain Grain Mill Products Regional Analysis and Outlook
8.3.5. Italy Grain Mill Products Regional Analysis and Outlook
8.3.6. Russia Grain Mill Products Regional Analysis and Outlook
8.3.7. Rest of Europe Grain Mill Products Regional Analysis and Outlook
8.4. Asia Pacific Grain Mill Products Revenue (USD Million) by Country (2021-2032)
8.4.1. China Grain Mill Products Regional Analysis and Outlook
8.4.2. Japan Grain Mill Products Regional Analysis and Outlook
8.4.3. India Grain Mill Products Regional Analysis and Outlook
8.4.4. South Korea Grain Mill Products Regional Analysis and Outlook
8.4.5. Australia Grain Mill Products Regional Analysis and Outlook
8.4.6. South East Asia Grain Mill Products Regional Analysis and Outlook
8.4.7. Rest of Asia Pacific Grain Mill Products Regional Analysis and Outlook
8.5. South America Grain Mill Products Revenue (USD Million), by Country (2021-2032)
8.5.1. Brazil Grain Mill Products Regional Analysis and Outlook
8.5.2. Argentina Grain Mill Products Regional Analysis and Outlook
8.5.3. Rest of South America Grain Mill Products Regional Analysis and Outlook
8.6. Middle East and Africa Grain Mill Products Revenue (USD Million) by Country (2021-2032)
8.6.1. Middle East Grain Mill Products Regional Analysis and Outlook
8.6.2. Africa Grain Mill Products Regional Analysis and Outlook
Chapter 9. North America Grain Mill Products Analysis and Outlook
9.1. North America Grain Mill Products Revenue (USD Million) by Segments (2021-2032)
9.1.1. North America Grain Mill Products Revenue (USD Million) by Type (2021-2032)
9.1.2. North America Grain Mill Products Revenue (USD Million) by Application (2021-2032)
9.1.3. North America Grain Mill Products Revenue (USD Million) by Product (2021-2032)
By Type
Wheat
Rice
Others
By End-User
Commercial
Residential
Chapter 10. Europe Grain Mill Products Analysis and Outlook
10.1. Europe Grain Mill Products Revenue (USD Million), by Segments (USD Million) (2021-2032)
10.1.1. Europe Grain Mill Products Revenue (USD Million) by Type (2021-2032)
10.1.2. Europe Grain Mill Products Revenue (USD Million) by Application (2021-2032)
10.1.3. Europe Grain Mill Products Revenue (USD Million) by Product (2021-2032)
By Type
Wheat
Rice
Others
By End-User
Commercial
Residential
Chapter 11. Asia Pacific Grain Mill Products Analysis and Outlook
11.1. Asia Pacific Grain Mill Products Revenue (USD Million), and Revenue (USD Million) by Segments (2021-2032)
11.1.1. Asia Pacific Grain Mill Products Revenue (USD Million) by Type (2021-2032)
11.1.2. Asia Pacific Grain Mill Products Revenue (USD Million) by Application (2021-2032)
11.1.3. Asia Pacific Grain Mill Products Revenue (USD Million) by Product (2021-2032)
By Type
Wheat
Rice
Others
By End-User
Commercial
Residential
Chapter 12. South America Grain Mill Products Analysis and Outlook
12.1. South America Grain Mill Products Revenue (USD Million), by Segments (2021-2032)
12.1.1. South America Grain Mill Products Revenue (USD Million) by Type (2021-2032)
12.1.2. South America Grain Mill Products Revenue (USD Million) by Application (2021-2032)
12.1.3. South America Grain Mill Products Revenue (USD Million) by Product (2021-2032)
By Type
Wheat
Rice
Others
By End-User
Commercial
Residential
Chapter 13. Middle East and Africa Grain Mill Products Analysis and Outlook
13.1. Middle East and Africa Grain Mill Products Revenue (USD Million), by Segments (2021-2032)
13.1.1. Middle East and Africa Grain Mill Products Revenue (USD Million) by Type (2021-2032)
13.1.2. Middle East and Africa Grain Mill Products Revenue (USD Million) by Application (2021-2032)
13.1.3. Middle East and Africa Grain Mill Products Revenue (USD Million) by Product (2021-2032)
By Type
Wheat
Rice
Others
By End-User
Commercial
Residential
Chapter 14. Grain Mill Products Company Profiles
14.1 Business Overview
14.2 Product Profiles
14.3 SWOT Profiles
14.5 Recent Developments
14.6 Financial Profile
List of Companies
Archer Daniels Midland Company
Ardent Mills
Associated British Foods plc
General Mills Inc
Helsinki Mills Ltd
Hodgson Mill
King Arthur Baking Company Inc
Oy Karl Fazer Ab
Rubin Mühle GmbH
Wilmar International Ltd
15. Methodology and Data Sources
15.1 Customization Offerings
15.2 Subscription Services
15.3 Related Reports
15.4 Publisher Expertise
LIST OF TABLES
Table 1 Market Segmentation Analysis
Table 2 Global Grain Mill Products Market Share of Leading Companies, 2023
Table 3 Product Offerings of Leading Companies
Table 4 Low Growth Scenario Forecasts
Table 5 Reference Case Growth Scenario
Table 6 High Growth Case Scenario
Table 7 Global Grain Mill Products Revenue (USD Million) And CAGR (%) By Type (2021-2032)
Table 8 Global Grain Mill Products Revenue (USD Million) And CAGR (%) By Application (2021-2032)
Table 9 Global Grain Mill Products Revenue (USD Million) And CAGR (%) By Product (2021-2032)
Table 10 Global Grain Mill Products Market Revenue (USD Million) By Regions (2021-2032)
Table 11 Global Grain Mill Products Market Share (%) By Regions (2021-2032)
Table 12 North America Grain Mill Products Revenue (USD Million) By Country (2021-2032)
Table 13 Europe Grain Mill Products Revenue (USD Million) By Country (2021-2032)
Table 14 Asia Pacific Grain Mill Products Revenue (USD Million) By Country (2021-2032)
Table 15 South America Grain Mill Products Revenue (USD Million) By Country (2021-2032)
Table 16 Middle East and Africa Grain Mill Products Revenue (USD Million) By Region (2021-2032)
Table 17 North America Grain Mill Products Revenue (USD Million) By Type (2021-2032)
Table 18 North America Grain Mill Products Revenue (USD Million) By Application (2021-2032)
Table 19 North America Grain Mill Products Revenue (USD Million) By Product (2021-2032)
Table 20 Europe Grain Mill Products Revenue (USD Million) By Type (2021-2032)
Table 21 Europe Grain Mill Products Revenue (USD Million) By Application (2021-2032)
Table 22 Europe Grain Mill Products Revenue (USD Million) By Product (2021-2032)
Table 23 Asia Pacific Grain Mill Products Revenue (USD Million) By Type (2021-2032)
Table 24 Asia Pacific Grain Mill Products Revenue (USD Million) By Application (2021-2032)
Table 25 Asia Pacific Grain Mill Products Revenue (USD Million) By Product (2021-2032)
Table 26 South America Grain Mill Products Revenue (USD Million) By Type (2021-2032)
Table 27 South America Grain Mill Products Revenue (USD Million) By Application (2021-2032)
Table 28 South America Grain Mill Products Revenue (USD Million) By Product (2021-2032)
Table 29 Middle East and Africa Grain Mill Products Revenue (USD Million) By Type (2021-2032)
Table 30 Middle East and Africa Grain Mill Products Revenue (USD Million) By Application (2021-2032)
Table 31 Middle East and Africa Grain Mill Products Revenue (USD Million) By Product (2021-2032)
LIST OF FIGURES
Figure 1. Market Scope
Figure 2. Pricing Forecasts Per Unit, 2023- 2032
Figure 3. Porter’s Five Forces
Figure 4. Global Grain Mill Products Market Revenue (USD Million) By Regions (2021-2032)
Figure 5. Global Grain Mill Products Market Share (%) By Regions (2023)
Figure 6. North America Grain Mill Products Revenue (USD Million) By Country (2021-2032)
Figure 7. United States Grain Mill Products Revenue (USD Million) By Country (2021-2032)
Figure 8. Canada Grain Mill Products Revenue (USD Million) By Country (2021-2032)
Figure 9. Mexico Grain Mill Products Revenue (USD Million) By Country (2021-2032)
Figure 10. Europe Grain Mill Products Revenue (USD Million) By Country (2021-2032)
Figure 11. Germany Grain Mill Products Revenue (USD Million) By Country (2021-2032)
Figure 12. France Grain Mill Products Revenue (USD Million) By Country (2021-2032)
Figure 13. United Kingdom Grain Mill Products Revenue (USD Million) By Country (2021-2032)
Figure 14. Spain Grain Mill Products Revenue (USD Million) By Country (2021-2032)
Figure 15. Italy Grain Mill Products Revenue (USD Million) By Country (2021-2032)
Figure 16. Russia Grain Mill Products Revenue (USD Million) By Country (2021-2032)
Figure 17. Rest of Europe Grain Mill Products Revenue (USD Million) By Country (2021-2032)
Figure 11. Asia Pacific Grain Mill Products Revenue (USD Million) By Country (2021-2032)
Figure 12. China Grain Mill Products Revenue (USD Million) By Country (2021-2032)
Figure 13. Japan Grain Mill Products Revenue (USD Million) By Country (2021-2032)
Figure 14. India Grain Mill Products Revenue (USD Million) By Country (2021-2032)
Figure 15. South Korea Grain Mill Products Revenue (USD Million) By Country (2021-2032)
Figure 16. Australia Grain Mill Products Revenue (USD Million) By Country (2021-2032)
Figure 17. South East Asia Grain Mill Products Revenue (USD Million) By Country (2021-2032)
Figure 18. South America Grain Mill Products Revenue (USD Million) By Country (2021-2032)
Figure 19. Brazil Grain Mill Products Revenue (USD Million) By Country (2021-2032)
Figure 20. Argentina Grain Mill Products Revenue (USD Million) By Country (2021-2032)
Figure 21. Rest of Asia Pacific Grain Mill Products Revenue (USD Million) By Country (2021-2032)
Figure 22. Middle East and Africa Grain Mill Products Revenue (USD Million) By Region (2021-2032)
Figure 23. Saudi Arabia Grain Mill Products Revenue (USD Million) By Region (2021-2032)
Figure 24. The UAE Grain Mill Products Revenue (USD Million) By Region (2021-2032)
Figure 25. Rest of Middle East Grain Mill Products Revenue (USD Million) By Region (2021-2032)
Figure 26. South Africa Grain Mill Products Revenue (USD Million) By Region (2021-2032)
Figure 27. Africa Grain Mill Products Revenue (USD Million) By Region (2021-2032)
Figure 28. North America Grain Mill Products Revenue (USD Million) By Type (2021-2032)
Figure 29. North America Grain Mill Products Revenue (USD Million) By Application (2021-2032)
Figure 30. North America Grain Mill Products Revenue (USD Million) By Product (2021-2032)
Figure 31. Europe Grain Mill Products Revenue (USD Million) By Type (2021-2032)
Figure 32. Europe Grain Mill Products Revenue (USD Million) By Application (2021-2032)
Figure 33. Europe Grain Mill Products Revenue (USD Million) By Product (2021-2032)
Figure 34. Asia Pacific Grain Mill Products Revenue (USD Million) By Type (2021-2032)
Figure 35. Asia Pacific Grain Mill Products Revenue (USD Million) By Application (2021-2032)
Figure 36. Asia Pacific Grain Mill Products Revenue (USD Million) By Product (2021-2032)
Figure 37. South America Grain Mill Products Revenue (USD Million) By Type (2021-2032)
Figure 38. South America Grain Mill Products Revenue (USD Million) By Application (2021-2032)
Figure 39. South America Grain Mill Products Revenue (USD Million) By Product (2021-2032)
Figure 40. Middle East and Africa Grain Mill Products Revenue (USD Million) By Type (2021-2032)
Figure 41. Middle East and Africa Grain Mill Products Revenue (USD Million) By Application (2021-2032)
Figure 42. Middle East and Africa Grain Mill Products Revenue (USD Million) By Product (2021-2032)
By Type
Wheat
Rice
Others
By End-User
Commercial
Residential
Countries Analyzed
North America (US, Canada, Mexico)
Europe (Germany, UK, France, Spain, Italy, Russia, Rest of Europe)
Asia Pacific (China, India, Japan, South Korea, Australia, South East Asia, Rest of Asia)
South America (Brazil, Argentina, Rest of South America)
Middle East and Africa (Saudi Arabia, UAE, Rest of Middle East, South Africa, Egypt, Rest of Africa)
