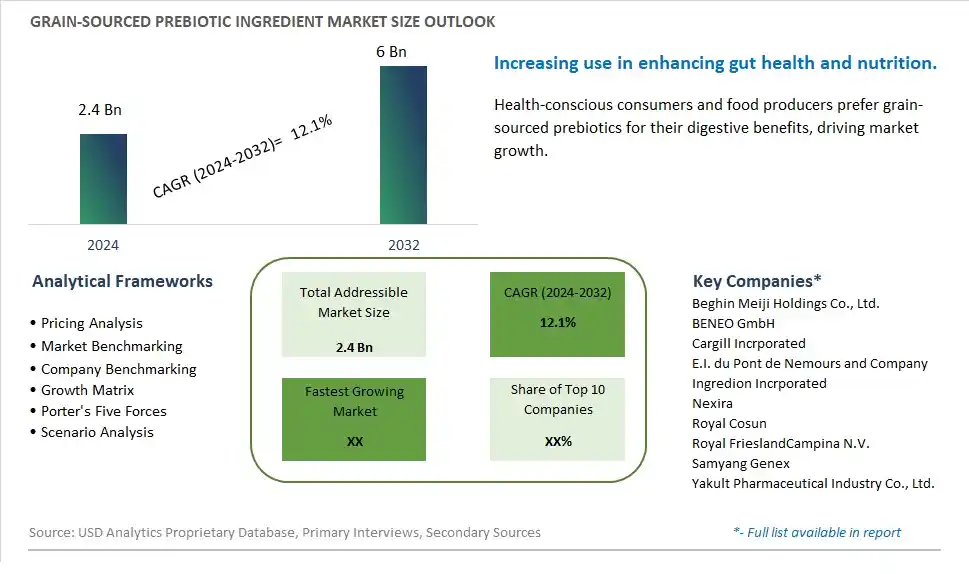
Global Grain-sourced Prebiotic Ingredient Market Size is valued at $2.4 Billion in 2024 and is forecast to register a growth rate (CAGR) of 12.1% to reach $6 Billion by 2032.
The global Grain-sourced Prebiotic Ingredient Market Comprehensive Study analyzes and forecasts the market size across 6 regions and 24 countries for diverse segments -By Type (Oligosaccharides, Inulin, Polydextrose, Others), By Application (Food & beverages, Dietary supplements, Animal feed)
An Introduction to Grain-sourced Prebiotic Ingredient Market
The Grain-Sourced Prebiotic Ingredient Market focuses on the production and sale of prebiotic ingredients derived from grains, such as inulin and fructooligosaccharides. These ingredients promote gut health and are used in dietary supplements, functional foods, and beverages. The market is driven by increasing awareness about the benefits of prebiotics, rising demand for digestive health products, and growing applications in the food and beverage industry. Additionally, advancements in prebiotic extraction technologies and the expansion of product applications support market growth.
Grain sourced Prebiotic Ingredient Competitive Landscape
The market report analyses the leading companies in the industry including Beghin Meiji Holdings Co., Ltd., BENEO GmbH, Cargill Incrporated, E.I. du Pont de Nemours and Company, Ingredion Incrporated, Nexira, Royal Cosun, Royal FrieslandCampina N.V., Samyang Genex, Yakult Pharmaceutical Industry Co., Ltd., and Others.
Grain sourced Prebiotic Ingredient Market Dynamics
Grain-sourced Prebiotic Ingredient Market Trend: Increasing Use of Prebiotic Ingredients in Functional Foods
The most prominent trend in the Grain-sourced Prebiotic Ingredient Market is the increasing use of prebiotic ingredients in functional foods. As consumers seek to improve their digestive health and overall wellness, grain-sourced prebiotics are gaining popularity for their ability to support gut health. This trend is driven by the growing demand for functional foods that offer specific health benefits.
Grain-sourced Prebiotic Ingredient Market Driver: Growth in Health and Wellness Products
The key driver of the Grain-sourced Prebiotic Ingredient Market is the growth in health and wellness products. As more consumers focus on maintaining a healthy lifestyle, there is a higher demand for food products that incorporate prebiotic ingredients to enhance nutritional value and support digestive health. This driver is supported by the trend towards functional foods and beverages that provide targeted health benefits, driving market growth for grain-sourced prebiotic ingredients.
Grain-sourced Prebiotic Ingredient Market Opportunity: Expansion into New Food and Beverage Applications
A significant opportunity in the Grain-sourced Prebiotic Ingredient Market lies in the expansion into new food and beverage applications. By developing innovative products that incorporate prebiotic ingredients, such as snacks, supplements, and beverages, companies can cater to the evolving preferences of health-conscious consumers. Offering high-quality prebiotic ingredients that enhance the nutritional profile and functionality of various food products can help expand market reach and drive growth in the functional food sector.
Grain-sourced Prebiotic Ingredient Market Share Analysis- Largest Segment by Type
The Inulin segment is the largest in the Grain-sourced Prebiotic Ingredient Market by type. This dominance is driven by the high demand for inulin due to its multifunctional properties and health benefits. Inulin, derived from sources such as chicory root, is widely used as a dietary fiber and prebiotic in various food and beverage products. It promotes digestive health, improves gut microbiota, and enhances calcium absorption, making it a popular choice among health-conscious consumers. The continuous innovation in inulin applications, including its use in low-calorie and functional foods, enhances its appeal. Additionally, the growing trend of health and wellness supports the significant market share of the inulin segment, as consumers seek ingredients that offer both nutritional benefits and functional properties. The extensive availability of inulin in health food stores, supermarkets, and online platforms further boosts its accessibility to a broad consumer base.
Grain-sourced Prebiotic Ingredient Market Share Analysis- Fastest Growing Segment by Application
The Dietary Supplements segment is poised to grow the fastest in the Grain-sourced Prebiotic Ingredient Market by application over the next five years. This rapid growth is driven by the increasing consumer awareness of the health benefits of prebiotics and the growing demand for dietary supplements that support digestive health, immune function, and overall well-being. Prebiotic ingredients such as inulin and oligosaccharides are widely used in dietary supplements for their ability to promote gut health and enhance the effectiveness of probiotics. The continuous innovation in supplement formulations, including the introduction of prebiotic blends and combination products, supports their fast growth. Additionally, the expanding market for functional foods and supplements, coupled with the increasing focus on preventive healthcare and wellness, drives the demand for prebiotic ingredients in dietary supplements. The growing trend of personalized nutrition and the availability of prebiotic supplements in various retail channels, including online platforms, contribute to their fast growth.
Grain sourced Prebiotic Ingredient Market Segmentation
By Type
Oligosaccharides
Inulin
Polydextrose
Others
By Application
Food & beverages
Dietary supplements
Animal feed
Countries Analyzed
North America (US, Canada, Mexico)
Europe (Germany, UK, France, Spain, Italy, Russia, Rest of Europe)
Asia Pacific (China, India, Japan, South Korea, Australia, South East Asia, Rest of Asia)
South America (Brazil, Argentina, Rest of South America)
Middle East and Africa (Saudi Arabia, UAE, Rest of Middle East, South Africa, Egypt, Rest of Africa)
Grain sourced Prebiotic Ingredient Companies Profiled in the Study
Beghin Meiji Holdings Co., Ltd.
BENEO GmbH
Cargill Incrporated
E.I. du Pont de Nemours and Company
Ingredion Incrporated
Nexira
Royal Cosun
Royal FrieslandCampina N.V.
Samyang Genex
Yakult Pharmaceutical Industry Co., Ltd.
*- List Not Exhaustive
Chapter 1. TABLE OF CONTENTS
Chapter 2. Introduction to Grain sourced Prebiotic Ingredient Market
2.1. Market Overview
2.2. Key Statistics and Report Highlights
2.3. Scope of the Comprehensive Study
2.3.1. Market Definition
2.3.2 Countries and Regions Covered
2.3.3 Research Objective
2.3.4 Units, Currency, and Conversions
2.3.5 Industry Value Chain
2.4. Key Market Segments
2.5. Key Companies
2.6. Study Period
Chapter 3. Strategic Analysis Review
3.1. Grain sourced Prebiotic Ingredient Pricing Analysis and Forecast
3.2. Porter’s Five Forces
3.3. Market Ecosystem
3.4. SWOT Analysis
3.5. Regulatory Scenario
3.3. Effects of Inflation, Russia-Ukraine War, moderating economic growth, and other macroeconomic factors
Chapter 4. Competitive Landscape
4.1. Market Share Analysis
4.1.1. Global Grain sourced Prebiotic Ingredient Market Share by Company, 2023
4.1.2. Product Offerings of Leading Grain sourced Prebiotic Ingredient Companies
4.2. Market Entropy
4.2.1. New Product Launches in the Industry
4.2.2. Mergers, Acquisitions, Joint ventures, and Partnerships
4.3. Key Strategies and Best Practices
Chapter 5. Global Market Projections: Best, Reference, and Low Case Scenarios
5.1. Growth Analysis- Case Scenario Definitions
5.2. Low Growth Case Scenario Forecasts
5.3. Reference Growth Case Scenario Forecasts
5.4. High Growth Case Scenario Forecasts
Chapter 6. Market Dynamics
6.1. Grain sourced Prebiotic Ingredient Market Drivers
6.2. Grain sourced Prebiotic Ingredient Market Challenges
6.6. Grain sourced Prebiotic Ingredient Market Opportunities
6.4. Grain sourced Prebiotic Ingredient Market Trends
Chapter 7. Global Grain sourced Prebiotic Ingredient Market Outlook Trends
7.1. Global Grain sourced Prebiotic Ingredient Revenue (USD Million) and CAGR (%) by Type (2021-2032)
7.2. Global Grain sourced Prebiotic Ingredient Revenue (USD Million) and CAGR (%) by Application (2021-2032)
7.3. Global Grain sourced Prebiotic Ingredient Revenue (USD Million) and CAGR (%) by Product (2021-2032)
By Type
Oligosaccharides
Inulin
Polydextrose
Others
By Application
Food & beverages
Dietary supplements
Animal feed
Chapter 8. Global Grain sourced Prebiotic Ingredient Regional Analysis and Outlook
8.1. Global Grain sourced Prebiotic Ingredient Revenue (USD Million) By Regions (2021- 2032)
8.2. North America Grain sourced Prebiotic Ingredient Revenue (USD Million) by Country (2021-2032)
8.2.1. United States Grain sourced Prebiotic Ingredient Regional Analysis and Outlook
8.2.2. Canada Grain sourced Prebiotic Ingredient Regional Analysis and Outlook
8.2.3. Mexico Grain sourced Prebiotic Ingredient Regional Analysis and Outlook
8.3. Europe Grain sourced Prebiotic Ingredient Revenue (USD Million), by Country (2021-2032)
8.3.1. Germany Grain sourced Prebiotic Ingredient Regional Analysis and Outlook
8.3.2. France Grain sourced Prebiotic Ingredient Regional Analysis and Outlook
8.3.3. United Kingdom Grain sourced Prebiotic Ingredient Regional Analysis and Outlook
8.3.4. Spain Grain sourced Prebiotic Ingredient Regional Analysis and Outlook
8.3.5. Italy Grain sourced Prebiotic Ingredient Regional Analysis and Outlook
8.3.6. Russia Grain sourced Prebiotic Ingredient Regional Analysis and Outlook
8.3.7. Rest of Europe Grain sourced Prebiotic Ingredient Regional Analysis and Outlook
8.4. Asia Pacific Grain sourced Prebiotic Ingredient Revenue (USD Million) by Country (2021-2032)
8.4.1. China Grain sourced Prebiotic Ingredient Regional Analysis and Outlook
8.4.2. Japan Grain sourced Prebiotic Ingredient Regional Analysis and Outlook
8.4.3. India Grain sourced Prebiotic Ingredient Regional Analysis and Outlook
8.4.4. South Korea Grain sourced Prebiotic Ingredient Regional Analysis and Outlook
8.4.5. Australia Grain sourced Prebiotic Ingredient Regional Analysis and Outlook
8.4.6. South East Asia Grain sourced Prebiotic Ingredient Regional Analysis and Outlook
8.4.7. Rest of Asia Pacific Grain sourced Prebiotic Ingredient Regional Analysis and Outlook
8.5. South America Grain sourced Prebiotic Ingredient Revenue (USD Million), by Country (2021-2032)
8.5.1. Brazil Grain sourced Prebiotic Ingredient Regional Analysis and Outlook
8.5.2. Argentina Grain sourced Prebiotic Ingredient Regional Analysis and Outlook
8.5.3. Rest of South America Grain sourced Prebiotic Ingredient Regional Analysis and Outlook
8.6. Middle East and Africa Grain sourced Prebiotic Ingredient Revenue (USD Million) by Country (2021-2032)
8.6.1. Middle East Grain sourced Prebiotic Ingredient Regional Analysis and Outlook
8.6.2. Africa Grain sourced Prebiotic Ingredient Regional Analysis and Outlook
Chapter 9. North America Grain sourced Prebiotic Ingredient Analysis and Outlook
9.1. North America Grain sourced Prebiotic Ingredient Revenue (USD Million) by Segments (2021-2032)
9.1.1. North America Grain sourced Prebiotic Ingredient Revenue (USD Million) by Type (2021-2032)
9.1.2. North America Grain sourced Prebiotic Ingredient Revenue (USD Million) by Application (2021-2032)
9.1.3. North America Grain sourced Prebiotic Ingredient Revenue (USD Million) by Product (2021-2032)
By Type
Oligosaccharides
Inulin
Polydextrose
Others
By Application
Food & beverages
Dietary supplements
Animal feed
Chapter 10. Europe Grain sourced Prebiotic Ingredient Analysis and Outlook
10.1. Europe Grain sourced Prebiotic Ingredient Revenue (USD Million), by Segments (USD Million) (2021-2032)
10.1.1. Europe Grain sourced Prebiotic Ingredient Revenue (USD Million) by Type (2021-2032)
10.1.2. Europe Grain sourced Prebiotic Ingredient Revenue (USD Million) by Application (2021-2032)
10.1.3. Europe Grain sourced Prebiotic Ingredient Revenue (USD Million) by Product (2021-2032)
By Type
Oligosaccharides
Inulin
Polydextrose
Others
By Application
Food & beverages
Dietary supplements
Animal feed
Chapter 11. Asia Pacific Grain sourced Prebiotic Ingredient Analysis and Outlook
11.1. Asia Pacific Grain sourced Prebiotic Ingredient Revenue (USD Million), and Revenue (USD Million) by Segments (2021-2032)
11.1.1. Asia Pacific Grain sourced Prebiotic Ingredient Revenue (USD Million) by Type (2021-2032)
11.1.2. Asia Pacific Grain sourced Prebiotic Ingredient Revenue (USD Million) by Application (2021-2032)
11.1.3. Asia Pacific Grain sourced Prebiotic Ingredient Revenue (USD Million) by Product (2021-2032)
By Type
Oligosaccharides
Inulin
Polydextrose
Others
By Application
Food & beverages
Dietary supplements
Animal feed
Chapter 12. South America Grain sourced Prebiotic Ingredient Analysis and Outlook
12.1. South America Grain sourced Prebiotic Ingredient Revenue (USD Million), by Segments (2021-2032)
12.1.1. South America Grain sourced Prebiotic Ingredient Revenue (USD Million) by Type (2021-2032)
12.1.2. South America Grain sourced Prebiotic Ingredient Revenue (USD Million) by Application (2021-2032)
12.1.3. South America Grain sourced Prebiotic Ingredient Revenue (USD Million) by Product (2021-2032)
By Type
Oligosaccharides
Inulin
Polydextrose
Others
By Application
Food & beverages
Dietary supplements
Animal feed
Chapter 13. Middle East and Africa Grain sourced Prebiotic Ingredient Analysis and Outlook
13.1. Middle East and Africa Grain sourced Prebiotic Ingredient Revenue (USD Million), by Segments (2021-2032)
13.1.1. Middle East and Africa Grain sourced Prebiotic Ingredient Revenue (USD Million) by Type (2021-2032)
13.1.2. Middle East and Africa Grain sourced Prebiotic Ingredient Revenue (USD Million) by Application (2021-2032)
13.1.3. Middle East and Africa Grain sourced Prebiotic Ingredient Revenue (USD Million) by Product (2021-2032)
By Type
Oligosaccharides
Inulin
Polydextrose
Others
By Application
Food & beverages
Dietary supplements
Animal feed
Chapter 14. Grain sourced Prebiotic Ingredient Company Profiles
14.1 Business Overview
14.2 Product Profiles
14.3 SWOT Profiles
14.5 Recent Developments
14.6 Financial Profile
List of Companies
Beghin Meiji Holdings Co., Ltd.
BENEO GmbH
Cargill Incrporated
E.I. du Pont de Nemours and Company
Ingredion Incrporated
Nexira
Royal Cosun
Royal FrieslandCampina N.V.
Samyang Genex
Yakult Pharmaceutical Industry Co., Ltd.
15. Methodology and Data Sources
15.1 Customization Offerings
15.2 Subscription Services
15.3 Related Reports
15.4 Publisher Expertise
LIST OF TABLES
Table 1 Market Segmentation Analysis
Table 2 Global Grain sourced Prebiotic Ingredient Market Share of Leading Companies, 2023
Table 3 Product Offerings of Leading Companies
Table 4 Low Growth Scenario Forecasts
Table 5 Reference Case Growth Scenario
Table 6 High Growth Case Scenario
Table 7 Global Grain sourced Prebiotic Ingredient Revenue (USD Million) And CAGR (%) By Type (2021-2032)
Table 8 Global Grain sourced Prebiotic Ingredient Revenue (USD Million) And CAGR (%) By Application (2021-2032)
Table 9 Global Grain sourced Prebiotic Ingredient Revenue (USD Million) And CAGR (%) By Product (2021-2032)
Table 10 Global Grain sourced Prebiotic Ingredient Market Revenue (USD Million) By Regions (2021-2032)
Table 11 Global Grain sourced Prebiotic Ingredient Market Share (%) By Regions (2021-2032)
Table 12 North America Grain sourced Prebiotic Ingredient Revenue (USD Million) By Country (2021-2032)
Table 13 Europe Grain sourced Prebiotic Ingredient Revenue (USD Million) By Country (2021-2032)
Table 14 Asia Pacific Grain sourced Prebiotic Ingredient Revenue (USD Million) By Country (2021-2032)
Table 15 South America Grain sourced Prebiotic Ingredient Revenue (USD Million) By Country (2021-2032)
Table 16 Middle East and Africa Grain sourced Prebiotic Ingredient Revenue (USD Million) By Region (2021-2032)
Table 17 North America Grain sourced Prebiotic Ingredient Revenue (USD Million) By Type (2021-2032)
Table 18 North America Grain sourced Prebiotic Ingredient Revenue (USD Million) By Application (2021-2032)
Table 19 North America Grain sourced Prebiotic Ingredient Revenue (USD Million) By Product (2021-2032)
Table 20 Europe Grain sourced Prebiotic Ingredient Revenue (USD Million) By Type (2021-2032)
Table 21 Europe Grain sourced Prebiotic Ingredient Revenue (USD Million) By Application (2021-2032)
Table 22 Europe Grain sourced Prebiotic Ingredient Revenue (USD Million) By Product (2021-2032)
Table 23 Asia Pacific Grain sourced Prebiotic Ingredient Revenue (USD Million) By Type (2021-2032)
Table 24 Asia Pacific Grain sourced Prebiotic Ingredient Revenue (USD Million) By Application (2021-2032)
Table 25 Asia Pacific Grain sourced Prebiotic Ingredient Revenue (USD Million) By Product (2021-2032)
Table 26 South America Grain sourced Prebiotic Ingredient Revenue (USD Million) By Type (2021-2032)
Table 27 South America Grain sourced Prebiotic Ingredient Revenue (USD Million) By Application (2021-2032)
Table 28 South America Grain sourced Prebiotic Ingredient Revenue (USD Million) By Product (2021-2032)
Table 29 Middle East and Africa Grain sourced Prebiotic Ingredient Revenue (USD Million) By Type (2021-2032)
Table 30 Middle East and Africa Grain sourced Prebiotic Ingredient Revenue (USD Million) By Application (2021-2032)
Table 31 Middle East and Africa Grain sourced Prebiotic Ingredient Revenue (USD Million) By Product (2021-2032)
LIST OF FIGURES
Figure 1. Market Scope
Figure 2. Pricing Forecasts Per Unit, 2023- 2032
Figure 3. Porter’s Five Forces
Figure 4. Global Grain sourced Prebiotic Ingredient Market Revenue (USD Million) By Regions (2021-2032)
Figure 5. Global Grain sourced Prebiotic Ingredient Market Share (%) By Regions (2023)
Figure 6. North America Grain sourced Prebiotic Ingredient Revenue (USD Million) By Country (2021-2032)
Figure 7. United States Grain sourced Prebiotic Ingredient Revenue (USD Million) By Country (2021-2032)
Figure 8. Canada Grain sourced Prebiotic Ingredient Revenue (USD Million) By Country (2021-2032)
Figure 9. Mexico Grain sourced Prebiotic Ingredient Revenue (USD Million) By Country (2021-2032)
Figure 10. Europe Grain sourced Prebiotic Ingredient Revenue (USD Million) By Country (2021-2032)
Figure 11. Germany Grain sourced Prebiotic Ingredient Revenue (USD Million) By Country (2021-2032)
Figure 12. France Grain sourced Prebiotic Ingredient Revenue (USD Million) By Country (2021-2032)
Figure 13. United Kingdom Grain sourced Prebiotic Ingredient Revenue (USD Million) By Country (2021-2032)
Figure 14. Spain Grain sourced Prebiotic Ingredient Revenue (USD Million) By Country (2021-2032)
Figure 15. Italy Grain sourced Prebiotic Ingredient Revenue (USD Million) By Country (2021-2032)
Figure 16. Russia Grain sourced Prebiotic Ingredient Revenue (USD Million) By Country (2021-2032)
Figure 17. Rest of Europe Grain sourced Prebiotic Ingredient Revenue (USD Million) By Country (2021-2032)
Figure 11. Asia Pacific Grain sourced Prebiotic Ingredient Revenue (USD Million) By Country (2021-2032)
Figure 12. China Grain sourced Prebiotic Ingredient Revenue (USD Million) By Country (2021-2032)
Figure 13. Japan Grain sourced Prebiotic Ingredient Revenue (USD Million) By Country (2021-2032)
Figure 14. India Grain sourced Prebiotic Ingredient Revenue (USD Million) By Country (2021-2032)
Figure 15. South Korea Grain sourced Prebiotic Ingredient Revenue (USD Million) By Country (2021-2032)
Figure 16. Australia Grain sourced Prebiotic Ingredient Revenue (USD Million) By Country (2021-2032)
Figure 17. South East Asia Grain sourced Prebiotic Ingredient Revenue (USD Million) By Country (2021-2032)
Figure 18. South America Grain sourced Prebiotic Ingredient Revenue (USD Million) By Country (2021-2032)
Figure 19. Brazil Grain sourced Prebiotic Ingredient Revenue (USD Million) By Country (2021-2032)
Figure 20. Argentina Grain sourced Prebiotic Ingredient Revenue (USD Million) By Country (2021-2032)
Figure 21. Rest of Asia Pacific Grain sourced Prebiotic Ingredient Revenue (USD Million) By Country (2021-2032)
Figure 22. Middle East and Africa Grain sourced Prebiotic Ingredient Revenue (USD Million) By Region (2021-2032)
Figure 23. Saudi Arabia Grain sourced Prebiotic Ingredient Revenue (USD Million) By Region (2021-2032)
Figure 24. The UAE Grain sourced Prebiotic Ingredient Revenue (USD Million) By Region (2021-2032)
Figure 25. Rest of Middle East Grain sourced Prebiotic Ingredient Revenue (USD Million) By Region (2021-2032)
Figure 26. South Africa Grain sourced Prebiotic Ingredient Revenue (USD Million) By Region (2021-2032)
Figure 27. Africa Grain sourced Prebiotic Ingredient Revenue (USD Million) By Region (2021-2032)
Figure 28. North America Grain sourced Prebiotic Ingredient Revenue (USD Million) By Type (2021-2032)
Figure 29. North America Grain sourced Prebiotic Ingredient Revenue (USD Million) By Application (2021-2032)
Figure 30. North America Grain sourced Prebiotic Ingredient Revenue (USD Million) By Product (2021-2032)
Figure 31. Europe Grain sourced Prebiotic Ingredient Revenue (USD Million) By Type (2021-2032)
Figure 32. Europe Grain sourced Prebiotic Ingredient Revenue (USD Million) By Application (2021-2032)
Figure 33. Europe Grain sourced Prebiotic Ingredient Revenue (USD Million) By Product (2021-2032)
Figure 34. Asia Pacific Grain sourced Prebiotic Ingredient Revenue (USD Million) By Type (2021-2032)
Figure 35. Asia Pacific Grain sourced Prebiotic Ingredient Revenue (USD Million) By Application (2021-2032)
Figure 36. Asia Pacific Grain sourced Prebiotic Ingredient Revenue (USD Million) By Product (2021-2032)
Figure 37. South America Grain sourced Prebiotic Ingredient Revenue (USD Million) By Type (2021-2032)
Figure 38. South America Grain sourced Prebiotic Ingredient Revenue (USD Million) By Application (2021-2032)
Figure 39. South America Grain sourced Prebiotic Ingredient Revenue (USD Million) By Product (2021-2032)
Figure 40. Middle East and Africa Grain sourced Prebiotic Ingredient Revenue (USD Million) By Type (2021-2032)
Figure 41. Middle East and Africa Grain sourced Prebiotic Ingredient Revenue (USD Million) By Application (2021-2032)
Figure 42. Middle East and Africa Grain sourced Prebiotic Ingredient Revenue (USD Million) By Product (2021-2032)
By Type
Oligosaccharides
Inulin
Polydextrose
Others
By Application
Food & beverages
Dietary supplements
Animal feed
Countries Analyzed
North America (US, Canada, Mexico)
Europe (Germany, UK, France, Spain, Italy, Russia, Rest of Europe)
Asia Pacific (China, India, Japan, South Korea, Australia, South East Asia, Rest of Asia)
South America (Brazil, Argentina, Rest of South America)
Middle East and Africa (Saudi Arabia, UAE, Rest of Middle East, South Africa, Egypt, Rest of Africa)
