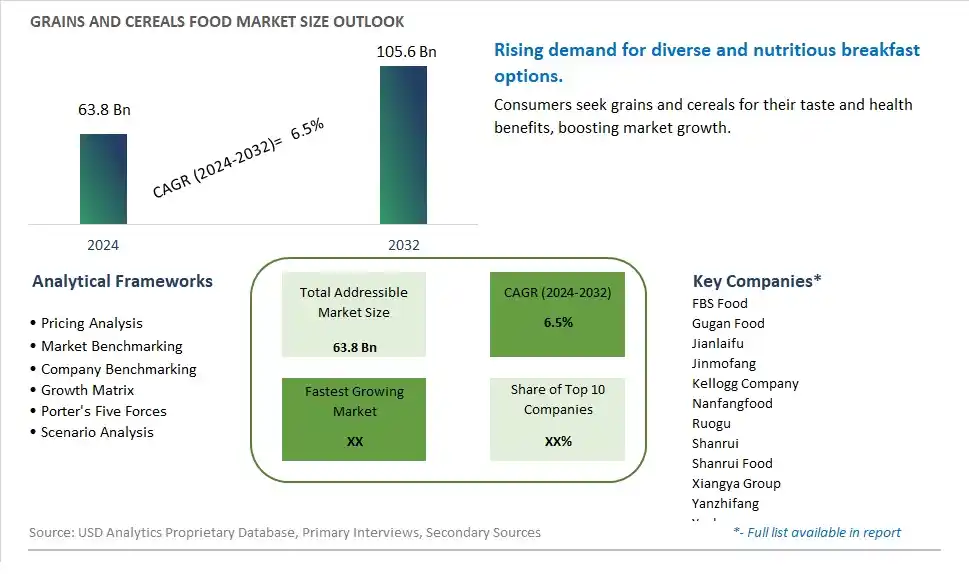
Global Grains and Cereals Food Market Size is valued at $63.8 Billion in 2024 and is forecast to register a growth rate (CAGR) of 6.5% to reach $105.6 Billion by 2032.
The global Grains and Cereals Food Market Comprehensive Study analyzes and forecasts the market size across 6 regions and 24 countries for diverse segments -By Type (Grains, Cereals), By Distribution Channel (Supermarkets/Hypermarkets, Convenience Stores, E-Commerce, Others)
An Introduction to Grains and Cereals Food Market
The Grains and Cereals Food market in 2024 is thriving, fueled by the rising demand for nutritious and versatile food products. Grains and cereals, such as wheat, rice, oats, and quinoa, are staple ingredients in many diets and offer a wide range of health benefits. The market benefits from advancements in grain processing and fortification technologies, the growing trend of health-conscious and whole grain foods, and the expansion of the global food industry. Additionally, the increasing focus on sustainable and ancient grains for their nutritional value and environmental benefits is contributing to market growth.
Grains and Cereals Food Competitive Landscape
The market report analyses the leading companies in the industry including FBS Food, Gugan Food, Jianlaifu, Jinmofang, Kellogg Company, Nanfangfood, Ruogu, Shanrui, Shanrui Food, Xiangya Group, Yanzhifang, Yushanyuan, and Others.
Grains and Cereals Food Market Dynamics
Grains and Cereals Food Market Trend: Increasing Demand for Whole Grains and Natural Foods
The most prominent trend in the Grains and Cereals Food Market is the increasing demand for whole grains and natural foods. As consumers become more health-conscious, there is a growing preference for grains and cereals that offer high nutritional value and health benefits. This trend is driven by the rising awareness of the importance of whole grains in a balanced diet and the desire for clean-label products.
Grains and Cereals Food Market Driver: Growth in Health and Wellness Consciousness
The key driver of the Grains and Cereals Food Market is the growth in health and wellness consciousness. As more people focus on maintaining a healthy lifestyle, there is a higher demand for grains and cereals that provide essential nutrients, such as fiber, vitamins, and minerals. This driver is supported by the trend towards functional foods and the increasing availability of health-focused products in the market, driving growth for grains and cereals.
Grains and Cereals Food Market Opportunity: Innovation in Product Development
A significant opportunity in the Grains and Cereals Food Market lies in innovation in product development. By creating new and unique grain and cereal products that offer enhanced taste, texture, and nutritional benefits, companies can attract health-conscious consumers. Offering high-quality grains and cereals that cater to diverse dietary preferences and health needs can help expand market reach and drive growth in the natural food sector.
Grains and Cereals Food Market Share Analysis: Grains segment generated the highest revenue share in the industry
In the Grains and Cereals Food Market, the largest segment by type is Grains. This category includes a wide variety of staple grains such as wheat, rice, corn, barley, and oats, among others. Grains are fundamental to global diets, serving as essential sources of carbohydrates, proteins, and essential nutrients. They are versatile ingredients used in a plethora of food products, ranging from bread and pasta to breakfast cereals and snacks. The popularity of grains stems from their nutritional value, affordability, and widespread availability across diverse culinary cultures worldwide. Their role in providing sustained energy and dietary fiber further enhances their appeal among health-conscious consumers seeking balanced and wholesome food choices.
Grains and Cereals Food Market Share Analysis: E-Commerce is the fastest growing segment over the forecast period to 2032
Looking at the Grains and Cereals Food Market by distribution channel, E-commerce emerges as the fastest growing segment. This growth is driven by the increasing adoption of online shopping platforms and digital convenience among consumers globally. E-commerce offers unparalleled convenience, allowing consumers to browse a wide range of products, compare prices, and make purchases from the comfort of their homes. In recent years, the convenience and accessibility of e-commerce have been further accelerated by technological advancements, secure payment gateways, and efficient logistics networks. The Past few yearsalso accelerated the shift towards online shopping, as consumers sought safer and more convenient ways to shop for everyday essentials, including grains and cereals. As digitalization continues to reshape consumer behavior, the grains and cereals market is expected to witness robust growth through online retail channels, offering convenience and a diverse array of products to meet evolving consumer preferences.
Grains and Cereals Food Market Segmentation
By Type
Grains
Cereals
By Distribution Channel
Supermarkets/Hypermarkets
Convenience Stores
E-Commerce
Others
Countries Analyzed
North America (US, Canada, Mexico)
Europe (Germany, UK, France, Spain, Italy, Russia, Rest of Europe)
Asia Pacific (China, India, Japan, South Korea, Australia, South East Asia, Rest of Asia)
South America (Brazil, Argentina, Rest of South America)
Middle East and Africa (Saudi Arabia, UAE, Rest of Middle East, South Africa, Egypt, Rest of Africa)
Grains and Cereals Food Companies Profiled in the Study
FBS Food
Gugan Food
Jianlaifu
Jinmofang
Kellogg Company
Nanfangfood
Ruogu
Shanrui
Shanrui Food
Xiangya Group
Yanzhifang
Yushanyuan
*- List Not Exhaustive
Chapter 1. TABLE OF CONTENTS
Chapter 2. Introduction to Grains and Cereals Food Market
2.1. Market Overview
2.2. Key Statistics and Report Highlights
2.3. Scope of the Comprehensive Study
2.3.1. Market Definition
2.3.2 Countries and Regions Covered
2.3.3 Research Objective
2.3.4 Units, Currency, and Conversions
2.3.5 Industry Value Chain
2.4. Key Market Segments
2.5. Key Companies
2.6. Study Period
Chapter 3. Strategic Analysis Review
3.1. Grains and Cereals Food Pricing Analysis and Forecast
3.2. Porter’s Five Forces
3.3. Market Ecosystem
3.4. SWOT Analysis
3.5. Regulatory Scenario
3.3. Effects of Inflation, Russia-Ukraine War, moderating economic growth, and other macroeconomic factors
Chapter 4. Competitive Landscape
4.1. Market Share Analysis
4.1.1. Global Grains and Cereals Food Market Share by Company, 2023
4.1.2. Product Offerings of Leading Grains and Cereals Food Companies
4.2. Market Entropy
4.2.1. New Product Launches in the Industry
4.2.2. Mergers, Acquisitions, Joint ventures, and Partnerships
4.3. Key Strategies and Best Practices
Chapter 5. Global Market Projections: Best, Reference, and Low Case Scenarios
5.1. Growth Analysis- Case Scenario Definitions
5.2. Low Growth Case Scenario Forecasts
5.3. Reference Growth Case Scenario Forecasts
5.4. High Growth Case Scenario Forecasts
Chapter 6. Market Dynamics
6.1. Grains and Cereals Food Market Drivers
6.2. Grains and Cereals Food Market Challenges
6.6. Grains and Cereals Food Market Opportunities
6.4. Grains and Cereals Food Market Trends
Chapter 7. Global Grains and Cereals Food Market Outlook Trends
7.1. Global Grains and Cereals Food Revenue (USD Million) and CAGR (%) by Type (2021-2032)
7.2. Global Grains and Cereals Food Revenue (USD Million) and CAGR (%) by Application (2021-2032)
7.3. Global Grains and Cereals Food Revenue (USD Million) and CAGR (%) by Product (2021-2032)
By Type
Grains
Cereals
By Distribution Channel
Supermarkets/Hypermarkets
Convenience Stores
E-Commerce
Others
Chapter 8. Global Grains and Cereals Food Regional Analysis and Outlook
8.1. Global Grains and Cereals Food Revenue (USD Million) By Regions (2021- 2032)
8.2. North America Grains and Cereals Food Revenue (USD Million) by Country (2021-2032)
8.2.1. United States Grains and Cereals Food Regional Analysis and Outlook
8.2.2. Canada Grains and Cereals Food Regional Analysis and Outlook
8.2.3. Mexico Grains and Cereals Food Regional Analysis and Outlook
8.3. Europe Grains and Cereals Food Revenue (USD Million), by Country (2021-2032)
8.3.1. Germany Grains and Cereals Food Regional Analysis and Outlook
8.3.2. France Grains and Cereals Food Regional Analysis and Outlook
8.3.3. United Kingdom Grains and Cereals Food Regional Analysis and Outlook
8.3.4. Spain Grains and Cereals Food Regional Analysis and Outlook
8.3.5. Italy Grains and Cereals Food Regional Analysis and Outlook
8.3.6. Russia Grains and Cereals Food Regional Analysis and Outlook
8.3.7. Rest of Europe Grains and Cereals Food Regional Analysis and Outlook
8.4. Asia Pacific Grains and Cereals Food Revenue (USD Million) by Country (2021-2032)
8.4.1. China Grains and Cereals Food Regional Analysis and Outlook
8.4.2. Japan Grains and Cereals Food Regional Analysis and Outlook
8.4.3. India Grains and Cereals Food Regional Analysis and Outlook
8.4.4. South Korea Grains and Cereals Food Regional Analysis and Outlook
8.4.5. Australia Grains and Cereals Food Regional Analysis and Outlook
8.4.6. South East Asia Grains and Cereals Food Regional Analysis and Outlook
8.4.7. Rest of Asia Pacific Grains and Cereals Food Regional Analysis and Outlook
8.5. South America Grains and Cereals Food Revenue (USD Million), by Country (2021-2032)
8.5.1. Brazil Grains and Cereals Food Regional Analysis and Outlook
8.5.2. Argentina Grains and Cereals Food Regional Analysis and Outlook
8.5.3. Rest of South America Grains and Cereals Food Regional Analysis and Outlook
8.6. Middle East and Africa Grains and Cereals Food Revenue (USD Million) by Country (2021-2032)
8.6.1. Middle East Grains and Cereals Food Regional Analysis and Outlook
8.6.2. Africa Grains and Cereals Food Regional Analysis and Outlook
Chapter 9. North America Grains and Cereals Food Analysis and Outlook
9.1. North America Grains and Cereals Food Revenue (USD Million) by Segments (2021-2032)
9.1.1. North America Grains and Cereals Food Revenue (USD Million) by Type (2021-2032)
9.1.2. North America Grains and Cereals Food Revenue (USD Million) by Application (2021-2032)
9.1.3. North America Grains and Cereals Food Revenue (USD Million) by Product (2021-2032)
By Type
Grains
Cereals
By Distribution Channel
Supermarkets/Hypermarkets
Convenience Stores
E-Commerce
Others
Chapter 10. Europe Grains and Cereals Food Analysis and Outlook
10.1. Europe Grains and Cereals Food Revenue (USD Million), by Segments (USD Million) (2021-2032)
10.1.1. Europe Grains and Cereals Food Revenue (USD Million) by Type (2021-2032)
10.1.2. Europe Grains and Cereals Food Revenue (USD Million) by Application (2021-2032)
10.1.3. Europe Grains and Cereals Food Revenue (USD Million) by Product (2021-2032)
By Type
Grains
Cereals
By Distribution Channel
Supermarkets/Hypermarkets
Convenience Stores
E-Commerce
Others
Chapter 11. Asia Pacific Grains and Cereals Food Analysis and Outlook
11.1. Asia Pacific Grains and Cereals Food Revenue (USD Million), and Revenue (USD Million) by Segments (2021-2032)
11.1.1. Asia Pacific Grains and Cereals Food Revenue (USD Million) by Type (2021-2032)
11.1.2. Asia Pacific Grains and Cereals Food Revenue (USD Million) by Application (2021-2032)
11.1.3. Asia Pacific Grains and Cereals Food Revenue (USD Million) by Product (2021-2032)
By Type
Grains
Cereals
By Distribution Channel
Supermarkets/Hypermarkets
Convenience Stores
E-Commerce
Others
Chapter 12. South America Grains and Cereals Food Analysis and Outlook
12.1. South America Grains and Cereals Food Revenue (USD Million), by Segments (2021-2032)
12.1.1. South America Grains and Cereals Food Revenue (USD Million) by Type (2021-2032)
12.1.2. South America Grains and Cereals Food Revenue (USD Million) by Application (2021-2032)
12.1.3. South America Grains and Cereals Food Revenue (USD Million) by Product (2021-2032)
By Type
Grains
Cereals
By Distribution Channel
Supermarkets/Hypermarkets
Convenience Stores
E-Commerce
Others
Chapter 13. Middle East and Africa Grains and Cereals Food Analysis and Outlook
13.1. Middle East and Africa Grains and Cereals Food Revenue (USD Million), by Segments (2021-2032)
13.1.1. Middle East and Africa Grains and Cereals Food Revenue (USD Million) by Type (2021-2032)
13.1.2. Middle East and Africa Grains and Cereals Food Revenue (USD Million) by Application (2021-2032)
13.1.3. Middle East and Africa Grains and Cereals Food Revenue (USD Million) by Product (2021-2032)
By Type
Grains
Cereals
By Distribution Channel
Supermarkets/Hypermarkets
Convenience Stores
E-Commerce
Others
Chapter 14. Grains and Cereals Food Company Profiles
14.1 Business Overview
14.2 Product Profiles
14.3 SWOT Profiles
14.5 Recent Developments
14.6 Financial Profile
List of Companies
FBS Food
Gugan Food
Jianlaifu
Jinmofang
Kellogg Company
Nanfangfood
Ruogu
Shanrui
Shanrui Food
Xiangya Group
Yanzhifang
Yushanyuan
15. Methodology and Data Sources
15.1 Customization Offerings
15.2 Subscription Services
15.3 Related Reports
15.4 Publisher Expertise
LIST OF TABLES
Table 1 Market Segmentation Analysis
Table 2 Global Grains and Cereals Food Market Share of Leading Companies, 2023
Table 3 Product Offerings of Leading Companies
Table 4 Low Growth Scenario Forecasts
Table 5 Reference Case Growth Scenario
Table 6 High Growth Case Scenario
Table 7 Global Grains and Cereals Food Revenue (USD Million) And CAGR (%) By Type (2021-2032)
Table 8 Global Grains and Cereals Food Revenue (USD Million) And CAGR (%) By Application (2021-2032)
Table 9 Global Grains and Cereals Food Revenue (USD Million) And CAGR (%) By Product (2021-2032)
Table 10 Global Grains and Cereals Food Market Revenue (USD Million) By Regions (2021-2032)
Table 11 Global Grains and Cereals Food Market Share (%) By Regions (2021-2032)
Table 12 North America Grains and Cereals Food Revenue (USD Million) By Country (2021-2032)
Table 13 Europe Grains and Cereals Food Revenue (USD Million) By Country (2021-2032)
Table 14 Asia Pacific Grains and Cereals Food Revenue (USD Million) By Country (2021-2032)
Table 15 South America Grains and Cereals Food Revenue (USD Million) By Country (2021-2032)
Table 16 Middle East and Africa Grains and Cereals Food Revenue (USD Million) By Region (2021-2032)
Table 17 North America Grains and Cereals Food Revenue (USD Million) By Type (2021-2032)
Table 18 North America Grains and Cereals Food Revenue (USD Million) By Application (2021-2032)
Table 19 North America Grains and Cereals Food Revenue (USD Million) By Product (2021-2032)
Table 20 Europe Grains and Cereals Food Revenue (USD Million) By Type (2021-2032)
Table 21 Europe Grains and Cereals Food Revenue (USD Million) By Application (2021-2032)
Table 22 Europe Grains and Cereals Food Revenue (USD Million) By Product (2021-2032)
Table 23 Asia Pacific Grains and Cereals Food Revenue (USD Million) By Type (2021-2032)
Table 24 Asia Pacific Grains and Cereals Food Revenue (USD Million) By Application (2021-2032)
Table 25 Asia Pacific Grains and Cereals Food Revenue (USD Million) By Product (2021-2032)
Table 26 South America Grains and Cereals Food Revenue (USD Million) By Type (2021-2032)
Table 27 South America Grains and Cereals Food Revenue (USD Million) By Application (2021-2032)
Table 28 South America Grains and Cereals Food Revenue (USD Million) By Product (2021-2032)
Table 29 Middle East and Africa Grains and Cereals Food Revenue (USD Million) By Type (2021-2032)
Table 30 Middle East and Africa Grains and Cereals Food Revenue (USD Million) By Application (2021-2032)
Table 31 Middle East and Africa Grains and Cereals Food Revenue (USD Million) By Product (2021-2032)
LIST OF FIGURES
Figure 1. Market Scope
Figure 2. Pricing Forecasts Per Unit, 2023- 2032
Figure 3. Porter’s Five Forces
Figure 4. Global Grains and Cereals Food Market Revenue (USD Million) By Regions (2021-2032)
Figure 5. Global Grains and Cereals Food Market Share (%) By Regions (2023)
Figure 6. North America Grains and Cereals Food Revenue (USD Million) By Country (2021-2032)
Figure 7. United States Grains and Cereals Food Revenue (USD Million) By Country (2021-2032)
Figure 8. Canada Grains and Cereals Food Revenue (USD Million) By Country (2021-2032)
Figure 9. Mexico Grains and Cereals Food Revenue (USD Million) By Country (2021-2032)
Figure 10. Europe Grains and Cereals Food Revenue (USD Million) By Country (2021-2032)
Figure 11. Germany Grains and Cereals Food Revenue (USD Million) By Country (2021-2032)
Figure 12. France Grains and Cereals Food Revenue (USD Million) By Country (2021-2032)
Figure 13. United Kingdom Grains and Cereals Food Revenue (USD Million) By Country (2021-2032)
Figure 14. Spain Grains and Cereals Food Revenue (USD Million) By Country (2021-2032)
Figure 15. Italy Grains and Cereals Food Revenue (USD Million) By Country (2021-2032)
Figure 16. Russia Grains and Cereals Food Revenue (USD Million) By Country (2021-2032)
Figure 17. Rest of Europe Grains and Cereals Food Revenue (USD Million) By Country (2021-2032)
Figure 11. Asia Pacific Grains and Cereals Food Revenue (USD Million) By Country (2021-2032)
Figure 12. China Grains and Cereals Food Revenue (USD Million) By Country (2021-2032)
Figure 13. Japan Grains and Cereals Food Revenue (USD Million) By Country (2021-2032)
Figure 14. India Grains and Cereals Food Revenue (USD Million) By Country (2021-2032)
Figure 15. South Korea Grains and Cereals Food Revenue (USD Million) By Country (2021-2032)
Figure 16. Australia Grains and Cereals Food Revenue (USD Million) By Country (2021-2032)
Figure 17. South East Asia Grains and Cereals Food Revenue (USD Million) By Country (2021-2032)
Figure 18. South America Grains and Cereals Food Revenue (USD Million) By Country (2021-2032)
Figure 19. Brazil Grains and Cereals Food Revenue (USD Million) By Country (2021-2032)
Figure 20. Argentina Grains and Cereals Food Revenue (USD Million) By Country (2021-2032)
Figure 21. Rest of Asia Pacific Grains and Cereals Food Revenue (USD Million) By Country (2021-2032)
Figure 22. Middle East and Africa Grains and Cereals Food Revenue (USD Million) By Region (2021-2032)
Figure 23. Saudi Arabia Grains and Cereals Food Revenue (USD Million) By Region (2021-2032)
Figure 24. The UAE Grains and Cereals Food Revenue (USD Million) By Region (2021-2032)
Figure 25. Rest of Middle East Grains and Cereals Food Revenue (USD Million) By Region (2021-2032)
Figure 26. South Africa Grains and Cereals Food Revenue (USD Million) By Region (2021-2032)
Figure 27. Africa Grains and Cereals Food Revenue (USD Million) By Region (2021-2032)
Figure 28. North America Grains and Cereals Food Revenue (USD Million) By Type (2021-2032)
Figure 29. North America Grains and Cereals Food Revenue (USD Million) By Application (2021-2032)
Figure 30. North America Grains and Cereals Food Revenue (USD Million) By Product (2021-2032)
Figure 31. Europe Grains and Cereals Food Revenue (USD Million) By Type (2021-2032)
Figure 32. Europe Grains and Cereals Food Revenue (USD Million) By Application (2021-2032)
Figure 33. Europe Grains and Cereals Food Revenue (USD Million) By Product (2021-2032)
Figure 34. Asia Pacific Grains and Cereals Food Revenue (USD Million) By Type (2021-2032)
Figure 35. Asia Pacific Grains and Cereals Food Revenue (USD Million) By Application (2021-2032)
Figure 36. Asia Pacific Grains and Cereals Food Revenue (USD Million) By Product (2021-2032)
Figure 37. South America Grains and Cereals Food Revenue (USD Million) By Type (2021-2032)
Figure 38. South America Grains and Cereals Food Revenue (USD Million) By Application (2021-2032)
Figure 39. South America Grains and Cereals Food Revenue (USD Million) By Product (2021-2032)
Figure 40. Middle East and Africa Grains and Cereals Food Revenue (USD Million) By Type (2021-2032)
Figure 41. Middle East and Africa Grains and Cereals Food Revenue (USD Million) By Application (2021-2032)
Figure 42. Middle East and Africa Grains and Cereals Food Revenue (USD Million) By Product (2021-2032)
By Type
Grains
Cereals
By Distribution Channel
Supermarkets/Hypermarkets
Convenience Stores
E-Commerce
Others
Countries Analyzed
North America (US, Canada, Mexico)
Europe (Germany, UK, France, Spain, Italy, Russia, Rest of Europe)
Asia Pacific (China, India, Japan, South Korea, Australia, South East Asia, Rest of Asia)
South America (Brazil, Argentina, Rest of South America)
Middle East and Africa (Saudi Arabia, UAE, Rest of Middle East, South Africa, Egypt, Rest of Africa)
