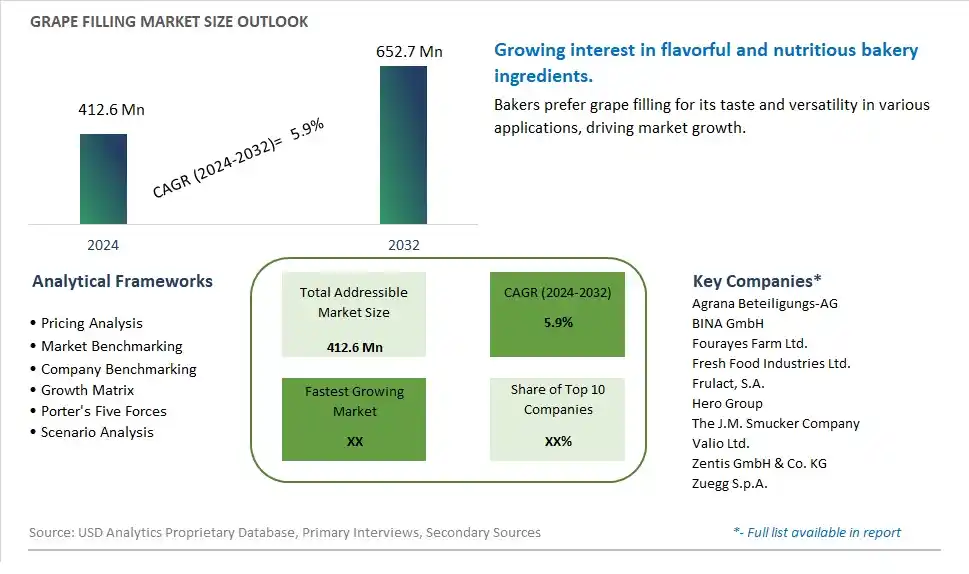
Global Grape Filling Market Size is valued at $412.6 Million in 2024 and is forecast to register a growth rate (CAGR) of 5.9% to reach $652.7 Million by 2032.
The global Grape Filling Market Comprehensive Study analyzes and forecasts the market size across 6 regions and 24 countries for diverse segments -By Type (High Sugar Jam, Low Sugar Jam), By Application (Dairy, Baked Product, Ice-Cream , Others)
An Introduction to Grape Filling Market
In 2024, the Grape Filling market is witnessing robust growth, driven by the rising demand for high-quality and flavorful fillings in bakery and confectionery products. Grape filling, known for its rich taste and versatility, is used in pastries, cakes, and desserts. The market benefits from advancements in fruit processing and preservation technologies, the growing trend of gourmet and artisanal foods, and the expansion of the global bakery sector. Additionally, the increasing focus on natural and clean label ingredients in fruit fillings is contributing to market growth.
Grape Filling Competitive Landscape
The market report analyses the leading companies in the industry including Agrana Beteiligungs-AG, BINA GmbH, Fourayes Farm Ltd., Fresh Food Industries Ltd., Frulact, S.A., Hero Group, The J.M. Smucker Company, Valio Ltd., Zentis GmbH & Co. KG, Zuegg S.p.A., and Others.
Grape Filling Market Dynamics
Grape Filling Market Trend: Rising Popularity of Fruit-Based Fillings
The most prominent trend in the Grape Filling Market is the rising popularity of fruit-based fillings. As consumers seek natural and flavorful ingredients for their baked goods and desserts, grape fillings are gaining traction for their unique taste and versatility. This trend is driven by the growing interest in natural and wholesome ingredients that enhance the flavor and nutritional value of food products.
Grape Filling Market Driver: Growth in Bakery and Confectionery Industry
The key driver of the Grape Filling Market is the growth in the bakery and confectionery industry. As more consumers enjoy baked goods and desserts, there is a higher demand for high-quality fruit fillings that provide delicious and natural flavors. This driver is supported by the trend towards artisanal and gourmet baked products, driving market growth for grape fillings.
Grape Filling Market Opportunity: Development of Innovative Filling Products
A significant opportunity in the Grape Filling Market lies in the development of innovative filling products. By creating new and unique grape-based fillings that offer enhanced taste, texture, and nutritional benefits, companies can attract both professional bakers and home cooks. Offering high-quality grape fillings that cater to diverse culinary applications can help expand market reach and drive growth in the bakery and confectionery sector.
Grape Filling Market Share Analysis: High Sugar Jam segment generated the highest revenue share in the industry
In the Grape Filling Market, the largest segment by type is High Sugar Jam. High sugar jams are traditionally favored for their sweet and indulgent flavor profile, making them popular choices for spreading on breads, pastries, and desserts. They are characterized by a higher concentration of sugar, which not only acts as a natural preservative but also enhances the fruity taste of grapes. High sugar jams appeal to consumers who enjoy sweeter food products and are used widely in households and food service establishments alike. Their versatility allows them to be incorporated into a variety of culinary applications, from breakfast spreads to baking ingredients, further cementing their position as a staple in the grape filling market.
Grape Filling Market Share Analysis: Dairy is the fastest growing segment over the forecast period to 2032
Looking at the Grape Filling Market by application, the fastest growing segment is Dairy. Grape fillings find increasing use in dairy products such as yogurt, ice cream, and flavored milk. The natural sweetness and fruity flavor of grape fillings complement dairy-based products, offering consumers a refreshing and indulgent taste experience. As consumer preferences shift towards healthier and more natural food choices, the demand for fruit-based fillings in dairy products has surged. Grape fillings not only enhance the flavor and texture of dairy foods but also contribute to their nutritional profile, adding vitamins, minerals, and antioxidants. The growing popularity of dairy-based grape fillings underscores their role in innovation within the dairy industry, catering to diverse consumer tastes and preferences for flavorful and nutritious dairy products.
Grape Filling Market Segmentation
By Type
High Sugar Jam
Low Sugar Jam
By Application
Dairy
Baked Product
Ice-Cream
Others
Countries Analyzed
North America (US, Canada, Mexico)
Europe (Germany, UK, France, Spain, Italy, Russia, Rest of Europe)
Asia Pacific (China, India, Japan, South Korea, Australia, South East Asia, Rest of Asia)
South America (Brazil, Argentina, Rest of South America)
Middle East and Africa (Saudi Arabia, UAE, Rest of Middle East, South Africa, Egypt, Rest of Africa)
Grape Filling Companies Profiled in the Study
Agrana Beteiligungs-AG
BINA GmbH
Fourayes Farm Ltd.
Fresh Food Industries Ltd.
Frulact, S.A.
Hero Group
The J.M. Smucker Company
Valio Ltd.
Zentis GmbH & Co. KG
Zuegg S.p.A.
*- List Not Exhaustive
Chapter 1. TABLE OF CONTENTS
Chapter 2. Introduction to Grape Filling Market
2.1. Market Overview
2.2. Key Statistics and Report Highlights
2.3. Scope of the Comprehensive Study
2.3.1. Market Definition
2.3.2 Countries and Regions Covered
2.3.3 Research Objective
2.3.4 Units, Currency, and Conversions
2.3.5 Industry Value Chain
2.4. Key Market Segments
2.5. Key Companies
2.6. Study Period
Chapter 3. Strategic Analysis Review
3.1. Grape Filling Pricing Analysis and Forecast
3.2. Porter’s Five Forces
3.3. Market Ecosystem
3.4. SWOT Analysis
3.5. Regulatory Scenario
3.3. Effects of Inflation, Russia-Ukraine War, moderating economic growth, and other macroeconomic factors
Chapter 4. Competitive Landscape
4.1. Market Share Analysis
4.1.1. Global Grape Filling Market Share by Company, 2023
4.1.2. Product Offerings of Leading Grape Filling Companies
4.2. Market Entropy
4.2.1. New Product Launches in the Industry
4.2.2. Mergers, Acquisitions, Joint ventures, and Partnerships
4.3. Key Strategies and Best Practices
Chapter 5. Global Market Projections: Best, Reference, and Low Case Scenarios
5.1. Growth Analysis- Case Scenario Definitions
5.2. Low Growth Case Scenario Forecasts
5.3. Reference Growth Case Scenario Forecasts
5.4. High Growth Case Scenario Forecasts
Chapter 6. Market Dynamics
6.1. Grape Filling Market Drivers
6.2. Grape Filling Market Challenges
6.6. Grape Filling Market Opportunities
6.4. Grape Filling Market Trends
Chapter 7. Global Grape Filling Market Outlook Trends
7.1. Global Grape Filling Revenue (USD Million) and CAGR (%) by Type (2021-2032)
7.2. Global Grape Filling Revenue (USD Million) and CAGR (%) by Application (2021-2032)
7.3. Global Grape Filling Revenue (USD Million) and CAGR (%) by Product (2021-2032)
By Type
High Sugar Jam
Low Sugar Jam
By Application
Dairy
Baked Product
Ice-Cream
Others
Chapter 8. Global Grape Filling Regional Analysis and Outlook
8.1. Global Grape Filling Revenue (USD Million) By Regions (2021- 2032)
8.2. North America Grape Filling Revenue (USD Million) by Country (2021-2032)
8.2.1. United States Grape Filling Regional Analysis and Outlook
8.2.2. Canada Grape Filling Regional Analysis and Outlook
8.2.3. Mexico Grape Filling Regional Analysis and Outlook
8.3. Europe Grape Filling Revenue (USD Million), by Country (2021-2032)
8.3.1. Germany Grape Filling Regional Analysis and Outlook
8.3.2. France Grape Filling Regional Analysis and Outlook
8.3.3. United Kingdom Grape Filling Regional Analysis and Outlook
8.3.4. Spain Grape Filling Regional Analysis and Outlook
8.3.5. Italy Grape Filling Regional Analysis and Outlook
8.3.6. Russia Grape Filling Regional Analysis and Outlook
8.3.7. Rest of Europe Grape Filling Regional Analysis and Outlook
8.4. Asia Pacific Grape Filling Revenue (USD Million) by Country (2021-2032)
8.4.1. China Grape Filling Regional Analysis and Outlook
8.4.2. Japan Grape Filling Regional Analysis and Outlook
8.4.3. India Grape Filling Regional Analysis and Outlook
8.4.4. South Korea Grape Filling Regional Analysis and Outlook
8.4.5. Australia Grape Filling Regional Analysis and Outlook
8.4.6. South East Asia Grape Filling Regional Analysis and Outlook
8.4.7. Rest of Asia Pacific Grape Filling Regional Analysis and Outlook
8.5. South America Grape Filling Revenue (USD Million), by Country (2021-2032)
8.5.1. Brazil Grape Filling Regional Analysis and Outlook
8.5.2. Argentina Grape Filling Regional Analysis and Outlook
8.5.3. Rest of South America Grape Filling Regional Analysis and Outlook
8.6. Middle East and Africa Grape Filling Revenue (USD Million) by Country (2021-2032)
8.6.1. Middle East Grape Filling Regional Analysis and Outlook
8.6.2. Africa Grape Filling Regional Analysis and Outlook
Chapter 9. North America Grape Filling Analysis and Outlook
9.1. North America Grape Filling Revenue (USD Million) by Segments (2021-2032)
9.1.1. North America Grape Filling Revenue (USD Million) by Type (2021-2032)
9.1.2. North America Grape Filling Revenue (USD Million) by Application (2021-2032)
9.1.3. North America Grape Filling Revenue (USD Million) by Product (2021-2032)
By Type
High Sugar Jam
Low Sugar Jam
By Application
Dairy
Baked Product
Ice-Cream
Others
Chapter 10. Europe Grape Filling Analysis and Outlook
10.1. Europe Grape Filling Revenue (USD Million), by Segments (USD Million) (2021-2032)
10.1.1. Europe Grape Filling Revenue (USD Million) by Type (2021-2032)
10.1.2. Europe Grape Filling Revenue (USD Million) by Application (2021-2032)
10.1.3. Europe Grape Filling Revenue (USD Million) by Product (2021-2032)
By Type
High Sugar Jam
Low Sugar Jam
By Application
Dairy
Baked Product
Ice-Cream
Others
Chapter 11. Asia Pacific Grape Filling Analysis and Outlook
11.1. Asia Pacific Grape Filling Revenue (USD Million), and Revenue (USD Million) by Segments (2021-2032)
11.1.1. Asia Pacific Grape Filling Revenue (USD Million) by Type (2021-2032)
11.1.2. Asia Pacific Grape Filling Revenue (USD Million) by Application (2021-2032)
11.1.3. Asia Pacific Grape Filling Revenue (USD Million) by Product (2021-2032)
By Type
High Sugar Jam
Low Sugar Jam
By Application
Dairy
Baked Product
Ice-Cream
Others
Chapter 12. South America Grape Filling Analysis and Outlook
12.1. South America Grape Filling Revenue (USD Million), by Segments (2021-2032)
12.1.1. South America Grape Filling Revenue (USD Million) by Type (2021-2032)
12.1.2. South America Grape Filling Revenue (USD Million) by Application (2021-2032)
12.1.3. South America Grape Filling Revenue (USD Million) by Product (2021-2032)
By Type
High Sugar Jam
Low Sugar Jam
By Application
Dairy
Baked Product
Ice-Cream
Others
Chapter 13. Middle East and Africa Grape Filling Analysis and Outlook
13.1. Middle East and Africa Grape Filling Revenue (USD Million), by Segments (2021-2032)
13.1.1. Middle East and Africa Grape Filling Revenue (USD Million) by Type (2021-2032)
13.1.2. Middle East and Africa Grape Filling Revenue (USD Million) by Application (2021-2032)
13.1.3. Middle East and Africa Grape Filling Revenue (USD Million) by Product (2021-2032)
By Type
High Sugar Jam
Low Sugar Jam
By Application
Dairy
Baked Product
Ice-Cream
Others
Chapter 14. Grape Filling Company Profiles
14.1 Business Overview
14.2 Product Profiles
14.3 SWOT Profiles
14.5 Recent Developments
14.6 Financial Profile
List of Companies
Agrana Beteiligungs-AG
BINA GmbH
Fourayes Farm Ltd.
Fresh Food Industries Ltd.
Frulact, S.A.
Hero Group
The J.M. Smucker Company
Valio Ltd.
Zentis GmbH & Co. KG
Zuegg S.p.A.
15. Methodology and Data Sources
15.1 Customization Offerings
15.2 Subscription Services
15.3 Related Reports
15.4 Publisher Expertise
LIST OF TABLES
Table 1 Market Segmentation Analysis
Table 2 Global Grape Filling Market Share of Leading Companies, 2023
Table 3 Product Offerings of Leading Companies
Table 4 Low Growth Scenario Forecasts
Table 5 Reference Case Growth Scenario
Table 6 High Growth Case Scenario
Table 7 Global Grape Filling Revenue (USD Million) And CAGR (%) By Type (2021-2032)
Table 8 Global Grape Filling Revenue (USD Million) And CAGR (%) By Application (2021-2032)
Table 9 Global Grape Filling Revenue (USD Million) And CAGR (%) By Product (2021-2032)
Table 10 Global Grape Filling Market Revenue (USD Million) By Regions (2021-2032)
Table 11 Global Grape Filling Market Share (%) By Regions (2021-2032)
Table 12 North America Grape Filling Revenue (USD Million) By Country (2021-2032)
Table 13 Europe Grape Filling Revenue (USD Million) By Country (2021-2032)
Table 14 Asia Pacific Grape Filling Revenue (USD Million) By Country (2021-2032)
Table 15 South America Grape Filling Revenue (USD Million) By Country (2021-2032)
Table 16 Middle East and Africa Grape Filling Revenue (USD Million) By Region (2021-2032)
Table 17 North America Grape Filling Revenue (USD Million) By Type (2021-2032)
Table 18 North America Grape Filling Revenue (USD Million) By Application (2021-2032)
Table 19 North America Grape Filling Revenue (USD Million) By Product (2021-2032)
Table 20 Europe Grape Filling Revenue (USD Million) By Type (2021-2032)
Table 21 Europe Grape Filling Revenue (USD Million) By Application (2021-2032)
Table 22 Europe Grape Filling Revenue (USD Million) By Product (2021-2032)
Table 23 Asia Pacific Grape Filling Revenue (USD Million) By Type (2021-2032)
Table 24 Asia Pacific Grape Filling Revenue (USD Million) By Application (2021-2032)
Table 25 Asia Pacific Grape Filling Revenue (USD Million) By Product (2021-2032)
Table 26 South America Grape Filling Revenue (USD Million) By Type (2021-2032)
Table 27 South America Grape Filling Revenue (USD Million) By Application (2021-2032)
Table 28 South America Grape Filling Revenue (USD Million) By Product (2021-2032)
Table 29 Middle East and Africa Grape Filling Revenue (USD Million) By Type (2021-2032)
Table 30 Middle East and Africa Grape Filling Revenue (USD Million) By Application (2021-2032)
Table 31 Middle East and Africa Grape Filling Revenue (USD Million) By Product (2021-2032)
LIST OF FIGURES
Figure 1. Market Scope
Figure 2. Pricing Forecasts Per Unit, 2023- 2032
Figure 3. Porter’s Five Forces
Figure 4. Global Grape Filling Market Revenue (USD Million) By Regions (2021-2032)
Figure 5. Global Grape Filling Market Share (%) By Regions (2023)
Figure 6. North America Grape Filling Revenue (USD Million) By Country (2021-2032)
Figure 7. United States Grape Filling Revenue (USD Million) By Country (2021-2032)
Figure 8. Canada Grape Filling Revenue (USD Million) By Country (2021-2032)
Figure 9. Mexico Grape Filling Revenue (USD Million) By Country (2021-2032)
Figure 10. Europe Grape Filling Revenue (USD Million) By Country (2021-2032)
Figure 11. Germany Grape Filling Revenue (USD Million) By Country (2021-2032)
Figure 12. France Grape Filling Revenue (USD Million) By Country (2021-2032)
Figure 13. United Kingdom Grape Filling Revenue (USD Million) By Country (2021-2032)
Figure 14. Spain Grape Filling Revenue (USD Million) By Country (2021-2032)
Figure 15. Italy Grape Filling Revenue (USD Million) By Country (2021-2032)
Figure 16. Russia Grape Filling Revenue (USD Million) By Country (2021-2032)
Figure 17. Rest of Europe Grape Filling Revenue (USD Million) By Country (2021-2032)
Figure 11. Asia Pacific Grape Filling Revenue (USD Million) By Country (2021-2032)
Figure 12. China Grape Filling Revenue (USD Million) By Country (2021-2032)
Figure 13. Japan Grape Filling Revenue (USD Million) By Country (2021-2032)
Figure 14. India Grape Filling Revenue (USD Million) By Country (2021-2032)
Figure 15. South Korea Grape Filling Revenue (USD Million) By Country (2021-2032)
Figure 16. Australia Grape Filling Revenue (USD Million) By Country (2021-2032)
Figure 17. South East Asia Grape Filling Revenue (USD Million) By Country (2021-2032)
Figure 18. South America Grape Filling Revenue (USD Million) By Country (2021-2032)
Figure 19. Brazil Grape Filling Revenue (USD Million) By Country (2021-2032)
Figure 20. Argentina Grape Filling Revenue (USD Million) By Country (2021-2032)
Figure 21. Rest of Asia Pacific Grape Filling Revenue (USD Million) By Country (2021-2032)
Figure 22. Middle East and Africa Grape Filling Revenue (USD Million) By Region (2021-2032)
Figure 23. Saudi Arabia Grape Filling Revenue (USD Million) By Region (2021-2032)
Figure 24. The UAE Grape Filling Revenue (USD Million) By Region (2021-2032)
Figure 25. Rest of Middle East Grape Filling Revenue (USD Million) By Region (2021-2032)
Figure 26. South Africa Grape Filling Revenue (USD Million) By Region (2021-2032)
Figure 27. Africa Grape Filling Revenue (USD Million) By Region (2021-2032)
Figure 28. North America Grape Filling Revenue (USD Million) By Type (2021-2032)
Figure 29. North America Grape Filling Revenue (USD Million) By Application (2021-2032)
Figure 30. North America Grape Filling Revenue (USD Million) By Product (2021-2032)
Figure 31. Europe Grape Filling Revenue (USD Million) By Type (2021-2032)
Figure 32. Europe Grape Filling Revenue (USD Million) By Application (2021-2032)
Figure 33. Europe Grape Filling Revenue (USD Million) By Product (2021-2032)
Figure 34. Asia Pacific Grape Filling Revenue (USD Million) By Type (2021-2032)
Figure 35. Asia Pacific Grape Filling Revenue (USD Million) By Application (2021-2032)
Figure 36. Asia Pacific Grape Filling Revenue (USD Million) By Product (2021-2032)
Figure 37. South America Grape Filling Revenue (USD Million) By Type (2021-2032)
Figure 38. South America Grape Filling Revenue (USD Million) By Application (2021-2032)
Figure 39. South America Grape Filling Revenue (USD Million) By Product (2021-2032)
Figure 40. Middle East and Africa Grape Filling Revenue (USD Million) By Type (2021-2032)
Figure 41. Middle East and Africa Grape Filling Revenue (USD Million) By Application (2021-2032)
Figure 42. Middle East and Africa Grape Filling Revenue (USD Million) By Product (2021-2032)
By Type
High Sugar Jam
Low Sugar Jam
By Application
Dairy
Baked Product
Ice-Cream
Others
Countries Analyzed
North America (US, Canada, Mexico)
Europe (Germany, UK, France, Spain, Italy, Russia, Rest of Europe)
Asia Pacific (China, India, Japan, South Korea, Australia, South East Asia, Rest of Asia)
South America (Brazil, Argentina, Rest of South America)
Middle East and Africa (Saudi Arabia, UAE, Rest of Middle East, South Africa, Egypt, Rest of Africa)
