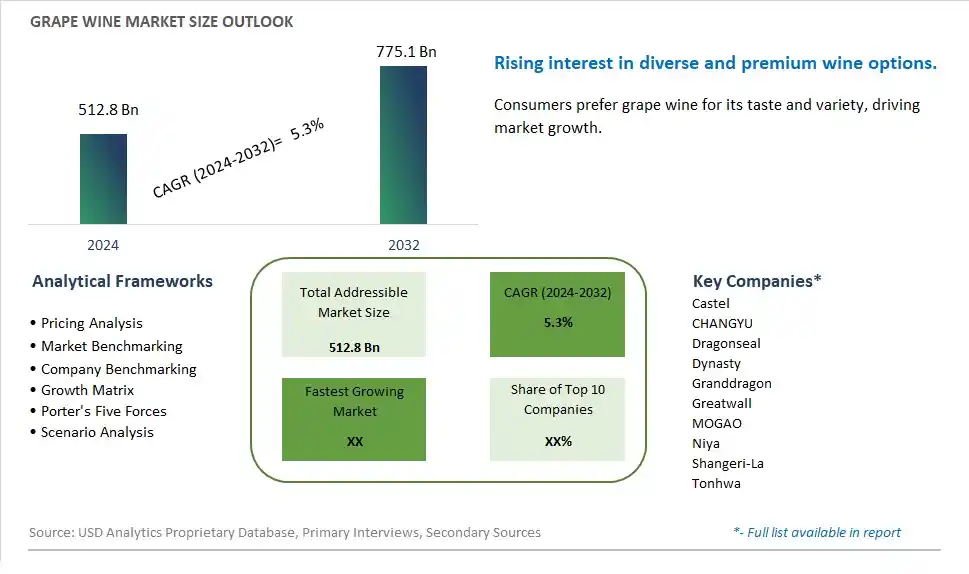
Global Grape Wine Market Size is valued at $512.8 Billion in 2024 and is forecast to register a growth rate (CAGR) of 5.3% to reach $775.1 Billion by 2032.
The global Grape Wine Market Comprehensive Study analyzes and forecasts the market size across 6 regions and 24 countries for diverse segments -By Type (Red Wine, White Wine, Rose Wine, Others), By Application (Commercial Consumption, Household Consumption, Others)
An Introduction to Grape Wine Market
In 2024, the Grape Wine market is thriving, fueled by the rising demand for premium and diverse wine options. Grape wine, produced from various grape varieties, is enjoyed for its rich flavors and cultural significance. The market benefits from advancements in viticulture and winemaking technologies, the growing trend of wine tourism and appreciation, and the expansion of the global alcoholic beverage sector. Additionally, the increasing focus on sustainable and organic wine production is contributing to market growth.
Grape Wine Competitive Landscape
The market report analyses the leading companies in the industry including Castel, CHANGYU, Dragonseal, Dynasty, Granddragon, Greatwall, MOGAO, Niya, Shangeri-La, Tonhwa, and Others.
Grape Wine Market Dynamics
Grape Wine Market Trend: Rising Popularity of Organic and Natural Wines
The most prominent trend in the Grape Wine Market is the rising popularity of organic and natural wines. As consumers become more health-conscious and environmentally aware, there is a growing preference for wines made from organically grown grapes and produced with minimal intervention. This trend is driven by the increasing demand for clean-label and sustainable alcoholic beverages.
Grape Wine Market Driver: Growth in Wine Consumption
The key driver of the Grape Wine Market is the growth in wine consumption. As more people enjoy wine as part of their lifestyle, there is a higher demand for diverse and high-quality wine options. This driver is supported by the trend towards premiumization in the wine industry and the increasing appreciation for artisanal and boutique wines, driving market growth.
Grape Wine Market Opportunity: Expansion into New Varietals and Blends
A significant opportunity in the Grape Wine Market lies in the expansion into new varietals and blends. By developing unique and innovative wine products that offer distinct flavors and aromas, companies can attract wine enthusiasts and connoisseurs. Offering a variety of wines that cater to different taste preferences and occasions can help expand market reach and drive growth in the wine sector.
Grape Wine Market Share Analysis: Red Wine segment generated the highest revenue share in the industry
In the Grape Wine Market, the largest segment by type is Red Wine. Red wine holds a significant share in the global wine market due to its popularity and diverse appeal among consumers worldwide. It is made from dark-colored grape varieties and undergoes fermentation with the grape skins, which gives it its characteristic color and flavor profile. Red wine is known for its complex flavors ranging from fruity to earthy tones, making it suitable for a wide range of occasions from casual dinners to formal events. The health benefits associated with moderate red wine consumption, such as antioxidant properties and potential cardiovascular benefits, further contribute to its widespread consumption globally.
Grape Wine Market Share Analysis: Household Consumption is the fastest growing segment over the forecast period to 2032
Looking at the Grape Wine Market by application, the fastest growing segment is Household Consumption. There is a growing trend towards wine consumption at home, driven by increasing disposable incomes, changing lifestyles, and a preference for enjoying wine in the comfort of one's own space. Household consumption includes wine enjoyed during meals, social gatherings, or as a relaxation beverage. The convenience of purchasing wine from supermarkets, specialty stores, or online platforms has made it more accessible to consumers for home consumption. Further, the rising popularity of wine culture, wine education, and food pairing at home has further propelled the demand for grape wine in household settings. Wineries and retailers are responding to this trend by offering a variety of wine styles, flavors, and packaging formats that cater to the diverse preferences of household consumers.
Grape Wine Market Segmentation
By Type
Red Wine
White Wine
Rose Wine
Others
By Application
Commercial Consumption
Household Consumption
Others
Countries Analyzed
North America (US, Canada, Mexico)
Europe (Germany, UK, France, Spain, Italy, Russia, Rest of Europe)
Asia Pacific (China, India, Japan, South Korea, Australia, South East Asia, Rest of Asia)
South America (Brazil, Argentina, Rest of South America)
Middle East and Africa (Saudi Arabia, UAE, Rest of Middle East, South Africa, Egypt, Rest of Africa)
Grape Wine Companies Profiled in the Study
Castel
CHANGYU
Dragonseal
Dynasty
Granddragon
Greatwall
MOGAO
Niya
Shangeri-La
Tonhwa
*- List Not Exhaustive
Chapter 1. TABLE OF CONTENTS
Chapter 2. Introduction to Grape Wine Market
2.1. Market Overview
2.2. Key Statistics and Report Highlights
2.3. Scope of the Comprehensive Study
2.3.1. Market Definition
2.3.2 Countries and Regions Covered
2.3.3 Research Objective
2.3.4 Units, Currency, and Conversions
2.3.5 Industry Value Chain
2.4. Key Market Segments
2.5. Key Companies
2.6. Study Period
Chapter 3. Strategic Analysis Review
3.1. Grape Wine Pricing Analysis and Forecast
3.2. Porter’s Five Forces
3.3. Market Ecosystem
3.4. SWOT Analysis
3.5. Regulatory Scenario
3.3. Effects of Inflation, Russia-Ukraine War, moderating economic growth, and other macroeconomic factors
Chapter 4. Competitive Landscape
4.1. Market Share Analysis
4.1.1. Global Grape Wine Market Share by Company, 2023
4.1.2. Product Offerings of Leading Grape Wine Companies
4.2. Market Entropy
4.2.1. New Product Launches in the Industry
4.2.2. Mergers, Acquisitions, Joint ventures, and Partnerships
4.3. Key Strategies and Best Practices
Chapter 5. Global Market Projections: Best, Reference, and Low Case Scenarios
5.1. Growth Analysis- Case Scenario Definitions
5.2. Low Growth Case Scenario Forecasts
5.3. Reference Growth Case Scenario Forecasts
5.4. High Growth Case Scenario Forecasts
Chapter 6. Market Dynamics
6.1. Grape Wine Market Drivers
6.2. Grape Wine Market Challenges
6.6. Grape Wine Market Opportunities
6.4. Grape Wine Market Trends
Chapter 7. Global Grape Wine Market Outlook Trends
7.1. Global Grape Wine Revenue (USD Million) and CAGR (%) by Type (2021-2032)
7.2. Global Grape Wine Revenue (USD Million) and CAGR (%) by Application (2021-2032)
7.3. Global Grape Wine Revenue (USD Million) and CAGR (%) by Product (2021-2032)
By Type
Red Wine
White Wine
Rose Wine
Others
By Application
Commercial Consumption
Household Consumption
Others
Chapter 8. Global Grape Wine Regional Analysis and Outlook
8.1. Global Grape Wine Revenue (USD Million) By Regions (2021- 2032)
8.2. North America Grape Wine Revenue (USD Million) by Country (2021-2032)
8.2.1. United States Grape Wine Regional Analysis and Outlook
8.2.2. Canada Grape Wine Regional Analysis and Outlook
8.2.3. Mexico Grape Wine Regional Analysis and Outlook
8.3. Europe Grape Wine Revenue (USD Million), by Country (2021-2032)
8.3.1. Germany Grape Wine Regional Analysis and Outlook
8.3.2. France Grape Wine Regional Analysis and Outlook
8.3.3. United Kingdom Grape Wine Regional Analysis and Outlook
8.3.4. Spain Grape Wine Regional Analysis and Outlook
8.3.5. Italy Grape Wine Regional Analysis and Outlook
8.3.6. Russia Grape Wine Regional Analysis and Outlook
8.3.7. Rest of Europe Grape Wine Regional Analysis and Outlook
8.4. Asia Pacific Grape Wine Revenue (USD Million) by Country (2021-2032)
8.4.1. China Grape Wine Regional Analysis and Outlook
8.4.2. Japan Grape Wine Regional Analysis and Outlook
8.4.3. India Grape Wine Regional Analysis and Outlook
8.4.4. South Korea Grape Wine Regional Analysis and Outlook
8.4.5. Australia Grape Wine Regional Analysis and Outlook
8.4.6. South East Asia Grape Wine Regional Analysis and Outlook
8.4.7. Rest of Asia Pacific Grape Wine Regional Analysis and Outlook
8.5. South America Grape Wine Revenue (USD Million), by Country (2021-2032)
8.5.1. Brazil Grape Wine Regional Analysis and Outlook
8.5.2. Argentina Grape Wine Regional Analysis and Outlook
8.5.3. Rest of South America Grape Wine Regional Analysis and Outlook
8.6. Middle East and Africa Grape Wine Revenue (USD Million) by Country (2021-2032)
8.6.1. Middle East Grape Wine Regional Analysis and Outlook
8.6.2. Africa Grape Wine Regional Analysis and Outlook
Chapter 9. North America Grape Wine Analysis and Outlook
9.1. North America Grape Wine Revenue (USD Million) by Segments (2021-2032)
9.1.1. North America Grape Wine Revenue (USD Million) by Type (2021-2032)
9.1.2. North America Grape Wine Revenue (USD Million) by Application (2021-2032)
9.1.3. North America Grape Wine Revenue (USD Million) by Product (2021-2032)
By Type
Red Wine
White Wine
Rose Wine
Others
By Application
Commercial Consumption
Household Consumption
Others
Chapter 10. Europe Grape Wine Analysis and Outlook
10.1. Europe Grape Wine Revenue (USD Million), by Segments (USD Million) (2021-2032)
10.1.1. Europe Grape Wine Revenue (USD Million) by Type (2021-2032)
10.1.2. Europe Grape Wine Revenue (USD Million) by Application (2021-2032)
10.1.3. Europe Grape Wine Revenue (USD Million) by Product (2021-2032)
By Type
Red Wine
White Wine
Rose Wine
Others
By Application
Commercial Consumption
Household Consumption
Others
Chapter 11. Asia Pacific Grape Wine Analysis and Outlook
11.1. Asia Pacific Grape Wine Revenue (USD Million), and Revenue (USD Million) by Segments (2021-2032)
11.1.1. Asia Pacific Grape Wine Revenue (USD Million) by Type (2021-2032)
11.1.2. Asia Pacific Grape Wine Revenue (USD Million) by Application (2021-2032)
11.1.3. Asia Pacific Grape Wine Revenue (USD Million) by Product (2021-2032)
By Type
Red Wine
White Wine
Rose Wine
Others
By Application
Commercial Consumption
Household Consumption
Others
Chapter 12. South America Grape Wine Analysis and Outlook
12.1. South America Grape Wine Revenue (USD Million), by Segments (2021-2032)
12.1.1. South America Grape Wine Revenue (USD Million) by Type (2021-2032)
12.1.2. South America Grape Wine Revenue (USD Million) by Application (2021-2032)
12.1.3. South America Grape Wine Revenue (USD Million) by Product (2021-2032)
By Type
Red Wine
White Wine
Rose Wine
Others
By Application
Commercial Consumption
Household Consumption
Others
Chapter 13. Middle East and Africa Grape Wine Analysis and Outlook
13.1. Middle East and Africa Grape Wine Revenue (USD Million), by Segments (2021-2032)
13.1.1. Middle East and Africa Grape Wine Revenue (USD Million) by Type (2021-2032)
13.1.2. Middle East and Africa Grape Wine Revenue (USD Million) by Application (2021-2032)
13.1.3. Middle East and Africa Grape Wine Revenue (USD Million) by Product (2021-2032)
By Type
Red Wine
White Wine
Rose Wine
Others
By Application
Commercial Consumption
Household Consumption
Others
Chapter 14. Grape Wine Company Profiles
14.1 Business Overview
14.2 Product Profiles
14.3 SWOT Profiles
14.5 Recent Developments
14.6 Financial Profile
List of Companies
Castel
CHANGYU
Dragonseal
Dynasty
Granddragon
Greatwall
MOGAO
Niya
Shangeri-La
Tonhwa
15. Methodology and Data Sources
15.1 Customization Offerings
15.2 Subscription Services
15.3 Related Reports
15.4 Publisher Expertise
LIST OF TABLES
Table 1 Market Segmentation Analysis
Table 2 Global Grape Wine Market Share of Leading Companies, 2023
Table 3 Product Offerings of Leading Companies
Table 4 Low Growth Scenario Forecasts
Table 5 Reference Case Growth Scenario
Table 6 High Growth Case Scenario
Table 7 Global Grape Wine Revenue (USD Million) And CAGR (%) By Type (2021-2032)
Table 8 Global Grape Wine Revenue (USD Million) And CAGR (%) By Application (2021-2032)
Table 9 Global Grape Wine Revenue (USD Million) And CAGR (%) By Product (2021-2032)
Table 10 Global Grape Wine Market Revenue (USD Million) By Regions (2021-2032)
Table 11 Global Grape Wine Market Share (%) By Regions (2021-2032)
Table 12 North America Grape Wine Revenue (USD Million) By Country (2021-2032)
Table 13 Europe Grape Wine Revenue (USD Million) By Country (2021-2032)
Table 14 Asia Pacific Grape Wine Revenue (USD Million) By Country (2021-2032)
Table 15 South America Grape Wine Revenue (USD Million) By Country (2021-2032)
Table 16 Middle East and Africa Grape Wine Revenue (USD Million) By Region (2021-2032)
Table 17 North America Grape Wine Revenue (USD Million) By Type (2021-2032)
Table 18 North America Grape Wine Revenue (USD Million) By Application (2021-2032)
Table 19 North America Grape Wine Revenue (USD Million) By Product (2021-2032)
Table 20 Europe Grape Wine Revenue (USD Million) By Type (2021-2032)
Table 21 Europe Grape Wine Revenue (USD Million) By Application (2021-2032)
Table 22 Europe Grape Wine Revenue (USD Million) By Product (2021-2032)
Table 23 Asia Pacific Grape Wine Revenue (USD Million) By Type (2021-2032)
Table 24 Asia Pacific Grape Wine Revenue (USD Million) By Application (2021-2032)
Table 25 Asia Pacific Grape Wine Revenue (USD Million) By Product (2021-2032)
Table 26 South America Grape Wine Revenue (USD Million) By Type (2021-2032)
Table 27 South America Grape Wine Revenue (USD Million) By Application (2021-2032)
Table 28 South America Grape Wine Revenue (USD Million) By Product (2021-2032)
Table 29 Middle East and Africa Grape Wine Revenue (USD Million) By Type (2021-2032)
Table 30 Middle East and Africa Grape Wine Revenue (USD Million) By Application (2021-2032)
Table 31 Middle East and Africa Grape Wine Revenue (USD Million) By Product (2021-2032)
LIST OF FIGURES
Figure 1. Market Scope
Figure 2. Pricing Forecasts Per Unit, 2023- 2032
Figure 3. Porter’s Five Forces
Figure 4. Global Grape Wine Market Revenue (USD Million) By Regions (2021-2032)
Figure 5. Global Grape Wine Market Share (%) By Regions (2023)
Figure 6. North America Grape Wine Revenue (USD Million) By Country (2021-2032)
Figure 7. United States Grape Wine Revenue (USD Million) By Country (2021-2032)
Figure 8. Canada Grape Wine Revenue (USD Million) By Country (2021-2032)
Figure 9. Mexico Grape Wine Revenue (USD Million) By Country (2021-2032)
Figure 10. Europe Grape Wine Revenue (USD Million) By Country (2021-2032)
Figure 11. Germany Grape Wine Revenue (USD Million) By Country (2021-2032)
Figure 12. France Grape Wine Revenue (USD Million) By Country (2021-2032)
Figure 13. United Kingdom Grape Wine Revenue (USD Million) By Country (2021-2032)
Figure 14. Spain Grape Wine Revenue (USD Million) By Country (2021-2032)
Figure 15. Italy Grape Wine Revenue (USD Million) By Country (2021-2032)
Figure 16. Russia Grape Wine Revenue (USD Million) By Country (2021-2032)
Figure 17. Rest of Europe Grape Wine Revenue (USD Million) By Country (2021-2032)
Figure 11. Asia Pacific Grape Wine Revenue (USD Million) By Country (2021-2032)
Figure 12. China Grape Wine Revenue (USD Million) By Country (2021-2032)
Figure 13. Japan Grape Wine Revenue (USD Million) By Country (2021-2032)
Figure 14. India Grape Wine Revenue (USD Million) By Country (2021-2032)
Figure 15. South Korea Grape Wine Revenue (USD Million) By Country (2021-2032)
Figure 16. Australia Grape Wine Revenue (USD Million) By Country (2021-2032)
Figure 17. South East Asia Grape Wine Revenue (USD Million) By Country (2021-2032)
Figure 18. South America Grape Wine Revenue (USD Million) By Country (2021-2032)
Figure 19. Brazil Grape Wine Revenue (USD Million) By Country (2021-2032)
Figure 20. Argentina Grape Wine Revenue (USD Million) By Country (2021-2032)
Figure 21. Rest of Asia Pacific Grape Wine Revenue (USD Million) By Country (2021-2032)
Figure 22. Middle East and Africa Grape Wine Revenue (USD Million) By Region (2021-2032)
Figure 23. Saudi Arabia Grape Wine Revenue (USD Million) By Region (2021-2032)
Figure 24. The UAE Grape Wine Revenue (USD Million) By Region (2021-2032)
Figure 25. Rest of Middle East Grape Wine Revenue (USD Million) By Region (2021-2032)
Figure 26. South Africa Grape Wine Revenue (USD Million) By Region (2021-2032)
Figure 27. Africa Grape Wine Revenue (USD Million) By Region (2021-2032)
Figure 28. North America Grape Wine Revenue (USD Million) By Type (2021-2032)
Figure 29. North America Grape Wine Revenue (USD Million) By Application (2021-2032)
Figure 30. North America Grape Wine Revenue (USD Million) By Product (2021-2032)
Figure 31. Europe Grape Wine Revenue (USD Million) By Type (2021-2032)
Figure 32. Europe Grape Wine Revenue (USD Million) By Application (2021-2032)
Figure 33. Europe Grape Wine Revenue (USD Million) By Product (2021-2032)
Figure 34. Asia Pacific Grape Wine Revenue (USD Million) By Type (2021-2032)
Figure 35. Asia Pacific Grape Wine Revenue (USD Million) By Application (2021-2032)
Figure 36. Asia Pacific Grape Wine Revenue (USD Million) By Product (2021-2032)
Figure 37. South America Grape Wine Revenue (USD Million) By Type (2021-2032)
Figure 38. South America Grape Wine Revenue (USD Million) By Application (2021-2032)
Figure 39. South America Grape Wine Revenue (USD Million) By Product (2021-2032)
Figure 40. Middle East and Africa Grape Wine Revenue (USD Million) By Type (2021-2032)
Figure 41. Middle East and Africa Grape Wine Revenue (USD Million) By Application (2021-2032)
Figure 42. Middle East and Africa Grape Wine Revenue (USD Million) By Product (2021-2032)
By Type
Red Wine
White Wine
Rose Wine
Others
By Application
Commercial Consumption
Household Consumption
Others
Countries Analyzed
North America (US, Canada, Mexico)
Europe (Germany, UK, France, Spain, Italy, Russia, Rest of Europe)
Asia Pacific (China, India, Japan, South Korea, Australia, South East Asia, Rest of Asia)
South America (Brazil, Argentina, Rest of South America)
Middle East and Africa (Saudi Arabia, UAE, Rest of Middle East, South Africa, Egypt, Rest of Africa)
