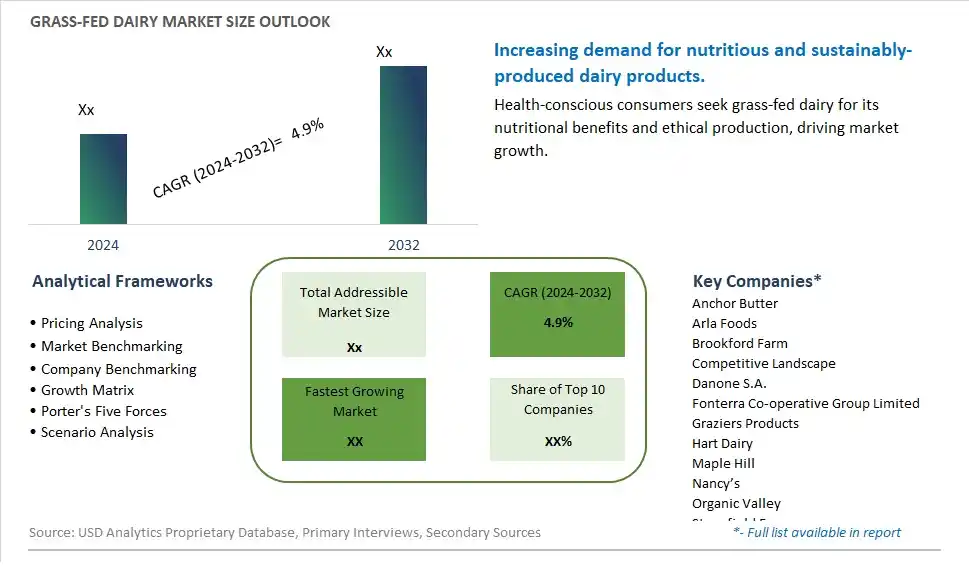
Global Grass-Fed Dairy Market Size is valued at $XX Million in 2024 and is forecast to register a growth rate (CAGR) of 4.9% to reach $XX Million by 2032.
The global Grass-Fed Dairy Market Comprehensive Study analyzes and forecasts the market size across 6 regions and 24 countries for diverse segments -By Type (Milk, Yogurt, Butter, Cream, Others), By Application (Online Shopping, Retailer, Supermarket, Others)
An Introduction to Grass-Fed Dairy Market
The Grass-Fed Dairy Market involves the production and sale of dairy products sourced from grass-fed cows, which are perceived to be healthier and more sustainable. These products include milk, cheese, yogurt, and butter. The market is driven by increasing consumer demand for natural and organic foods, rising awareness about the benefits of grass-fed dairy, and growing preference for sustainable and ethical food production practices. Additionally, advancements in dairy farming and processing technologies support market growth.
Grass Fed Dairy Competitive Landscape
The market report analyses the leading companies in the industry including Anchor Butter, Arla Foods, Brookford Farm, Competitive Landscape, Danone S.A., Fonterra Co-operative Group Limited, Graziers Products, Hart Dairy, Maple Hill, Nancy’s, Organic Valley, Stonyfield Farm, Vital Farms, Yoplait, and Others.
Grass Fed Dairy Market Dynamics
Grass-Fed Dairy Market Trend: Increasing Popularity of Grass-Fed and Organic Dairy
The most prominent trend in the Grass-Fed Dairy Market is the increasing popularity of grass-fed and organic dairy products. As consumers seek healthier and more sustainable options, grass-fed dairy is gaining traction for its perceived nutritional benefits and eco-friendly production methods. This trend is driven by the growing demand for clean-label and premium dairy products.
Grass-Fed Dairy Market Driver: Growth in Health and Environmental Awareness
The key driver of the Grass-Fed Dairy Market is the growth in health and environmental awareness. As more people focus on maintaining a healthy diet and reducing their environmental impact, there is a higher demand for dairy products that offer superior nutritional value and are produced sustainably. This driver is supported by the trend towards functional foods and the increasing availability of grass-fed dairy products in the market, driving growth for grass-fed dairy.
Grass-Fed Dairy Market Opportunity: Innovation in Dairy Product Development
A significant opportunity in the Grass-Fed Dairy Market lies in innovation in dairy product development. By creating new and unique grass-fed dairy products, such as yogurt, butter, and cheese, companies can attract health-conscious consumers looking for nutritious and sustainable options. Offering high-quality grass-fed dairy products that cater to diverse dietary preferences can help expand market reach and drive growth in the premium dairy sector.
Grass-Fed Dairy Market Share Analysis- Largest Segment by Type
The Milk segment is the largest in the Grass-Fed Dairy Market by type. This dominance is driven by the high consumer demand for grass-fed milk, which is perceived as healthier and more nutritious compared to conventional milk. Grass-fed milk is known for its higher content of omega-3 fatty acids, conjugated linoleic acid (CLA), and essential vitamins, making it a popular choice among health-conscious consumers. The continuous innovation in grass-fed milk products, including the introduction of organic and fortified options, enhances their appeal. Additionally, the growing trend of clean-label and natural products supports the significant market share of the milk segment, as consumers seek dairy products that are free from artificial additives and produced in an environmentally sustainable manner. The extensive availability of grass-fed milk in supermarkets, health food stores, and online platforms further boosts its accessibility to a broad consumer base. The strong consumer preference for high-quality and nutritious dairy products reinforces the dominant position of the milk segment in the market.
Grass-Fed Dairy Market Share Analysis- Fastest Growing Segment by Application
The Online Shopping segment is poised to grow the fastest in the Grass-Fed Dairy Market by application over the next five years. This rapid growth is driven by the increasing consumer preference for the convenience and accessibility of online shopping. E-commerce platforms provide a wide variety of grass-fed dairy products, including niche and specialty items that may not be readily available in physical stores. The convenience of browsing and purchasing from home, coupled with the option of home delivery, appeals to a broad range of consumers. The COVID-19 pandemic has further accelerated the adoption of online shopping, and this trend continues as consumers appreciate the safety and convenience of having products delivered to their doorstep. Additionally, online retailers often offer competitive pricing, detailed product information, and customer reviews, which further drive consumer confidence and sales. The growth of digital marketing and targeted online advertisements also boosts the visibility and sales of grass-fed dairy products through e-commerce channels.
Grass Fed Dairy Market Segmentation
By Type
Milk
Yogurt
Butter
Cream
Others
By Application
Online Shopping
Retailer
Supermarket
Others
Countries Analyzed
North America (US, Canada, Mexico)
Europe (Germany, UK, France, Spain, Italy, Russia, Rest of Europe)
Asia Pacific (China, India, Japan, South Korea, Australia, South East Asia, Rest of Asia)
South America (Brazil, Argentina, Rest of South America)
Middle East and Africa (Saudi Arabia, UAE, Rest of Middle East, South Africa, Egypt, Rest of Africa)
Grass Fed Dairy Companies Profiled in the Study
Anchor Butter
Arla Foods
Brookford Farm
Competitive Landscape
Danone S.A.
Fonterra Co-operative Group Limited
Graziers Products
Hart Dairy
Maple Hill
Nancy’s
Organic Valley
Stonyfield Farm
Vital Farms
Yoplait
*- List Not Exhaustive
Chapter 1. TABLE OF CONTENTS
Chapter 2. Introduction to Grass Fed Dairy Market
2.1. Market Overview
2.2. Key Statistics and Report Highlights
2.3. Scope of the Comprehensive Study
2.3.1. Market Definition
2.3.2 Countries and Regions Covered
2.3.3 Research Objective
2.3.4 Units, Currency, and Conversions
2.3.5 Industry Value Chain
2.4. Key Market Segments
2.5. Key Companies
2.6. Study Period
Chapter 3. Strategic Analysis Review
3.1. Grass Fed Dairy Pricing Analysis and Forecast
3.2. Porter’s Five Forces
3.3. Market Ecosystem
3.4. SWOT Analysis
3.5. Regulatory Scenario
3.3. Effects of Inflation, Russia-Ukraine War, moderating economic growth, and other macroeconomic factors
Chapter 4. Competitive Landscape
4.1. Market Share Analysis
4.1.1. Global Grass Fed Dairy Market Share by Company, 2023
4.1.2. Product Offerings of Leading Grass Fed Dairy Companies
4.2. Market Entropy
4.2.1. New Product Launches in the Industry
4.2.2. Mergers, Acquisitions, Joint ventures, and Partnerships
4.3. Key Strategies and Best Practices
Chapter 5. Global Market Projections: Best, Reference, and Low Case Scenarios
5.1. Growth Analysis- Case Scenario Definitions
5.2. Low Growth Case Scenario Forecasts
5.3. Reference Growth Case Scenario Forecasts
5.4. High Growth Case Scenario Forecasts
Chapter 6. Market Dynamics
6.1. Grass Fed Dairy Market Drivers
6.2. Grass Fed Dairy Market Challenges
6.6. Grass Fed Dairy Market Opportunities
6.4. Grass Fed Dairy Market Trends
Chapter 7. Global Grass Fed Dairy Market Outlook Trends
7.1. Global Grass Fed Dairy Revenue (USD Million) and CAGR (%) by Type (2021-2032)
7.2. Global Grass Fed Dairy Revenue (USD Million) and CAGR (%) by Application (2021-2032)
7.3. Global Grass Fed Dairy Revenue (USD Million) and CAGR (%) by Product (2021-2032)
By Type
Milk
Yogurt
Butter
Cream
Others
By Application
Online Shopping
Retailer
Supermarket
Others
Chapter 8. Global Grass Fed Dairy Regional Analysis and Outlook
8.1. Global Grass Fed Dairy Revenue (USD Million) By Regions (2021- 2032)
8.2. North America Grass Fed Dairy Revenue (USD Million) by Country (2021-2032)
8.2.1. United States Grass Fed Dairy Regional Analysis and Outlook
8.2.2. Canada Grass Fed Dairy Regional Analysis and Outlook
8.2.3. Mexico Grass Fed Dairy Regional Analysis and Outlook
8.3. Europe Grass Fed Dairy Revenue (USD Million), by Country (2021-2032)
8.3.1. Germany Grass Fed Dairy Regional Analysis and Outlook
8.3.2. France Grass Fed Dairy Regional Analysis and Outlook
8.3.3. United Kingdom Grass Fed Dairy Regional Analysis and Outlook
8.3.4. Spain Grass Fed Dairy Regional Analysis and Outlook
8.3.5. Italy Grass Fed Dairy Regional Analysis and Outlook
8.3.6. Russia Grass Fed Dairy Regional Analysis and Outlook
8.3.7. Rest of Europe Grass Fed Dairy Regional Analysis and Outlook
8.4. Asia Pacific Grass Fed Dairy Revenue (USD Million) by Country (2021-2032)
8.4.1. China Grass Fed Dairy Regional Analysis and Outlook
8.4.2. Japan Grass Fed Dairy Regional Analysis and Outlook
8.4.3. India Grass Fed Dairy Regional Analysis and Outlook
8.4.4. South Korea Grass Fed Dairy Regional Analysis and Outlook
8.4.5. Australia Grass Fed Dairy Regional Analysis and Outlook
8.4.6. South East Asia Grass Fed Dairy Regional Analysis and Outlook
8.4.7. Rest of Asia Pacific Grass Fed Dairy Regional Analysis and Outlook
8.5. South America Grass Fed Dairy Revenue (USD Million), by Country (2021-2032)
8.5.1. Brazil Grass Fed Dairy Regional Analysis and Outlook
8.5.2. Argentina Grass Fed Dairy Regional Analysis and Outlook
8.5.3. Rest of South America Grass Fed Dairy Regional Analysis and Outlook
8.6. Middle East and Africa Grass Fed Dairy Revenue (USD Million) by Country (2021-2032)
8.6.1. Middle East Grass Fed Dairy Regional Analysis and Outlook
8.6.2. Africa Grass Fed Dairy Regional Analysis and Outlook
Chapter 9. North America Grass Fed Dairy Analysis and Outlook
9.1. North America Grass Fed Dairy Revenue (USD Million) by Segments (2021-2032)
9.1.1. North America Grass Fed Dairy Revenue (USD Million) by Type (2021-2032)
9.1.2. North America Grass Fed Dairy Revenue (USD Million) by Application (2021-2032)
9.1.3. North America Grass Fed Dairy Revenue (USD Million) by Product (2021-2032)
By Type
Milk
Yogurt
Butter
Cream
Others
By Application
Online Shopping
Retailer
Supermarket
Others
Chapter 10. Europe Grass Fed Dairy Analysis and Outlook
10.1. Europe Grass Fed Dairy Revenue (USD Million), by Segments (USD Million) (2021-2032)
10.1.1. Europe Grass Fed Dairy Revenue (USD Million) by Type (2021-2032)
10.1.2. Europe Grass Fed Dairy Revenue (USD Million) by Application (2021-2032)
10.1.3. Europe Grass Fed Dairy Revenue (USD Million) by Product (2021-2032)
By Type
Milk
Yogurt
Butter
Cream
Others
By Application
Online Shopping
Retailer
Supermarket
Others
Chapter 11. Asia Pacific Grass Fed Dairy Analysis and Outlook
11.1. Asia Pacific Grass Fed Dairy Revenue (USD Million), and Revenue (USD Million) by Segments (2021-2032)
11.1.1. Asia Pacific Grass Fed Dairy Revenue (USD Million) by Type (2021-2032)
11.1.2. Asia Pacific Grass Fed Dairy Revenue (USD Million) by Application (2021-2032)
11.1.3. Asia Pacific Grass Fed Dairy Revenue (USD Million) by Product (2021-2032)
By Type
Milk
Yogurt
Butter
Cream
Others
By Application
Online Shopping
Retailer
Supermarket
Others
Chapter 12. South America Grass Fed Dairy Analysis and Outlook
12.1. South America Grass Fed Dairy Revenue (USD Million), by Segments (2021-2032)
12.1.1. South America Grass Fed Dairy Revenue (USD Million) by Type (2021-2032)
12.1.2. South America Grass Fed Dairy Revenue (USD Million) by Application (2021-2032)
12.1.3. South America Grass Fed Dairy Revenue (USD Million) by Product (2021-2032)
By Type
Milk
Yogurt
Butter
Cream
Others
By Application
Online Shopping
Retailer
Supermarket
Others
Chapter 13. Middle East and Africa Grass Fed Dairy Analysis and Outlook
13.1. Middle East and Africa Grass Fed Dairy Revenue (USD Million), by Segments (2021-2032)
13.1.1. Middle East and Africa Grass Fed Dairy Revenue (USD Million) by Type (2021-2032)
13.1.2. Middle East and Africa Grass Fed Dairy Revenue (USD Million) by Application (2021-2032)
13.1.3. Middle East and Africa Grass Fed Dairy Revenue (USD Million) by Product (2021-2032)
By Type
Milk
Yogurt
Butter
Cream
Others
By Application
Online Shopping
Retailer
Supermarket
Others
Chapter 14. Grass Fed Dairy Company Profiles
14.1 Business Overview
14.2 Product Profiles
14.3 SWOT Profiles
14.5 Recent Developments
14.6 Financial Profile
List of Companies
Anchor Butter
Arla Foods
Brookford Farm
Competitive Landscape
Danone S.A.
Fonterra Co-operative Group Limited
Graziers Products
Hart Dairy
Maple Hill
Nancy’s
Organic Valley
Stonyfield Farm
Vital Farms
Yoplait
15. Methodology and Data Sources
15.1 Customization Offerings
15.2 Subscription Services
15.3 Related Reports
15.4 Publisher Expertise
LIST OF TABLES
Table 1 Market Segmentation Analysis
Table 2 Global Grass Fed Dairy Market Share of Leading Companies, 2023
Table 3 Product Offerings of Leading Companies
Table 4 Low Growth Scenario Forecasts
Table 5 Reference Case Growth Scenario
Table 6 High Growth Case Scenario
Table 7 Global Grass Fed Dairy Revenue (USD Million) And CAGR (%) By Type (2021-2032)
Table 8 Global Grass Fed Dairy Revenue (USD Million) And CAGR (%) By Application (2021-2032)
Table 9 Global Grass Fed Dairy Revenue (USD Million) And CAGR (%) By Product (2021-2032)
Table 10 Global Grass Fed Dairy Market Revenue (USD Million) By Regions (2021-2032)
Table 11 Global Grass Fed Dairy Market Share (%) By Regions (2021-2032)
Table 12 North America Grass Fed Dairy Revenue (USD Million) By Country (2021-2032)
Table 13 Europe Grass Fed Dairy Revenue (USD Million) By Country (2021-2032)
Table 14 Asia Pacific Grass Fed Dairy Revenue (USD Million) By Country (2021-2032)
Table 15 South America Grass Fed Dairy Revenue (USD Million) By Country (2021-2032)
Table 16 Middle East and Africa Grass Fed Dairy Revenue (USD Million) By Region (2021-2032)
Table 17 North America Grass Fed Dairy Revenue (USD Million) By Type (2021-2032)
Table 18 North America Grass Fed Dairy Revenue (USD Million) By Application (2021-2032)
Table 19 North America Grass Fed Dairy Revenue (USD Million) By Product (2021-2032)
Table 20 Europe Grass Fed Dairy Revenue (USD Million) By Type (2021-2032)
Table 21 Europe Grass Fed Dairy Revenue (USD Million) By Application (2021-2032)
Table 22 Europe Grass Fed Dairy Revenue (USD Million) By Product (2021-2032)
Table 23 Asia Pacific Grass Fed Dairy Revenue (USD Million) By Type (2021-2032)
Table 24 Asia Pacific Grass Fed Dairy Revenue (USD Million) By Application (2021-2032)
Table 25 Asia Pacific Grass Fed Dairy Revenue (USD Million) By Product (2021-2032)
Table 26 South America Grass Fed Dairy Revenue (USD Million) By Type (2021-2032)
Table 27 South America Grass Fed Dairy Revenue (USD Million) By Application (2021-2032)
Table 28 South America Grass Fed Dairy Revenue (USD Million) By Product (2021-2032)
Table 29 Middle East and Africa Grass Fed Dairy Revenue (USD Million) By Type (2021-2032)
Table 30 Middle East and Africa Grass Fed Dairy Revenue (USD Million) By Application (2021-2032)
Table 31 Middle East and Africa Grass Fed Dairy Revenue (USD Million) By Product (2021-2032)
LIST OF FIGURES
Figure 1. Market Scope
Figure 2. Pricing Forecasts Per Unit, 2023- 2032
Figure 3. Porter’s Five Forces
Figure 4. Global Grass Fed Dairy Market Revenue (USD Million) By Regions (2021-2032)
Figure 5. Global Grass Fed Dairy Market Share (%) By Regions (2023)
Figure 6. North America Grass Fed Dairy Revenue (USD Million) By Country (2021-2032)
Figure 7. United States Grass Fed Dairy Revenue (USD Million) By Country (2021-2032)
Figure 8. Canada Grass Fed Dairy Revenue (USD Million) By Country (2021-2032)
Figure 9. Mexico Grass Fed Dairy Revenue (USD Million) By Country (2021-2032)
Figure 10. Europe Grass Fed Dairy Revenue (USD Million) By Country (2021-2032)
Figure 11. Germany Grass Fed Dairy Revenue (USD Million) By Country (2021-2032)
Figure 12. France Grass Fed Dairy Revenue (USD Million) By Country (2021-2032)
Figure 13. United Kingdom Grass Fed Dairy Revenue (USD Million) By Country (2021-2032)
Figure 14. Spain Grass Fed Dairy Revenue (USD Million) By Country (2021-2032)
Figure 15. Italy Grass Fed Dairy Revenue (USD Million) By Country (2021-2032)
Figure 16. Russia Grass Fed Dairy Revenue (USD Million) By Country (2021-2032)
Figure 17. Rest of Europe Grass Fed Dairy Revenue (USD Million) By Country (2021-2032)
Figure 11. Asia Pacific Grass Fed Dairy Revenue (USD Million) By Country (2021-2032)
Figure 12. China Grass Fed Dairy Revenue (USD Million) By Country (2021-2032)
Figure 13. Japan Grass Fed Dairy Revenue (USD Million) By Country (2021-2032)
Figure 14. India Grass Fed Dairy Revenue (USD Million) By Country (2021-2032)
Figure 15. South Korea Grass Fed Dairy Revenue (USD Million) By Country (2021-2032)
Figure 16. Australia Grass Fed Dairy Revenue (USD Million) By Country (2021-2032)
Figure 17. South East Asia Grass Fed Dairy Revenue (USD Million) By Country (2021-2032)
Figure 18. South America Grass Fed Dairy Revenue (USD Million) By Country (2021-2032)
Figure 19. Brazil Grass Fed Dairy Revenue (USD Million) By Country (2021-2032)
Figure 20. Argentina Grass Fed Dairy Revenue (USD Million) By Country (2021-2032)
Figure 21. Rest of Asia Pacific Grass Fed Dairy Revenue (USD Million) By Country (2021-2032)
Figure 22. Middle East and Africa Grass Fed Dairy Revenue (USD Million) By Region (2021-2032)
Figure 23. Saudi Arabia Grass Fed Dairy Revenue (USD Million) By Region (2021-2032)
Figure 24. The UAE Grass Fed Dairy Revenue (USD Million) By Region (2021-2032)
Figure 25. Rest of Middle East Grass Fed Dairy Revenue (USD Million) By Region (2021-2032)
Figure 26. South Africa Grass Fed Dairy Revenue (USD Million) By Region (2021-2032)
Figure 27. Africa Grass Fed Dairy Revenue (USD Million) By Region (2021-2032)
Figure 28. North America Grass Fed Dairy Revenue (USD Million) By Type (2021-2032)
Figure 29. North America Grass Fed Dairy Revenue (USD Million) By Application (2021-2032)
Figure 30. North America Grass Fed Dairy Revenue (USD Million) By Product (2021-2032)
Figure 31. Europe Grass Fed Dairy Revenue (USD Million) By Type (2021-2032)
Figure 32. Europe Grass Fed Dairy Revenue (USD Million) By Application (2021-2032)
Figure 33. Europe Grass Fed Dairy Revenue (USD Million) By Product (2021-2032)
Figure 34. Asia Pacific Grass Fed Dairy Revenue (USD Million) By Type (2021-2032)
Figure 35. Asia Pacific Grass Fed Dairy Revenue (USD Million) By Application (2021-2032)
Figure 36. Asia Pacific Grass Fed Dairy Revenue (USD Million) By Product (2021-2032)
Figure 37. South America Grass Fed Dairy Revenue (USD Million) By Type (2021-2032)
Figure 38. South America Grass Fed Dairy Revenue (USD Million) By Application (2021-2032)
Figure 39. South America Grass Fed Dairy Revenue (USD Million) By Product (2021-2032)
Figure 40. Middle East and Africa Grass Fed Dairy Revenue (USD Million) By Type (2021-2032)
Figure 41. Middle East and Africa Grass Fed Dairy Revenue (USD Million) By Application (2021-2032)
Figure 42. Middle East and Africa Grass Fed Dairy Revenue (USD Million) By Product (2021-2032)
By Type
Milk
Yogurt
Butter
Cream
Others
By Application
Online Shopping
Retailer
Supermarket
Others
Countries Analyzed
North America (US, Canada, Mexico)
Europe (Germany, UK, France, Spain, Italy, Russia, Rest of Europe)
Asia Pacific (China, India, Japan, South Korea, Australia, South East Asia, Rest of Asia)
South America (Brazil, Argentina, Rest of South America)
Middle East and Africa (Saudi Arabia, UAE, Rest of Middle East, South Africa, Egypt, Rest of Africa)
