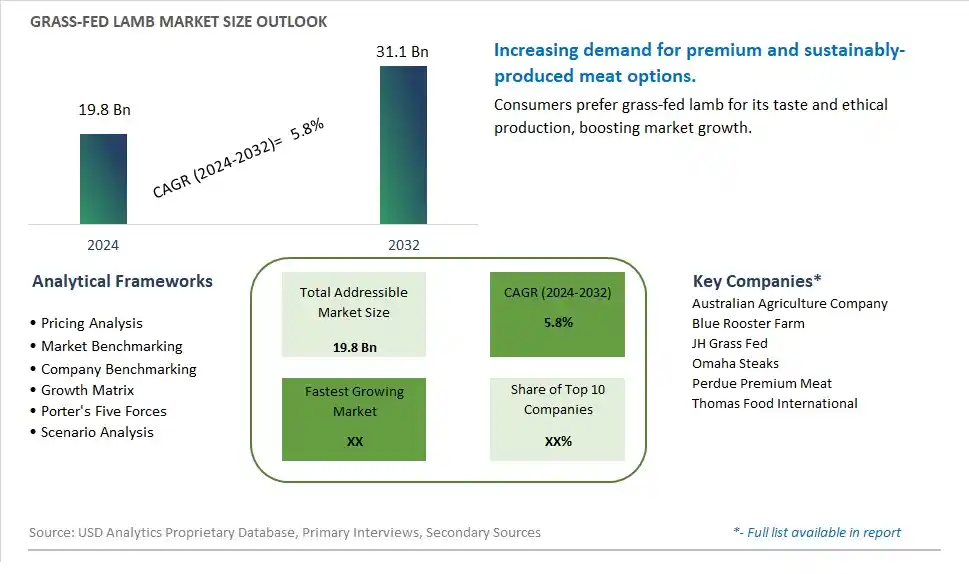
Global Grass-fed Lamb Market Size is valued at $19.8 Billion in 2024 and is forecast to register a growth rate (CAGR) of 5.8% to reach $31.1 Billion by 2032.
The global Grass-fed Lamb Market Comprehensive Study analyzes and forecasts the market size across 6 regions and 24 countries for diverse segments -By Type (Rack of Lamb, Organ Meats, Others), By End-User (HoReCa, Food Processing, Household), By Sales Channel (Convenience Stores, Hypermarkets/Supermarkets, Online Retail Stores, Meat Stores, Others)
An Introduction to Grass-fed Lamb Market
The Grass-Fed Lamb Market involves the production and sale of lamb meat sourced from grass-fed sheep, which is perceived to be healthier and more sustainable. The market is driven by increasing consumer demand for natural and organic meats, rising awareness about the benefits of grass-fed meat, and growing preference for sustainable and ethical food production practices. Additionally, advancements in sheep farming and meat processing technologies support market growth.
Grass-fed Lamb Competitive Landscape
The market report analyses the leading companies in the industry including Australian Agriculture Company, Blue Rooster Farm, JH Grass Fed, Omaha Steaks, Perdue Premium Meat, Thomas Food International, and Others.
Grass-fed Lamb Market Dynamics
Grass-fed Lamb Market Trend: Increasing Demand for Sustainable and Ethical Meat
The most prominent trend in the Grass-fed Lamb Market is the increasing demand for sustainable and ethical meat. As consumers become more aware of the environmental and ethical implications of meat production, grass-fed lamb is gaining popularity for its sustainable and humane farming practices. This trend is driven by the growing interest in sustainable food choices that support animal welfare and environmental conservation.
Grass-fed Lamb Market Driver: Growth in Health and Wellness Consciousness
The key driver of the Grass-fed Lamb Market is the growth in health and wellness consciousness. As more people focus on incorporating high-quality protein sources into their diets, there is a higher demand for grass-fed lamb, which is perceived as healthier and more nutritious. This driver is supported by the trend towards functional foods and the increasing awareness of the benefits of grass-fed meat, driving market growth for grass-fed lamb.
Grass-fed Lamb Market Opportunity: Development of Premium and Specialty Meat Products
A significant opportunity in the Grass-fed Lamb Market lies in the development of premium and specialty meat products. By offering high-quality grass-fed lamb that caters to gourmet tastes and dietary preferences, companies can attract discerning consumers. Developing innovative packaging and marketing strategies that emphasize the sustainability and nutritional benefits of grass-fed lamb can help expand market reach and drive growth in the premium meat sector.
Grass-fed Lamb Market Share Analysis- Largest Segment by Type
The Rack of Lamb segment is the largest in the Grass-fed Lamb Market by type. This dominance is driven by the high consumer demand for premium cuts of lamb that are known for their tenderness, flavor, and versatility in gourmet cooking. Rack of lamb is a favored choice in fine dining and special occasions, where its presentation and taste are highly valued. The continuous innovation in culinary techniques and recipes that highlight the quality of grass-fed rack of lamb enhances its appeal. Additionally, the growing trend of farm-to-table dining and the increasing awareness of the health benefits and ethical considerations of grass-fed meats support the significant market share of the rack of lamb segment. The extensive availability of rack of lamb in specialty meat stores, gourmet supermarkets, and online platforms further boosts its accessibility to a broad consumer base. The strong consumer preference for high-quality and flavorful lamb cuts reinforces the dominant position of the rack of lamb segment in the market.
Grass-fed Lamb Market Share Analysis- Fastest Growing Segment by End-User
The HoReCa (Hotel, Restaurant, and Catering) segment is poised to grow the fastest in the Grass-fed Lamb Market by end-user over the next five years. This rapid growth is driven by the increasing demand for high-quality and sustainably sourced lamb in the hospitality and foodservice industry. Grass-fed lamb is preferred for its superior flavor, nutritional profile, and ethical production practices, making it a popular choice in premium dining establishments and catering services. The continuous innovation in culinary offerings and the growing trend of gourmet and farm-to-table dining support the fast growth of this segment. Additionally, the expanding hospitality industry, particularly in emerging markets, and the increasing focus on providing diverse and high-quality menu options contribute to the rapid growth of the HoReCa segment. The influence of chefs and food influencers in promoting the benefits and unique flavors of grass-fed lamb also drives its demand in this sector.
Grass-fed Lamb Market Share Analysis- Largest Segment by Sales Channel
The Hypermarkets/Supermarkets segment is the largest in the Grass-fed Lamb Market by sales channel. This dominance is driven by the high consumer preference for purchasing meat products from hypermarkets and supermarkets due to their convenience, wide product selection, and competitive pricing. Hypermarkets and supermarkets offer an extensive range of grass-fed lamb products, including popular cuts and ready-to-cook options, catering to diverse consumer needs. The continuous innovation in product displays, promotional activities, and in-store experiences enhances the appeal of hypermarkets and supermarkets as preferred shopping destinations for meat products. Additionally, the growing trend of one-stop shopping and the increasing availability of grass-fed lamb in the meat sections of hypermarkets and supermarkets support their significant market share. The strong consumer preference for convenience and variety reinforces the dominant position of the hypermarkets/supermarkets segment in the market.
Grass-fed Lamb Market Segmentation
By Type
Rack of Lamb
Organ Meats
Others
By End-User
HoReCa
Food Processing
Household
By Sales Channel
Convenience Stores
Hypermarkets/Supermarkets
Online Retail Stores
Meat Stores
Others
Countries Analyzed
North America (US, Canada, Mexico)
Europe (Germany, UK, France, Spain, Italy, Russia, Rest of Europe)
Asia Pacific (China, India, Japan, South Korea, Australia, South East Asia, Rest of Asia)
South America (Brazil, Argentina, Rest of South America)
Middle East and Africa (Saudi Arabia, UAE, Rest of Middle East, South Africa, Egypt, Rest of Africa)
Grass-fed Lamb Companies Profiled in the Study
Australian Agriculture Company
Blue Rooster Farm
JH Grass Fed
Omaha Steaks
Perdue Premium Meat
Thomas Food International
*- List Not Exhaustive
Chapter 1. TABLE OF CONTENTS
Chapter 2. Introduction to Grass-fed Lamb Market
2.1. Market Overview
2.2. Key Statistics and Report Highlights
2.3. Scope of the Comprehensive Study
2.3.1. Market Definition
2.3.2 Countries and Regions Covered
2.3.3 Research Objective
2.3.4 Units, Currency, and Conversions
2.3.5 Industry Value Chain
2.4. Key Market Segments
2.5. Key Companies
2.6. Study Period
Chapter 3. Strategic Analysis Review
3.1. Grass-fed Lamb Pricing Analysis and Forecast
3.2. Porter’s Five Forces
3.3. Market Ecosystem
3.4. SWOT Analysis
3.5. Regulatory Scenario
3.3. Effects of Inflation, Russia-Ukraine War, moderating economic growth, and other macroeconomic factors
Chapter 4. Competitive Landscape
4.1. Market Share Analysis
4.1.1. Global Grass-fed Lamb Market Share by Company, 2023
4.1.2. Product Offerings of Leading Grass-fed Lamb Companies
4.2. Market Entropy
4.2.1. New Product Launches in the Industry
4.2.2. Mergers, Acquisitions, Joint ventures, and Partnerships
4.3. Key Strategies and Best Practices
Chapter 5. Global Market Projections: Best, Reference, and Low Case Scenarios
5.1. Growth Analysis- Case Scenario Definitions
5.2. Low Growth Case Scenario Forecasts
5.3. Reference Growth Case Scenario Forecasts
5.4. High Growth Case Scenario Forecasts
Chapter 6. Market Dynamics
6.1. Grass-fed Lamb Market Drivers
6.2. Grass-fed Lamb Market Challenges
6.6. Grass-fed Lamb Market Opportunities
6.4. Grass-fed Lamb Market Trends
Chapter 7. Global Grass-fed Lamb Market Outlook Trends
7.1. Global Grass-fed Lamb Revenue (USD Million) and CAGR (%) by Type (2021-2032)
7.2. Global Grass-fed Lamb Revenue (USD Million) and CAGR (%) by Application (2021-2032)
7.3. Global Grass-fed Lamb Revenue (USD Million) and CAGR (%) by Product (2021-2032)
By Type
Rack of Lamb
Organ Meats
Others
By End-User
HoReCa
Food Processing
Household
By Sales Channel
Convenience Stores
Hypermarkets/Supermarkets
Online Retail Stores
Meat Stores
Others
Chapter 8. Global Grass-fed Lamb Regional Analysis and Outlook
8.1. Global Grass-fed Lamb Revenue (USD Million) By Regions (2021- 2032)
8.2. North America Grass-fed Lamb Revenue (USD Million) by Country (2021-2032)
8.2.1. United States Grass-fed Lamb Regional Analysis and Outlook
8.2.2. Canada Grass-fed Lamb Regional Analysis and Outlook
8.2.3. Mexico Grass-fed Lamb Regional Analysis and Outlook
8.3. Europe Grass-fed Lamb Revenue (USD Million), by Country (2021-2032)
8.3.1. Germany Grass-fed Lamb Regional Analysis and Outlook
8.3.2. France Grass-fed Lamb Regional Analysis and Outlook
8.3.3. United Kingdom Grass-fed Lamb Regional Analysis and Outlook
8.3.4. Spain Grass-fed Lamb Regional Analysis and Outlook
8.3.5. Italy Grass-fed Lamb Regional Analysis and Outlook
8.3.6. Russia Grass-fed Lamb Regional Analysis and Outlook
8.3.7. Rest of Europe Grass-fed Lamb Regional Analysis and Outlook
8.4. Asia Pacific Grass-fed Lamb Revenue (USD Million) by Country (2021-2032)
8.4.1. China Grass-fed Lamb Regional Analysis and Outlook
8.4.2. Japan Grass-fed Lamb Regional Analysis and Outlook
8.4.3. India Grass-fed Lamb Regional Analysis and Outlook
8.4.4. South Korea Grass-fed Lamb Regional Analysis and Outlook
8.4.5. Australia Grass-fed Lamb Regional Analysis and Outlook
8.4.6. South East Asia Grass-fed Lamb Regional Analysis and Outlook
8.4.7. Rest of Asia Pacific Grass-fed Lamb Regional Analysis and Outlook
8.5. South America Grass-fed Lamb Revenue (USD Million), by Country (2021-2032)
8.5.1. Brazil Grass-fed Lamb Regional Analysis and Outlook
8.5.2. Argentina Grass-fed Lamb Regional Analysis and Outlook
8.5.3. Rest of South America Grass-fed Lamb Regional Analysis and Outlook
8.6. Middle East and Africa Grass-fed Lamb Revenue (USD Million) by Country (2021-2032)
8.6.1. Middle East Grass-fed Lamb Regional Analysis and Outlook
8.6.2. Africa Grass-fed Lamb Regional Analysis and Outlook
Chapter 9. North America Grass-fed Lamb Analysis and Outlook
9.1. North America Grass-fed Lamb Revenue (USD Million) by Segments (2021-2032)
9.1.1. North America Grass-fed Lamb Revenue (USD Million) by Type (2021-2032)
9.1.2. North America Grass-fed Lamb Revenue (USD Million) by Application (2021-2032)
9.1.3. North America Grass-fed Lamb Revenue (USD Million) by Product (2021-2032)
By Type
Rack of Lamb
Organ Meats
Others
By End-User
HoReCa
Food Processing
Household
By Sales Channel
Convenience Stores
Hypermarkets/Supermarkets
Online Retail Stores
Meat Stores
Others
Chapter 10. Europe Grass-fed Lamb Analysis and Outlook
10.1. Europe Grass-fed Lamb Revenue (USD Million), by Segments (USD Million) (2021-2032)
10.1.1. Europe Grass-fed Lamb Revenue (USD Million) by Type (2021-2032)
10.1.2. Europe Grass-fed Lamb Revenue (USD Million) by Application (2021-2032)
10.1.3. Europe Grass-fed Lamb Revenue (USD Million) by Product (2021-2032)
By Type
Rack of Lamb
Organ Meats
Others
By End-User
HoReCa
Food Processing
Household
By Sales Channel
Convenience Stores
Hypermarkets/Supermarkets
Online Retail Stores
Meat Stores
Others
Chapter 11. Asia Pacific Grass-fed Lamb Analysis and Outlook
11.1. Asia Pacific Grass-fed Lamb Revenue (USD Million), and Revenue (USD Million) by Segments (2021-2032)
11.1.1. Asia Pacific Grass-fed Lamb Revenue (USD Million) by Type (2021-2032)
11.1.2. Asia Pacific Grass-fed Lamb Revenue (USD Million) by Application (2021-2032)
11.1.3. Asia Pacific Grass-fed Lamb Revenue (USD Million) by Product (2021-2032)
By Type
Rack of Lamb
Organ Meats
Others
By End-User
HoReCa
Food Processing
Household
By Sales Channel
Convenience Stores
Hypermarkets/Supermarkets
Online Retail Stores
Meat Stores
Others
Chapter 12. South America Grass-fed Lamb Analysis and Outlook
12.1. South America Grass-fed Lamb Revenue (USD Million), by Segments (2021-2032)
12.1.1. South America Grass-fed Lamb Revenue (USD Million) by Type (2021-2032)
12.1.2. South America Grass-fed Lamb Revenue (USD Million) by Application (2021-2032)
12.1.3. South America Grass-fed Lamb Revenue (USD Million) by Product (2021-2032)
By Type
Rack of Lamb
Organ Meats
Others
By End-User
HoReCa
Food Processing
Household
By Sales Channel
Convenience Stores
Hypermarkets/Supermarkets
Online Retail Stores
Meat Stores
Others
Chapter 13. Middle East and Africa Grass-fed Lamb Analysis and Outlook
13.1. Middle East and Africa Grass-fed Lamb Revenue (USD Million), by Segments (2021-2032)
13.1.1. Middle East and Africa Grass-fed Lamb Revenue (USD Million) by Type (2021-2032)
13.1.2. Middle East and Africa Grass-fed Lamb Revenue (USD Million) by Application (2021-2032)
13.1.3. Middle East and Africa Grass-fed Lamb Revenue (USD Million) by Product (2021-2032)
By Type
Rack of Lamb
Organ Meats
Others
By End-User
HoReCa
Food Processing
Household
By Sales Channel
Convenience Stores
Hypermarkets/Supermarkets
Online Retail Stores
Meat Stores
Others
Chapter 14. Grass-fed Lamb Company Profiles
14.1 Business Overview
14.2 Product Profiles
14.3 SWOT Profiles
14.5 Recent Developments
14.6 Financial Profile
List of Companies
Australian Agriculture Company
Blue Rooster Farm
JH Grass Fed
Omaha Steaks
Perdue Premium Meat
Thomas Food International
15. Methodology and Data Sources
15.1 Customization Offerings
15.2 Subscription Services
15.3 Related Reports
15.4 Publisher Expertise
LIST OF TABLES
Table 1 Market Segmentation Analysis
Table 2 Global Grass-fed Lamb Market Share of Leading Companies, 2023
Table 3 Product Offerings of Leading Companies
Table 4 Low Growth Scenario Forecasts
Table 5 Reference Case Growth Scenario
Table 6 High Growth Case Scenario
Table 7 Global Grass-fed Lamb Revenue (USD Million) And CAGR (%) By Type (2021-2032)
Table 8 Global Grass-fed Lamb Revenue (USD Million) And CAGR (%) By Application (2021-2032)
Table 9 Global Grass-fed Lamb Revenue (USD Million) And CAGR (%) By Product (2021-2032)
Table 10 Global Grass-fed Lamb Market Revenue (USD Million) By Regions (2021-2032)
Table 11 Global Grass-fed Lamb Market Share (%) By Regions (2021-2032)
Table 12 North America Grass-fed Lamb Revenue (USD Million) By Country (2021-2032)
Table 13 Europe Grass-fed Lamb Revenue (USD Million) By Country (2021-2032)
Table 14 Asia Pacific Grass-fed Lamb Revenue (USD Million) By Country (2021-2032)
Table 15 South America Grass-fed Lamb Revenue (USD Million) By Country (2021-2032)
Table 16 Middle East and Africa Grass-fed Lamb Revenue (USD Million) By Region (2021-2032)
Table 17 North America Grass-fed Lamb Revenue (USD Million) By Type (2021-2032)
Table 18 North America Grass-fed Lamb Revenue (USD Million) By Application (2021-2032)
Table 19 North America Grass-fed Lamb Revenue (USD Million) By Product (2021-2032)
Table 20 Europe Grass-fed Lamb Revenue (USD Million) By Type (2021-2032)
Table 21 Europe Grass-fed Lamb Revenue (USD Million) By Application (2021-2032)
Table 22 Europe Grass-fed Lamb Revenue (USD Million) By Product (2021-2032)
Table 23 Asia Pacific Grass-fed Lamb Revenue (USD Million) By Type (2021-2032)
Table 24 Asia Pacific Grass-fed Lamb Revenue (USD Million) By Application (2021-2032)
Table 25 Asia Pacific Grass-fed Lamb Revenue (USD Million) By Product (2021-2032)
Table 26 South America Grass-fed Lamb Revenue (USD Million) By Type (2021-2032)
Table 27 South America Grass-fed Lamb Revenue (USD Million) By Application (2021-2032)
Table 28 South America Grass-fed Lamb Revenue (USD Million) By Product (2021-2032)
Table 29 Middle East and Africa Grass-fed Lamb Revenue (USD Million) By Type (2021-2032)
Table 30 Middle East and Africa Grass-fed Lamb Revenue (USD Million) By Application (2021-2032)
Table 31 Middle East and Africa Grass-fed Lamb Revenue (USD Million) By Product (2021-2032)
LIST OF FIGURES
Figure 1. Market Scope
Figure 2. Pricing Forecasts Per Unit, 2023- 2032
Figure 3. Porter’s Five Forces
Figure 4. Global Grass-fed Lamb Market Revenue (USD Million) By Regions (2021-2032)
Figure 5. Global Grass-fed Lamb Market Share (%) By Regions (2023)
Figure 6. North America Grass-fed Lamb Revenue (USD Million) By Country (2021-2032)
Figure 7. United States Grass-fed Lamb Revenue (USD Million) By Country (2021-2032)
Figure 8. Canada Grass-fed Lamb Revenue (USD Million) By Country (2021-2032)
Figure 9. Mexico Grass-fed Lamb Revenue (USD Million) By Country (2021-2032)
Figure 10. Europe Grass-fed Lamb Revenue (USD Million) By Country (2021-2032)
Figure 11. Germany Grass-fed Lamb Revenue (USD Million) By Country (2021-2032)
Figure 12. France Grass-fed Lamb Revenue (USD Million) By Country (2021-2032)
Figure 13. United Kingdom Grass-fed Lamb Revenue (USD Million) By Country (2021-2032)
Figure 14. Spain Grass-fed Lamb Revenue (USD Million) By Country (2021-2032)
Figure 15. Italy Grass-fed Lamb Revenue (USD Million) By Country (2021-2032)
Figure 16. Russia Grass-fed Lamb Revenue (USD Million) By Country (2021-2032)
Figure 17. Rest of Europe Grass-fed Lamb Revenue (USD Million) By Country (2021-2032)
Figure 11. Asia Pacific Grass-fed Lamb Revenue (USD Million) By Country (2021-2032)
Figure 12. China Grass-fed Lamb Revenue (USD Million) By Country (2021-2032)
Figure 13. Japan Grass-fed Lamb Revenue (USD Million) By Country (2021-2032)
Figure 14. India Grass-fed Lamb Revenue (USD Million) By Country (2021-2032)
Figure 15. South Korea Grass-fed Lamb Revenue (USD Million) By Country (2021-2032)
Figure 16. Australia Grass-fed Lamb Revenue (USD Million) By Country (2021-2032)
Figure 17. South East Asia Grass-fed Lamb Revenue (USD Million) By Country (2021-2032)
Figure 18. South America Grass-fed Lamb Revenue (USD Million) By Country (2021-2032)
Figure 19. Brazil Grass-fed Lamb Revenue (USD Million) By Country (2021-2032)
Figure 20. Argentina Grass-fed Lamb Revenue (USD Million) By Country (2021-2032)
Figure 21. Rest of Asia Pacific Grass-fed Lamb Revenue (USD Million) By Country (2021-2032)
Figure 22. Middle East and Africa Grass-fed Lamb Revenue (USD Million) By Region (2021-2032)
Figure 23. Saudi Arabia Grass-fed Lamb Revenue (USD Million) By Region (2021-2032)
Figure 24. The UAE Grass-fed Lamb Revenue (USD Million) By Region (2021-2032)
Figure 25. Rest of Middle East Grass-fed Lamb Revenue (USD Million) By Region (2021-2032)
Figure 26. South Africa Grass-fed Lamb Revenue (USD Million) By Region (2021-2032)
Figure 27. Africa Grass-fed Lamb Revenue (USD Million) By Region (2021-2032)
Figure 28. North America Grass-fed Lamb Revenue (USD Million) By Type (2021-2032)
Figure 29. North America Grass-fed Lamb Revenue (USD Million) By Application (2021-2032)
Figure 30. North America Grass-fed Lamb Revenue (USD Million) By Product (2021-2032)
Figure 31. Europe Grass-fed Lamb Revenue (USD Million) By Type (2021-2032)
Figure 32. Europe Grass-fed Lamb Revenue (USD Million) By Application (2021-2032)
Figure 33. Europe Grass-fed Lamb Revenue (USD Million) By Product (2021-2032)
Figure 34. Asia Pacific Grass-fed Lamb Revenue (USD Million) By Type (2021-2032)
Figure 35. Asia Pacific Grass-fed Lamb Revenue (USD Million) By Application (2021-2032)
Figure 36. Asia Pacific Grass-fed Lamb Revenue (USD Million) By Product (2021-2032)
Figure 37. South America Grass-fed Lamb Revenue (USD Million) By Type (2021-2032)
Figure 38. South America Grass-fed Lamb Revenue (USD Million) By Application (2021-2032)
Figure 39. South America Grass-fed Lamb Revenue (USD Million) By Product (2021-2032)
Figure 40. Middle East and Africa Grass-fed Lamb Revenue (USD Million) By Type (2021-2032)
Figure 41. Middle East and Africa Grass-fed Lamb Revenue (USD Million) By Application (2021-2032)
Figure 42. Middle East and Africa Grass-fed Lamb Revenue (USD Million) By Product (2021-2032)
By Type
Rack of Lamb
Organ Meats
Others
By End-User
HoReCa
Food Processing
Household
By Sales Channel
Convenience Stores
Hypermarkets/Supermarkets
Online Retail Stores
Meat Stores
Others
Countries Analyzed
North America (US, Canada, Mexico)
Europe (Germany, UK, France, Spain, Italy, Russia, Rest of Europe)
Asia Pacific (China, India, Japan, South Korea, Australia, South East Asia, Rest of Asia)
South America (Brazil, Argentina, Rest of South America)
Middle East and Africa (Saudi Arabia, UAE, Rest of Middle East, South Africa, Egypt, Rest of Africa)
