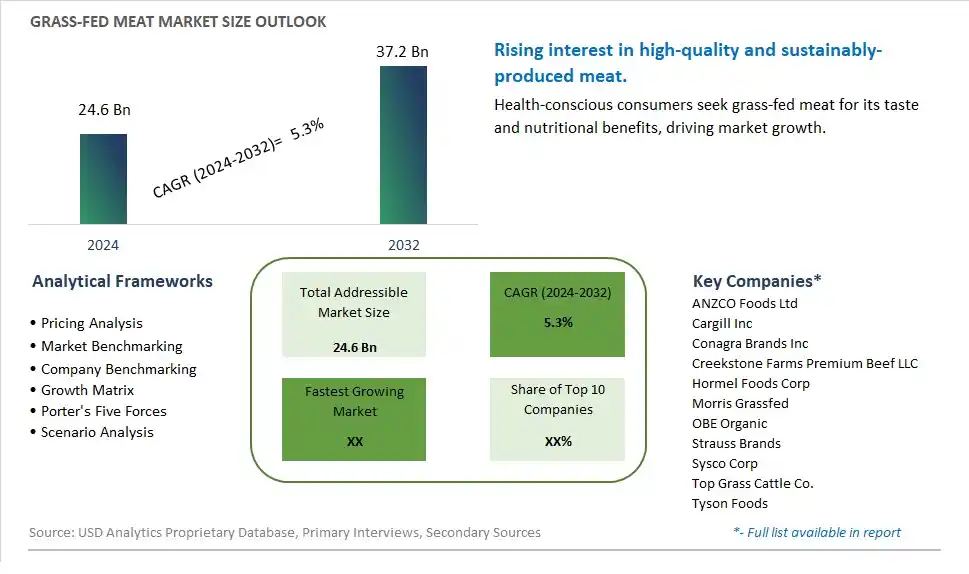
Global Grass-fed Meat Market Size is valued at $24.6 Billion in 2024 and is forecast to register a growth rate (CAGR) of 5.3% to reach $37.2 Billion by 2032.
The global Grass-fed Meat Market Comprehensive Study analyzes and forecasts the market size across 6 regions and 24 countries for diverse segments -By Product (Raw Meat, Processed Meat, Fresh Processed, Cured Meat, Roasted and Precooked, Dried), By Animal (Cow, Bison, Lamb, Goat), By Nature (Organic, Conventional), By End-User (HoReCa, Food Processing, Household), By Sales Channel (Convenience Stores, Hypermarkets/Supermarkets, Online Retail Stores, Meat Stores, Others)
An Introduction to Grass-fed Meat Market
The Grass-Fed Meat Market focuses on the production and sale of meat sourced from grass-fed animals, which is perceived to be healthier and more sustainable. These meats include beef, lamb, and pork. The market is driven by increasing consumer demand for natural and organic foods, rising awareness about the benefits of grass-fed meat, and growing preference for sustainable and ethical food production practices. Additionally, advancements in livestock farming and meat processing technologies support market growth.
Grass-fed Meat Competitive Landscape
The market report analyses the leading companies in the industry including ANZCO Foods Ltd, Cargill Inc, Conagra Brands Inc, Creekstone Farms Premium Beef LLC, Hormel Foods Corp, Morris Grassfed, OBE Organic, Strauss Brands, Sysco Corp, Top Grass Cattle Co., Tyson Foods, and Others.
Grass-fed Meat Market Dynamics
Grass-fed Meat Market Trend: Rising Popularity of Grass-Fed and Organic Meats
The most prominent trend in the Grass-fed Meat Market is the rising popularity of grass-fed and organic meats. As consumers seek healthier and more sustainable meat options, grass-fed meat is gaining traction for its perceived nutritional benefits and eco-friendly production methods. This trend is driven by the growing demand for clean-label and premium meat products.
Grass-fed Meat Market Driver: Growth in Health and Environmental Awareness
The key driver of the Grass-fed Meat Market is the growth in health and environmental awareness. As more people focus on maintaining a healthy diet and reducing their environmental impact, there is a higher demand for meat products that offer superior nutritional value and are produced sustainably. This driver is supported by the trend towards functional foods and the increasing availability of grass-fed meat products in the market, driving growth for grass-fed meat.
Grass-fed Meat Market Opportunity: Innovation in Meat Product Development
A significant opportunity in the Grass-fed Meat Market lies in innovation in meat product development. By creating new and unique grass-fed meat products, such as sausages, burgers, and ready-to-eat meals, companies can attract health-conscious consumers looking for nutritious and sustainable options. Offering high-quality grass-fed meat products that cater to diverse dietary preferences can help expand market reach and drive growth in the premium meat sector.
Grass-fed Meat Market Share Analysis- Largest Segment by Product
The Raw Meat segment is the largest in the Grass-fed Meat Market by product. This dominance is driven by the high demand for fresh, unprocessed meat that retains its natural flavors and nutritional benefits. Consumers prefer raw grass-fed meat for its superior taste, tenderness, and health benefits, including higher levels of omega-3 fatty acids and conjugated linoleic acid (CLA). The continuous innovation in meat processing and packaging, including vacuum-sealed and portion-controlled options, enhances the appeal and convenience of raw meat products. Additionally, the growing trend of home cooking and the increasing popularity of gourmet and health-conscious eating habits support the significant market share of the raw meat segment. The extensive availability of raw grass-fed meat in supermarkets, specialty meat stores, and online platforms further boosts its accessibility to a broad consumer base. The strong consumer preference for high-quality and natural meat options reinforces the dominant position of the raw meat segment in the market.
Grass-fed Meat Market Share Analysis- Fastest Growing Segment by Animal
The Bison segment is poised to grow the fastest in the Grass-fed Meat Market by animal over the next five years. This rapid growth is driven by the increasing consumer interest in alternative and exotic meat options that offer unique flavors and nutritional benefits. Grass-fed bison meat is known for its lean profile, rich taste, and high protein content, making it a popular choice among health-conscious consumers and those seeking novel culinary experiences. The continuous innovation in bison meat products, including the introduction of new cuts and processed options, enhances their appeal. Additionally, the growing trend of sustainable and ethical meat consumption supports the demand for grass-fed bison, which is often raised in environmentally friendly and humane conditions. The expanding availability of bison meat in specialty stores, gourmet supermarkets, and online platforms further drives its market growth. The influence of chefs and food influencers in promoting the culinary versatility and health benefits of bison meat also contributes to its fast growth.
Grass-fed Meat Market Share Analysis- Largest Segment by Nature
The Organic segment is the largest in the Grass-fed Meat Market by nature. This dominance is driven by the high consumer demand for organic meat products, which are perceived as healthier, more nutritious, and ethically produced. Organic grass-fed meat is raised without the use of synthetic pesticides, hormones, or antibiotics, ensuring a clean and natural product. The continuous innovation in organic meat processing and packaging, including eco-friendly and sustainable options, enhances their appeal. Additionally, the growing trend of clean-label and organic products supports the significant market share of the organic segment, as consumers seek natural and minimally processed food options. The extensive availability of organic grass-fed meat in health food stores, specialty stores, and online platforms further boosts its accessibility to a broad consumer base. The strong consumer preference for organic and high-quality meat products reinforces the dominant position of the organic segment in the market.
Grass-fed Meat Market Share Analysis- Fastest Growing Segment by End-User
The HoReCa (Hotel, Restaurant, and Catering) segment is poised to grow the fastest in the Grass-fed Meat Market by end-user over the next five years. This rapid growth is driven by the increasing demand for high-quality and sustainably sourced meat in the hospitality and foodservice industry. Grass-fed meat is preferred for its superior flavor, nutritional profile, and ethical production practices, making it a popular choice in premium dining establishments and catering services. The continuous innovation in culinary offerings and the growing trend of gourmet and farm-to-table dining support the fast growth of this segment. Additionally, the expanding hospitality industry, particularly in emerging markets, and the increasing focus on providing diverse and high-quality menu options contribute to the rapid growth of the HoReCa segment. The influence of chefs and food influencers in promoting the benefits and unique flavors of grass-fed meat also drives its demand in this sector.
Grass-fed Meat Market Segmentation
By Product
Raw Meat
Processed Meat
Fresh Processed
Cured Meat
Roasted and Precooked
Dried
By Animal
Cow
Bison
Lamb
Goat
By Nature
Organic
Conventional
By End-User
HoReCa
Food Processing
Household
By Sales Channel
Convenience Stores
Hypermarkets/Supermarkets
Online Retail Stores
Meat Stores
Others
Countries Analyzed
North America (US, Canada, Mexico)
Europe (Germany, UK, France, Spain, Italy, Russia, Rest of Europe)
Asia Pacific (China, India, Japan, South Korea, Australia, South East Asia, Rest of Asia)
South America (Brazil, Argentina, Rest of South America)
Middle East and Africa (Saudi Arabia, UAE, Rest of Middle East, South Africa, Egypt, Rest of Africa)
Grass-fed Meat Companies Profiled in the Study
ANZCO Foods Ltd
Cargill Inc
Conagra Brands Inc
Creekstone Farms Premium Beef LLC
Hormel Foods Corp
Morris Grassfed
OBE Organic
Strauss Brands
Sysco Corp
Top Grass Cattle Co.
Tyson Foods
*- List Not Exhaustive
Chapter 1. TABLE OF CONTENTS
Chapter 2. Introduction to Grass-fed Meat Market
2.1. Market Overview
2.2. Key Statistics and Report Highlights
2.3. Scope of the Comprehensive Study
2.3.1. Market Definition
2.3.2 Countries and Regions Covered
2.3.3 Research Objective
2.3.4 Units, Currency, and Conversions
2.3.5 Industry Value Chain
2.4. Key Market Segments
2.5. Key Companies
2.6. Study Period
Chapter 3. Strategic Analysis Review
3.1. Grass-fed Meat Pricing Analysis and Forecast
3.2. Porter’s Five Forces
3.3. Market Ecosystem
3.4. SWOT Analysis
3.5. Regulatory Scenario
3.3. Effects of Inflation, Russia-Ukraine War, moderating economic growth, and other macroeconomic factors
Chapter 4. Competitive Landscape
4.1. Market Share Analysis
4.1.1. Global Grass-fed Meat Market Share by Company, 2023
4.1.2. Product Offerings of Leading Grass-fed Meat Companies
4.2. Market Entropy
4.2.1. New Product Launches in the Industry
4.2.2. Mergers, Acquisitions, Joint ventures, and Partnerships
4.3. Key Strategies and Best Practices
Chapter 5. Global Market Projections: Best, Reference, and Low Case Scenarios
5.1. Growth Analysis- Case Scenario Definitions
5.2. Low Growth Case Scenario Forecasts
5.3. Reference Growth Case Scenario Forecasts
5.4. High Growth Case Scenario Forecasts
Chapter 6. Market Dynamics
6.1. Grass-fed Meat Market Drivers
6.2. Grass-fed Meat Market Challenges
6.6. Grass-fed Meat Market Opportunities
6.4. Grass-fed Meat Market Trends
Chapter 7. Global Grass-fed Meat Market Outlook Trends
7.1. Global Grass-fed Meat Revenue (USD Million) and CAGR (%) by Type (2021-2032)
7.2. Global Grass-fed Meat Revenue (USD Million) and CAGR (%) by Application (2021-2032)
7.3. Global Grass-fed Meat Revenue (USD Million) and CAGR (%) by Product (2021-2032)
By Product
Raw Meat
Processed Meat
Fresh Processed
Cured Meat
Roasted and Precooked
Dried
By Animal
Cow
Bison
Lamb
Goat
By Nature
Organic
Conventional
By End-User
HoReCa
Food Processing
Household
By Sales Channel
Convenience Stores
Hypermarkets/Supermarkets
Online Retail Stores
Meat Stores
Others
Chapter 8. Global Grass-fed Meat Regional Analysis and Outlook
8.1. Global Grass-fed Meat Revenue (USD Million) By Regions (2021- 2032)
8.2. North America Grass-fed Meat Revenue (USD Million) by Country (2021-2032)
8.2.1. United States Grass-fed Meat Regional Analysis and Outlook
8.2.2. Canada Grass-fed Meat Regional Analysis and Outlook
8.2.3. Mexico Grass-fed Meat Regional Analysis and Outlook
8.3. Europe Grass-fed Meat Revenue (USD Million), by Country (2021-2032)
8.3.1. Germany Grass-fed Meat Regional Analysis and Outlook
8.3.2. France Grass-fed Meat Regional Analysis and Outlook
8.3.3. United Kingdom Grass-fed Meat Regional Analysis and Outlook
8.3.4. Spain Grass-fed Meat Regional Analysis and Outlook
8.3.5. Italy Grass-fed Meat Regional Analysis and Outlook
8.3.6. Russia Grass-fed Meat Regional Analysis and Outlook
8.3.7. Rest of Europe Grass-fed Meat Regional Analysis and Outlook
8.4. Asia Pacific Grass-fed Meat Revenue (USD Million) by Country (2021-2032)
8.4.1. China Grass-fed Meat Regional Analysis and Outlook
8.4.2. Japan Grass-fed Meat Regional Analysis and Outlook
8.4.3. India Grass-fed Meat Regional Analysis and Outlook
8.4.4. South Korea Grass-fed Meat Regional Analysis and Outlook
8.4.5. Australia Grass-fed Meat Regional Analysis and Outlook
8.4.6. South East Asia Grass-fed Meat Regional Analysis and Outlook
8.4.7. Rest of Asia Pacific Grass-fed Meat Regional Analysis and Outlook
8.5. South America Grass-fed Meat Revenue (USD Million), by Country (2021-2032)
8.5.1. Brazil Grass-fed Meat Regional Analysis and Outlook
8.5.2. Argentina Grass-fed Meat Regional Analysis and Outlook
8.5.3. Rest of South America Grass-fed Meat Regional Analysis and Outlook
8.6. Middle East and Africa Grass-fed Meat Revenue (USD Million) by Country (2021-2032)
8.6.1. Middle East Grass-fed Meat Regional Analysis and Outlook
8.6.2. Africa Grass-fed Meat Regional Analysis and Outlook
Chapter 9. North America Grass-fed Meat Analysis and Outlook
9.1. North America Grass-fed Meat Revenue (USD Million) by Segments (2021-2032)
9.1.1. North America Grass-fed Meat Revenue (USD Million) by Type (2021-2032)
9.1.2. North America Grass-fed Meat Revenue (USD Million) by Application (2021-2032)
9.1.3. North America Grass-fed Meat Revenue (USD Million) by Product (2021-2032)
By Product
Raw Meat
Processed Meat
Fresh Processed
Cured Meat
Roasted and Precooked
Dried
By Animal
Cow
Bison
Lamb
Goat
By Nature
Organic
Conventional
By End-User
HoReCa
Food Processing
Household
By Sales Channel
Convenience Stores
Hypermarkets/Supermarkets
Online Retail Stores
Meat Stores
Others
Chapter 10. Europe Grass-fed Meat Analysis and Outlook
10.1. Europe Grass-fed Meat Revenue (USD Million), by Segments (USD Million) (2021-2032)
10.1.1. Europe Grass-fed Meat Revenue (USD Million) by Type (2021-2032)
10.1.2. Europe Grass-fed Meat Revenue (USD Million) by Application (2021-2032)
10.1.3. Europe Grass-fed Meat Revenue (USD Million) by Product (2021-2032)
By Product
Raw Meat
Processed Meat
Fresh Processed
Cured Meat
Roasted and Precooked
Dried
By Animal
Cow
Bison
Lamb
Goat
By Nature
Organic
Conventional
By End-User
HoReCa
Food Processing
Household
By Sales Channel
Convenience Stores
Hypermarkets/Supermarkets
Online Retail Stores
Meat Stores
Others
Chapter 11. Asia Pacific Grass-fed Meat Analysis and Outlook
11.1. Asia Pacific Grass-fed Meat Revenue (USD Million), and Revenue (USD Million) by Segments (2021-2032)
11.1.1. Asia Pacific Grass-fed Meat Revenue (USD Million) by Type (2021-2032)
11.1.2. Asia Pacific Grass-fed Meat Revenue (USD Million) by Application (2021-2032)
11.1.3. Asia Pacific Grass-fed Meat Revenue (USD Million) by Product (2021-2032)
By Product
Raw Meat
Processed Meat
Fresh Processed
Cured Meat
Roasted and Precooked
Dried
By Animal
Cow
Bison
Lamb
Goat
By Nature
Organic
Conventional
By End-User
HoReCa
Food Processing
Household
By Sales Channel
Convenience Stores
Hypermarkets/Supermarkets
Online Retail Stores
Meat Stores
Others
Chapter 12. South America Grass-fed Meat Analysis and Outlook
12.1. South America Grass-fed Meat Revenue (USD Million), by Segments (2021-2032)
12.1.1. South America Grass-fed Meat Revenue (USD Million) by Type (2021-2032)
12.1.2. South America Grass-fed Meat Revenue (USD Million) by Application (2021-2032)
12.1.3. South America Grass-fed Meat Revenue (USD Million) by Product (2021-2032)
By Product
Raw Meat
Processed Meat
Fresh Processed
Cured Meat
Roasted and Precooked
Dried
By Animal
Cow
Bison
Lamb
Goat
By Nature
Organic
Conventional
By End-User
HoReCa
Food Processing
Household
By Sales Channel
Convenience Stores
Hypermarkets/Supermarkets
Online Retail Stores
Meat Stores
Others
Chapter 13. Middle East and Africa Grass-fed Meat Analysis and Outlook
13.1. Middle East and Africa Grass-fed Meat Revenue (USD Million), by Segments (2021-2032)
13.1.1. Middle East and Africa Grass-fed Meat Revenue (USD Million) by Type (2021-2032)
13.1.2. Middle East and Africa Grass-fed Meat Revenue (USD Million) by Application (2021-2032)
13.1.3. Middle East and Africa Grass-fed Meat Revenue (USD Million) by Product (2021-2032)
By Product
Raw Meat
Processed Meat
Fresh Processed
Cured Meat
Roasted and Precooked
Dried
By Animal
Cow
Bison
Lamb
Goat
By Nature
Organic
Conventional
By End-User
HoReCa
Food Processing
Household
By Sales Channel
Convenience Stores
Hypermarkets/Supermarkets
Online Retail Stores
Meat Stores
Others
Chapter 14. Grass-fed Meat Company Profiles
14.1 Business Overview
14.2 Product Profiles
14.3 SWOT Profiles
14.5 Recent Developments
14.6 Financial Profile
List of Companies
ANZCO Foods Ltd
Cargill Inc
Conagra Brands Inc
Creekstone Farms Premium Beef LLC
Hormel Foods Corp
Morris Grassfed
OBE Organic
Strauss Brands
Sysco Corp
Top Grass Cattle Co.
Tyson Foods
15. Methodology and Data Sources
15.1 Customization Offerings
15.2 Subscription Services
15.3 Related Reports
15.4 Publisher Expertise
LIST OF TABLES
Table 1 Market Segmentation Analysis
Table 2 Global Grass-fed Meat Market Share of Leading Companies, 2023
Table 3 Product Offerings of Leading Companies
Table 4 Low Growth Scenario Forecasts
Table 5 Reference Case Growth Scenario
Table 6 High Growth Case Scenario
Table 7 Global Grass-fed Meat Revenue (USD Million) And CAGR (%) By Type (2021-2032)
Table 8 Global Grass-fed Meat Revenue (USD Million) And CAGR (%) By Application (2021-2032)
Table 9 Global Grass-fed Meat Revenue (USD Million) And CAGR (%) By Product (2021-2032)
Table 10 Global Grass-fed Meat Market Revenue (USD Million) By Regions (2021-2032)
Table 11 Global Grass-fed Meat Market Share (%) By Regions (2021-2032)
Table 12 North America Grass-fed Meat Revenue (USD Million) By Country (2021-2032)
Table 13 Europe Grass-fed Meat Revenue (USD Million) By Country (2021-2032)
Table 14 Asia Pacific Grass-fed Meat Revenue (USD Million) By Country (2021-2032)
Table 15 South America Grass-fed Meat Revenue (USD Million) By Country (2021-2032)
Table 16 Middle East and Africa Grass-fed Meat Revenue (USD Million) By Region (2021-2032)
Table 17 North America Grass-fed Meat Revenue (USD Million) By Type (2021-2032)
Table 18 North America Grass-fed Meat Revenue (USD Million) By Application (2021-2032)
Table 19 North America Grass-fed Meat Revenue (USD Million) By Product (2021-2032)
Table 20 Europe Grass-fed Meat Revenue (USD Million) By Type (2021-2032)
Table 21 Europe Grass-fed Meat Revenue (USD Million) By Application (2021-2032)
Table 22 Europe Grass-fed Meat Revenue (USD Million) By Product (2021-2032)
Table 23 Asia Pacific Grass-fed Meat Revenue (USD Million) By Type (2021-2032)
Table 24 Asia Pacific Grass-fed Meat Revenue (USD Million) By Application (2021-2032)
Table 25 Asia Pacific Grass-fed Meat Revenue (USD Million) By Product (2021-2032)
Table 26 South America Grass-fed Meat Revenue (USD Million) By Type (2021-2032)
Table 27 South America Grass-fed Meat Revenue (USD Million) By Application (2021-2032)
Table 28 South America Grass-fed Meat Revenue (USD Million) By Product (2021-2032)
Table 29 Middle East and Africa Grass-fed Meat Revenue (USD Million) By Type (2021-2032)
Table 30 Middle East and Africa Grass-fed Meat Revenue (USD Million) By Application (2021-2032)
Table 31 Middle East and Africa Grass-fed Meat Revenue (USD Million) By Product (2021-2032)
LIST OF FIGURES
Figure 1. Market Scope
Figure 2. Pricing Forecasts Per Unit, 2023- 2032
Figure 3. Porter’s Five Forces
Figure 4. Global Grass-fed Meat Market Revenue (USD Million) By Regions (2021-2032)
Figure 5. Global Grass-fed Meat Market Share (%) By Regions (2023)
Figure 6. North America Grass-fed Meat Revenue (USD Million) By Country (2021-2032)
Figure 7. United States Grass-fed Meat Revenue (USD Million) By Country (2021-2032)
Figure 8. Canada Grass-fed Meat Revenue (USD Million) By Country (2021-2032)
Figure 9. Mexico Grass-fed Meat Revenue (USD Million) By Country (2021-2032)
Figure 10. Europe Grass-fed Meat Revenue (USD Million) By Country (2021-2032)
Figure 11. Germany Grass-fed Meat Revenue (USD Million) By Country (2021-2032)
Figure 12. France Grass-fed Meat Revenue (USD Million) By Country (2021-2032)
Figure 13. United Kingdom Grass-fed Meat Revenue (USD Million) By Country (2021-2032)
Figure 14. Spain Grass-fed Meat Revenue (USD Million) By Country (2021-2032)
Figure 15. Italy Grass-fed Meat Revenue (USD Million) By Country (2021-2032)
Figure 16. Russia Grass-fed Meat Revenue (USD Million) By Country (2021-2032)
Figure 17. Rest of Europe Grass-fed Meat Revenue (USD Million) By Country (2021-2032)
Figure 11. Asia Pacific Grass-fed Meat Revenue (USD Million) By Country (2021-2032)
Figure 12. China Grass-fed Meat Revenue (USD Million) By Country (2021-2032)
Figure 13. Japan Grass-fed Meat Revenue (USD Million) By Country (2021-2032)
Figure 14. India Grass-fed Meat Revenue (USD Million) By Country (2021-2032)
Figure 15. South Korea Grass-fed Meat Revenue (USD Million) By Country (2021-2032)
Figure 16. Australia Grass-fed Meat Revenue (USD Million) By Country (2021-2032)
Figure 17. South East Asia Grass-fed Meat Revenue (USD Million) By Country (2021-2032)
Figure 18. South America Grass-fed Meat Revenue (USD Million) By Country (2021-2032)
Figure 19. Brazil Grass-fed Meat Revenue (USD Million) By Country (2021-2032)
Figure 20. Argentina Grass-fed Meat Revenue (USD Million) By Country (2021-2032)
Figure 21. Rest of Asia Pacific Grass-fed Meat Revenue (USD Million) By Country (2021-2032)
Figure 22. Middle East and Africa Grass-fed Meat Revenue (USD Million) By Region (2021-2032)
Figure 23. Saudi Arabia Grass-fed Meat Revenue (USD Million) By Region (2021-2032)
Figure 24. The UAE Grass-fed Meat Revenue (USD Million) By Region (2021-2032)
Figure 25. Rest of Middle East Grass-fed Meat Revenue (USD Million) By Region (2021-2032)
Figure 26. South Africa Grass-fed Meat Revenue (USD Million) By Region (2021-2032)
Figure 27. Africa Grass-fed Meat Revenue (USD Million) By Region (2021-2032)
Figure 28. North America Grass-fed Meat Revenue (USD Million) By Type (2021-2032)
Figure 29. North America Grass-fed Meat Revenue (USD Million) By Application (2021-2032)
Figure 30. North America Grass-fed Meat Revenue (USD Million) By Product (2021-2032)
Figure 31. Europe Grass-fed Meat Revenue (USD Million) By Type (2021-2032)
Figure 32. Europe Grass-fed Meat Revenue (USD Million) By Application (2021-2032)
Figure 33. Europe Grass-fed Meat Revenue (USD Million) By Product (2021-2032)
Figure 34. Asia Pacific Grass-fed Meat Revenue (USD Million) By Type (2021-2032)
Figure 35. Asia Pacific Grass-fed Meat Revenue (USD Million) By Application (2021-2032)
Figure 36. Asia Pacific Grass-fed Meat Revenue (USD Million) By Product (2021-2032)
Figure 37. South America Grass-fed Meat Revenue (USD Million) By Type (2021-2032)
Figure 38. South America Grass-fed Meat Revenue (USD Million) By Application (2021-2032)
Figure 39. South America Grass-fed Meat Revenue (USD Million) By Product (2021-2032)
Figure 40. Middle East and Africa Grass-fed Meat Revenue (USD Million) By Type (2021-2032)
Figure 41. Middle East and Africa Grass-fed Meat Revenue (USD Million) By Application (2021-2032)
Figure 42. Middle East and Africa Grass-fed Meat Revenue (USD Million) By Product (2021-2032)
By Product
Raw Meat
Processed Meat
Fresh Processed
Cured Meat
Roasted and Precooked
Dried
By Animal
Cow
Bison
Lamb
Goat
By Nature
Organic
Conventional
By End-User
HoReCa
Food Processing
Household
By Sales Channel
Convenience Stores
Hypermarkets/Supermarkets
Online Retail Stores
Meat Stores
Others
Countries Analyzed
North America (US, Canada, Mexico)
Europe (Germany, UK, France, Spain, Italy, Russia, Rest of Europe)
Asia Pacific (China, India, Japan, South Korea, Australia, South East Asia, Rest of Asia)
South America (Brazil, Argentina, Rest of South America)
Middle East and Africa (Saudi Arabia, UAE, Rest of Middle East, South Africa, Egypt, Rest of Africa)
